Heatmap Analysis for Venue Traffic: A Practical Guide
This technical reference guide provides actionable strategies for deploying and analysing WiFi-based heatmaps in physical venues. It explains how IT and operations leaders can leverage existing network infrastructure to uncover customer flow patterns, eliminate bottlenecks, and optimise spatial ROI.
🎧 Listen to this Guide
View Transcript
Executive Summary
For venue operators, retail merchandisers, and property owners, physical space is the most expensive asset on the balance sheet. Traditional footfall counting at entrances provides only a rudimentary understanding of occupancy, failing to answer critical questions about customer behaviour, dwell times, and spatial utilisation. WiFi heatmap analysis bridges this gap by transforming existing wireless infrastructure into a powerful location intelligence platform. By capturing and analysing device presence data, organisations can visualise customer flow patterns, identify operational bottlenecks, and pinpoint high-value zones across their floor plans. This guide provides a practical, vendor-neutral framework for deploying heatmap analytics, ensuring accurate data collection, and translating spatial intelligence into measurable business outcomes. Whether you are managing a stadium concourse, a retail flagship, or a hotel lobby, this reference will equip you to make data-driven decisions that optimise layout, improve guest experience, and maximise ROI.
Technical Deep-Dive: How WiFi Heatmaps Are Generated
The foundation of WiFi heatmap analysis is presence detection. When a visitor's smartphone or wearable device has its WiFi interface enabled, it periodically broadcasts probe requests to discover known networks. Access points (APs) within range listen for these probes and measure the Received Signal Strength Indicator (RSSI). By aggregating RSSI data from multiple APs simultaneously, the network can triangulate the device's position on a digital floor plan.
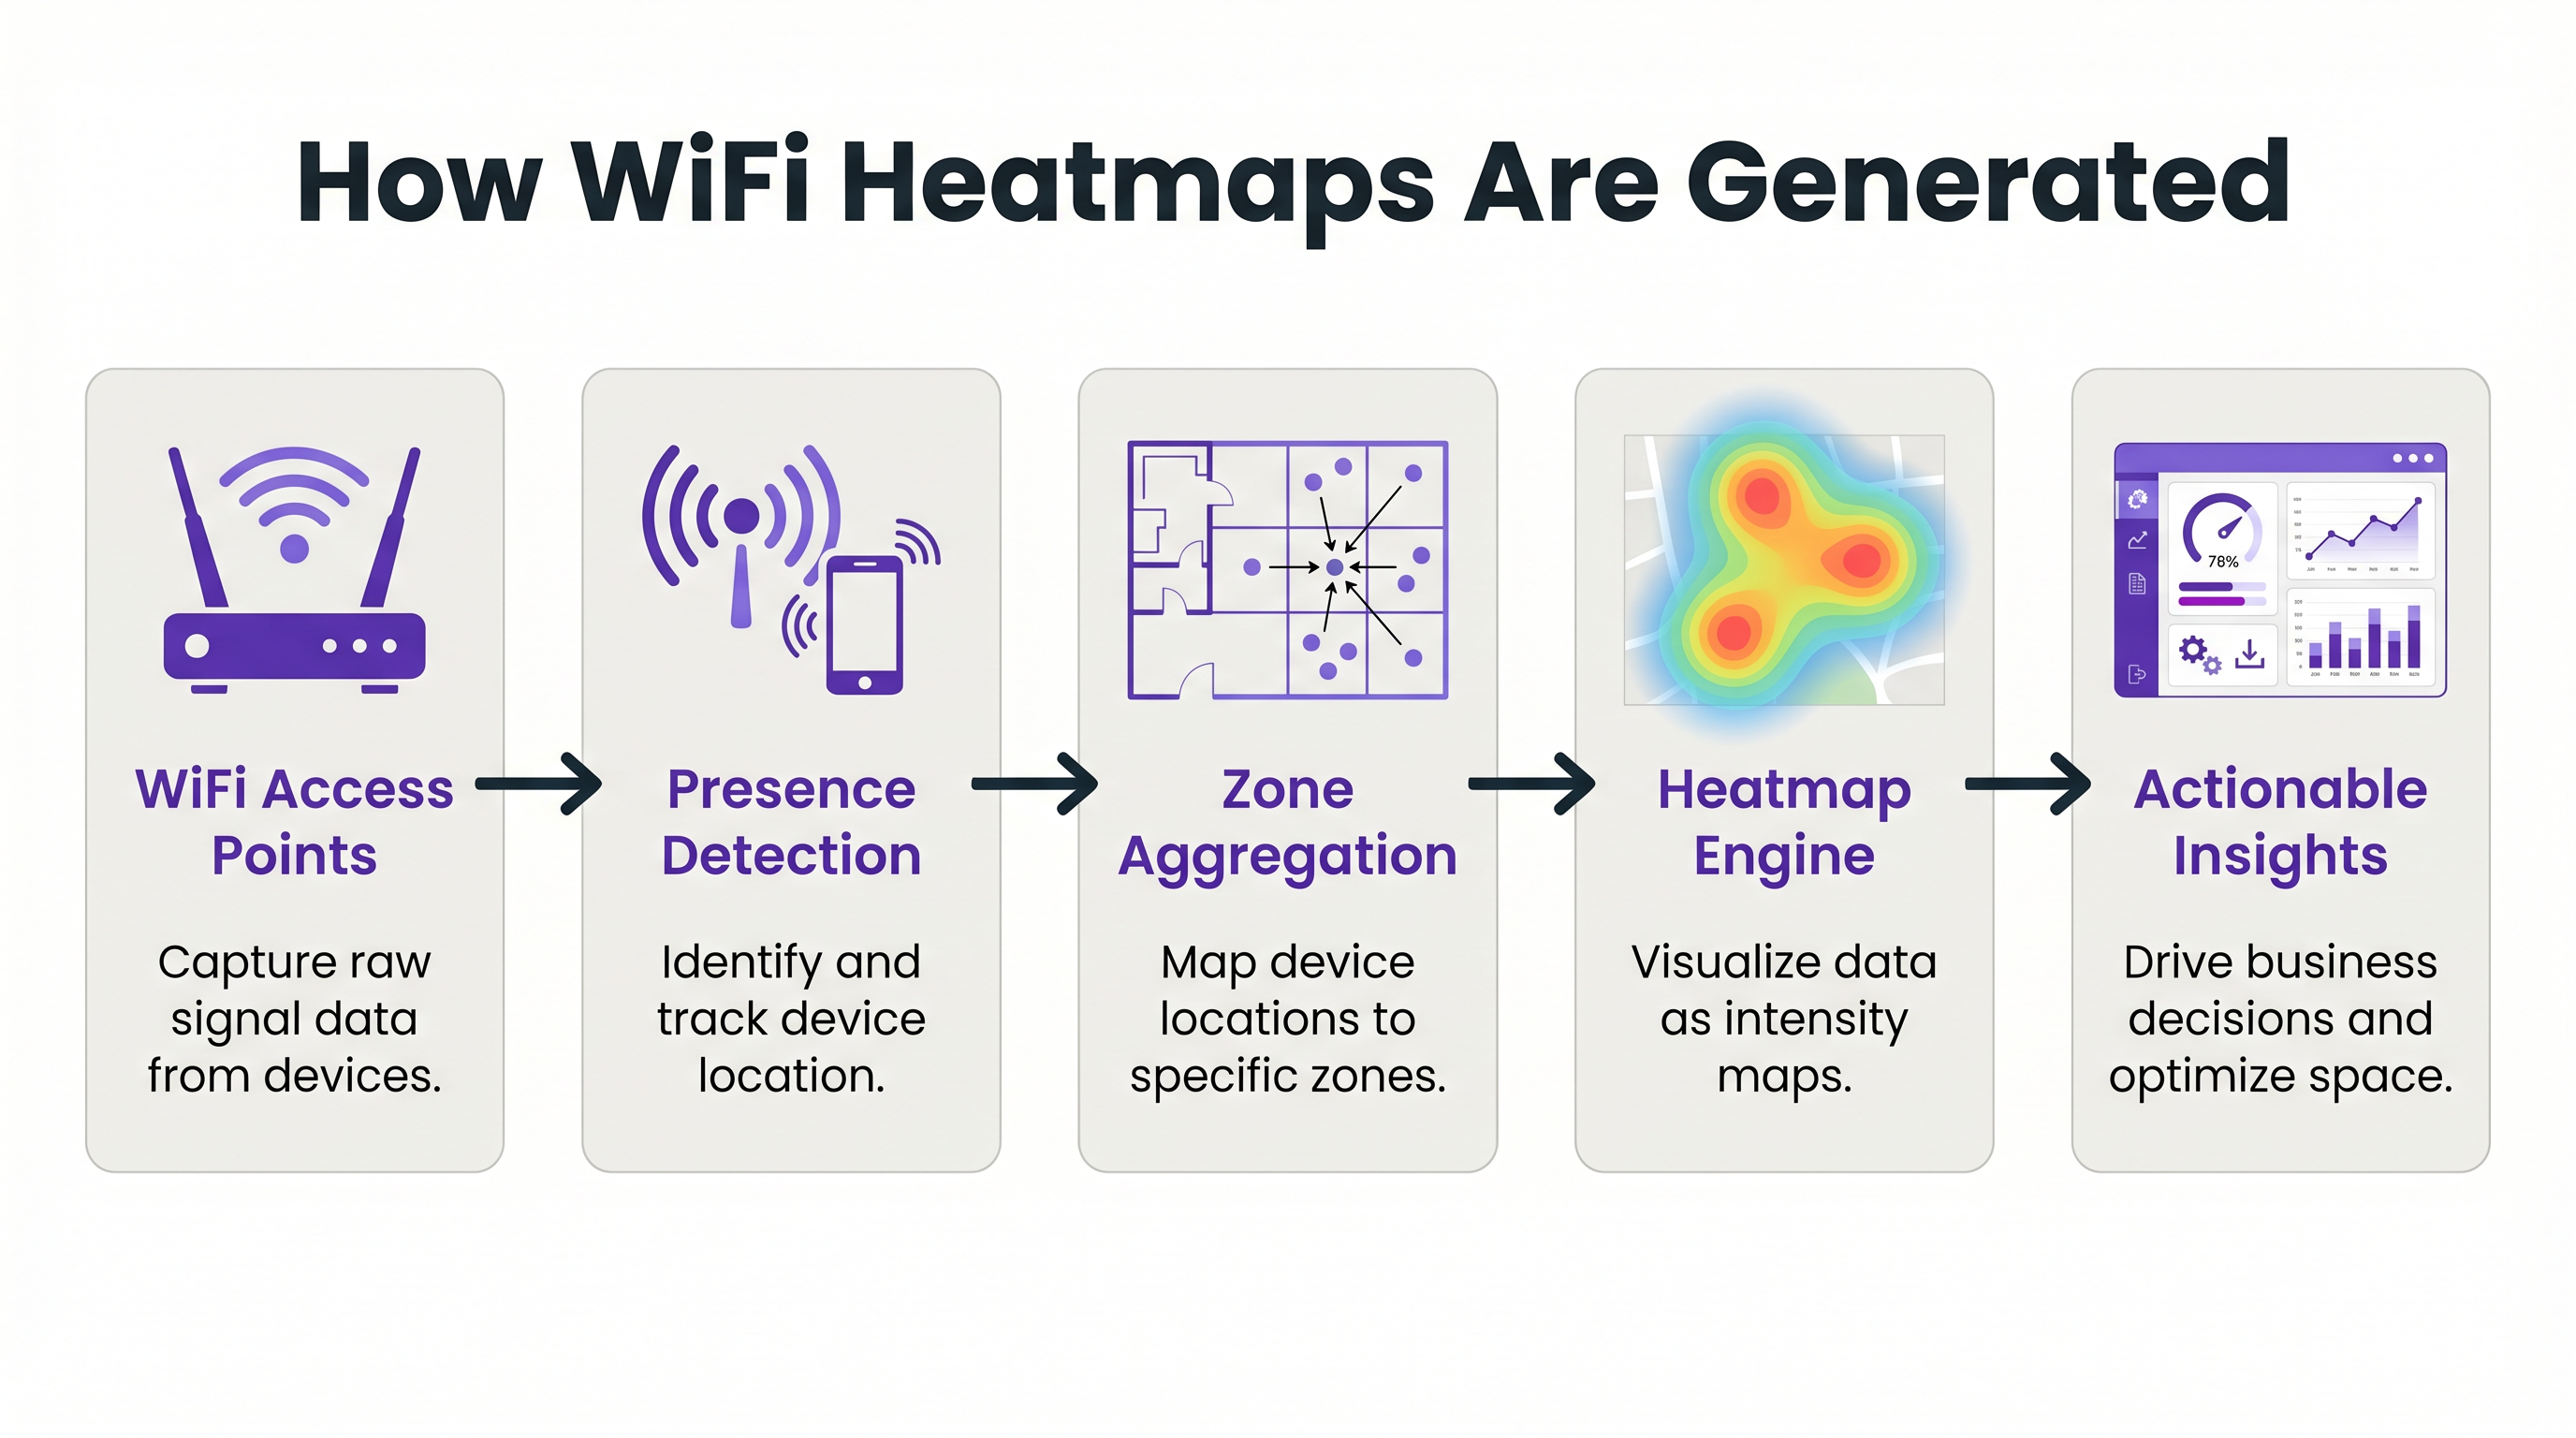
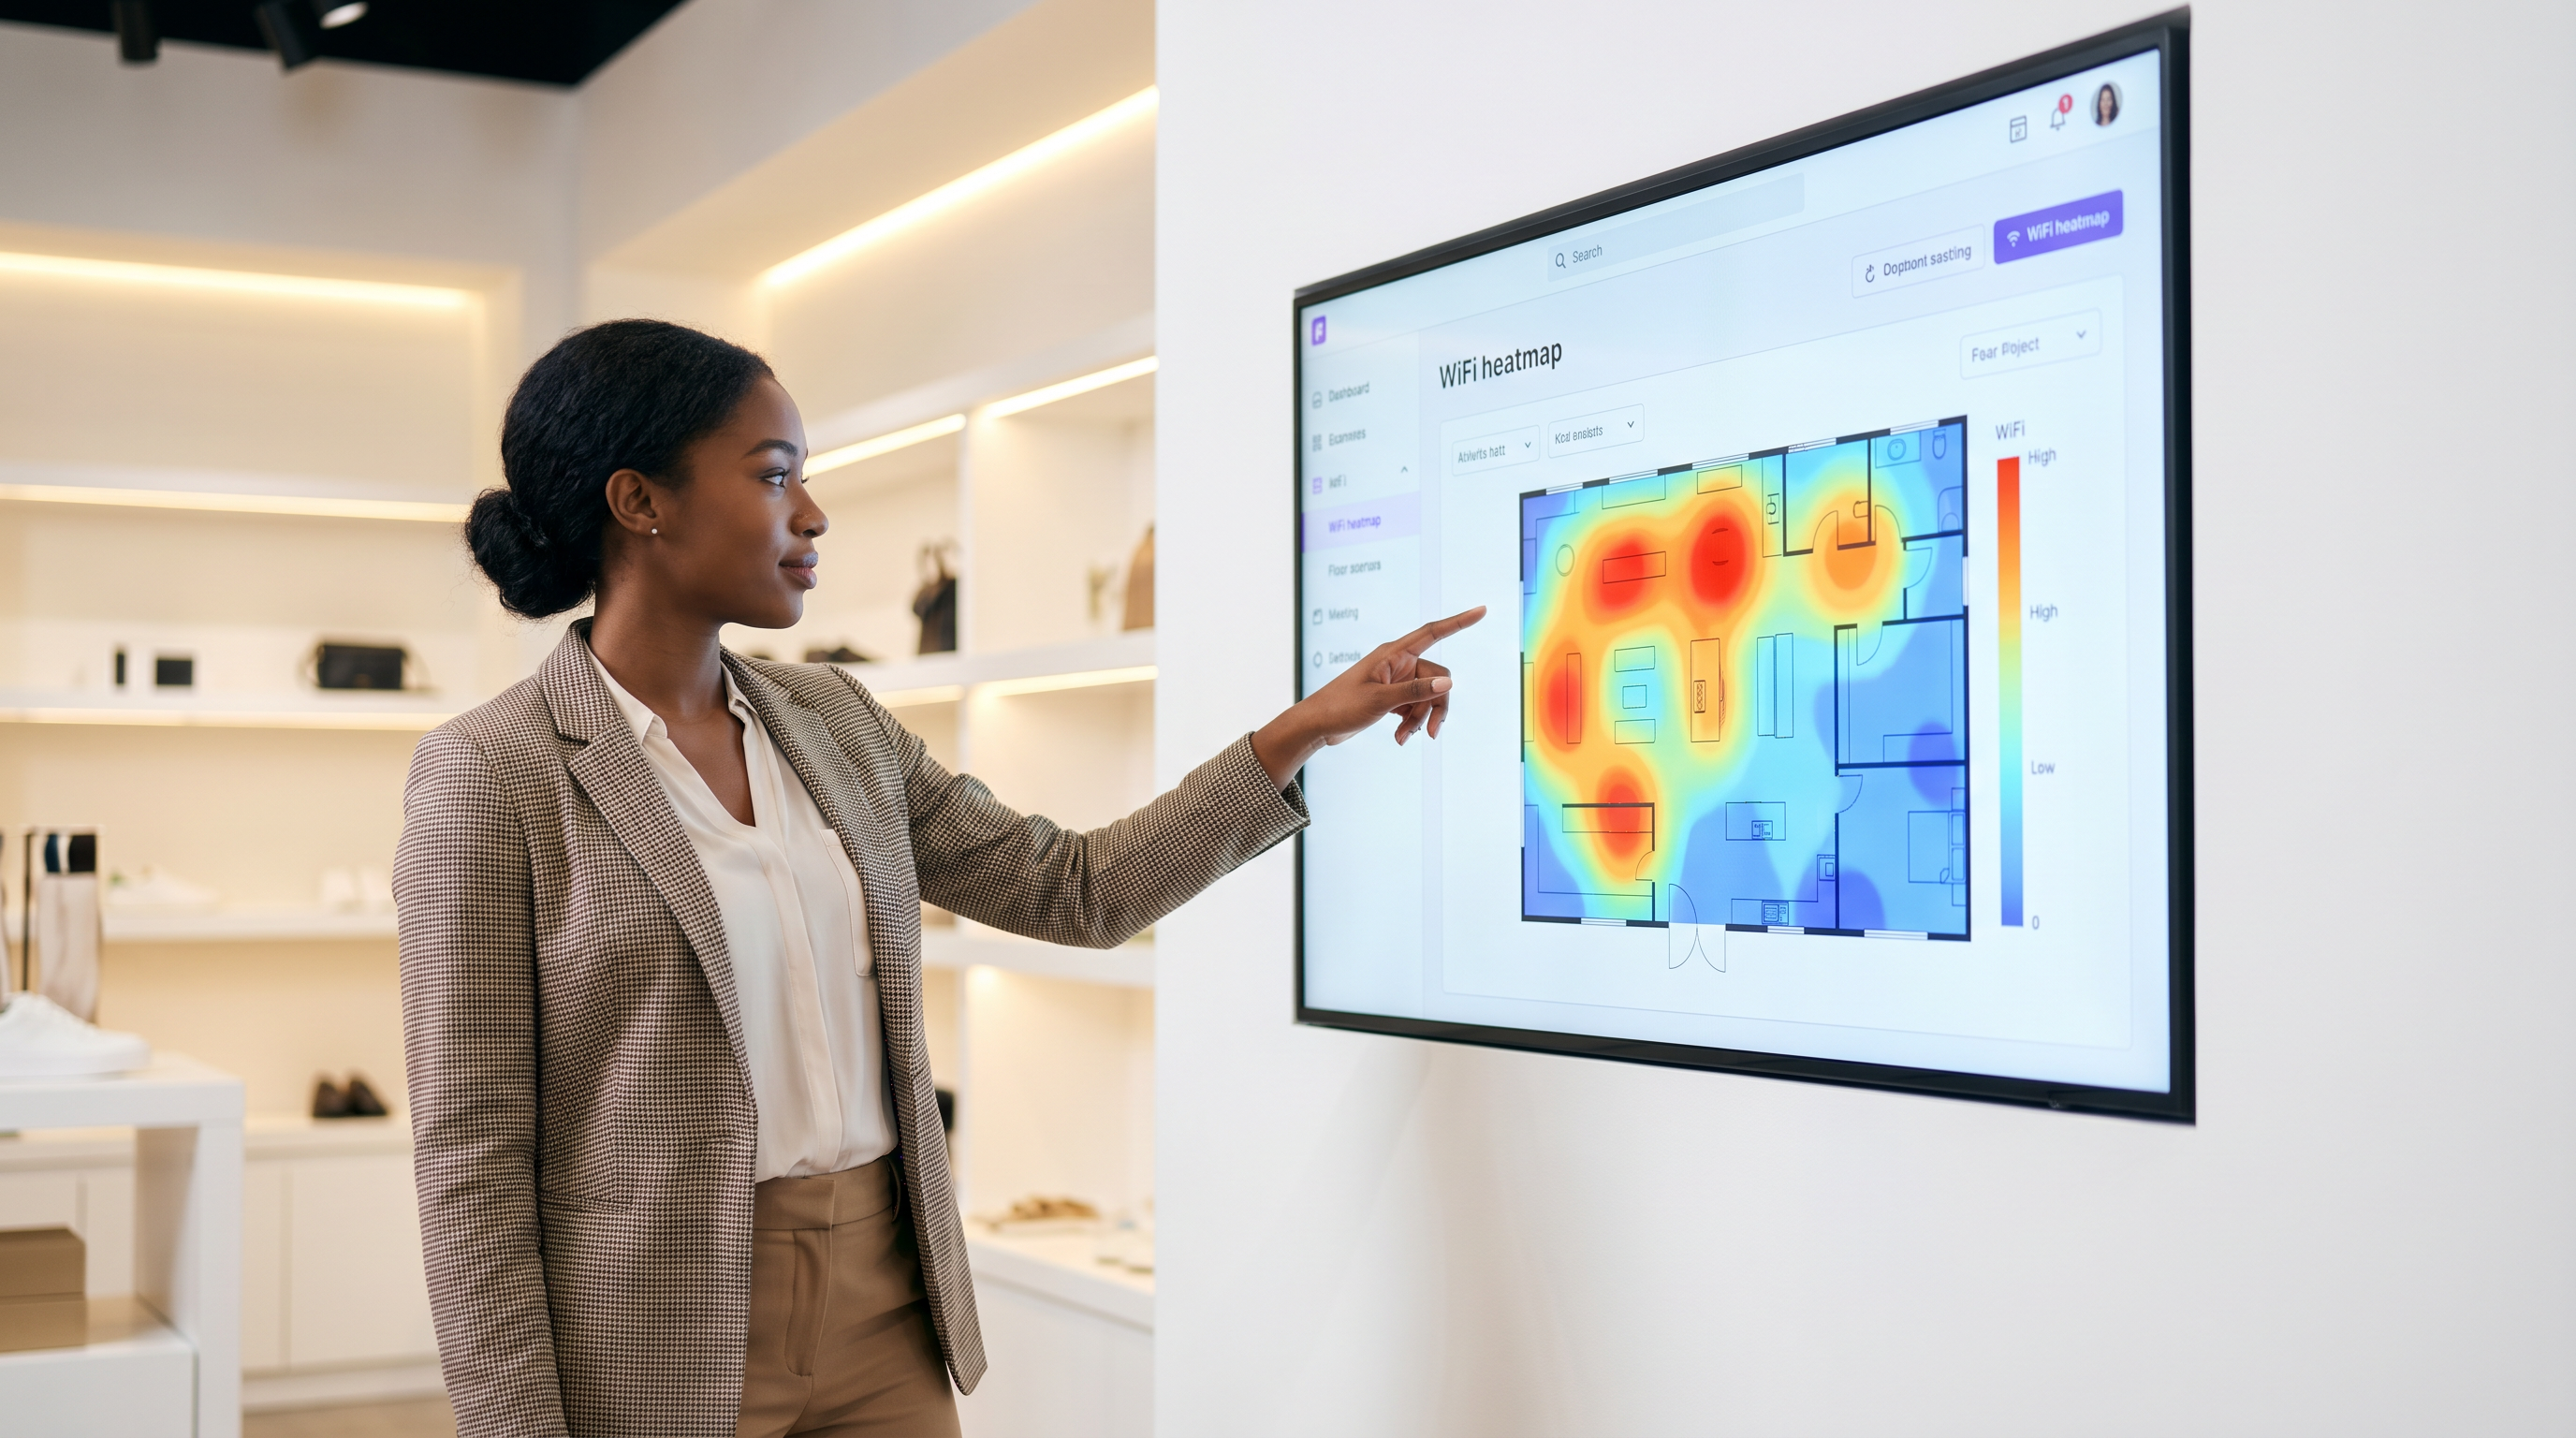
This raw location data is then processed by a central analytics engine, such as WiFi Analytics , which maps the coordinates to predefined spatial zones. The engine translates the aggregated data into visual intensity maps, commonly referred to as heatmaps. Areas with high device density or extended dwell times are rendered in 'hot' colours (reds and oranges), while areas with low traffic are rendered in 'cold' colours (blues and greens).
To achieve actionable accuracy, the network architecture must be designed for location services, not just standard coverage. The fundamental requirement is density and line-of-sight. A reliable rule of thumb is that any given point on the floor plan should be visible to at least three APs at a minimum signal strength of -65 dBm. In challenging RF environments, such as warehouses with metal shelving or hospitals with dense structural walls, standard AP deployments may be insufficient. In these scenarios, deploying dedicated Sensors that purely listen for probes without serving client traffic can significantly improve location accuracy and resolution.
Implementation Guide: Designing for Location Intelligence
Deploying a heatmap solution requires careful planning to ensure the data collected is both accurate and actionable. The implementation process can be broken down into three core phases: Network Readiness, Zone Mapping, and Data Calibration.
Phase 1: Network Readiness and AP Placement
The most common point of failure in location analytics is poor AP placement. If APs are deployed in a straight line down a corridor, the network cannot accurately triangulate a device's position, resulting in 'location jitter' where a device appears to bounce rapidly between adjacent zones. To mitigate this, APs must be staggered in a zig-zag or staggered grid pattern across the floor plan. This ensures that a device's signal is received from multiple angles, allowing the analytics engine to calculate a precise location fix.
Phase 2: Zone Mapping and Semantic Tagging
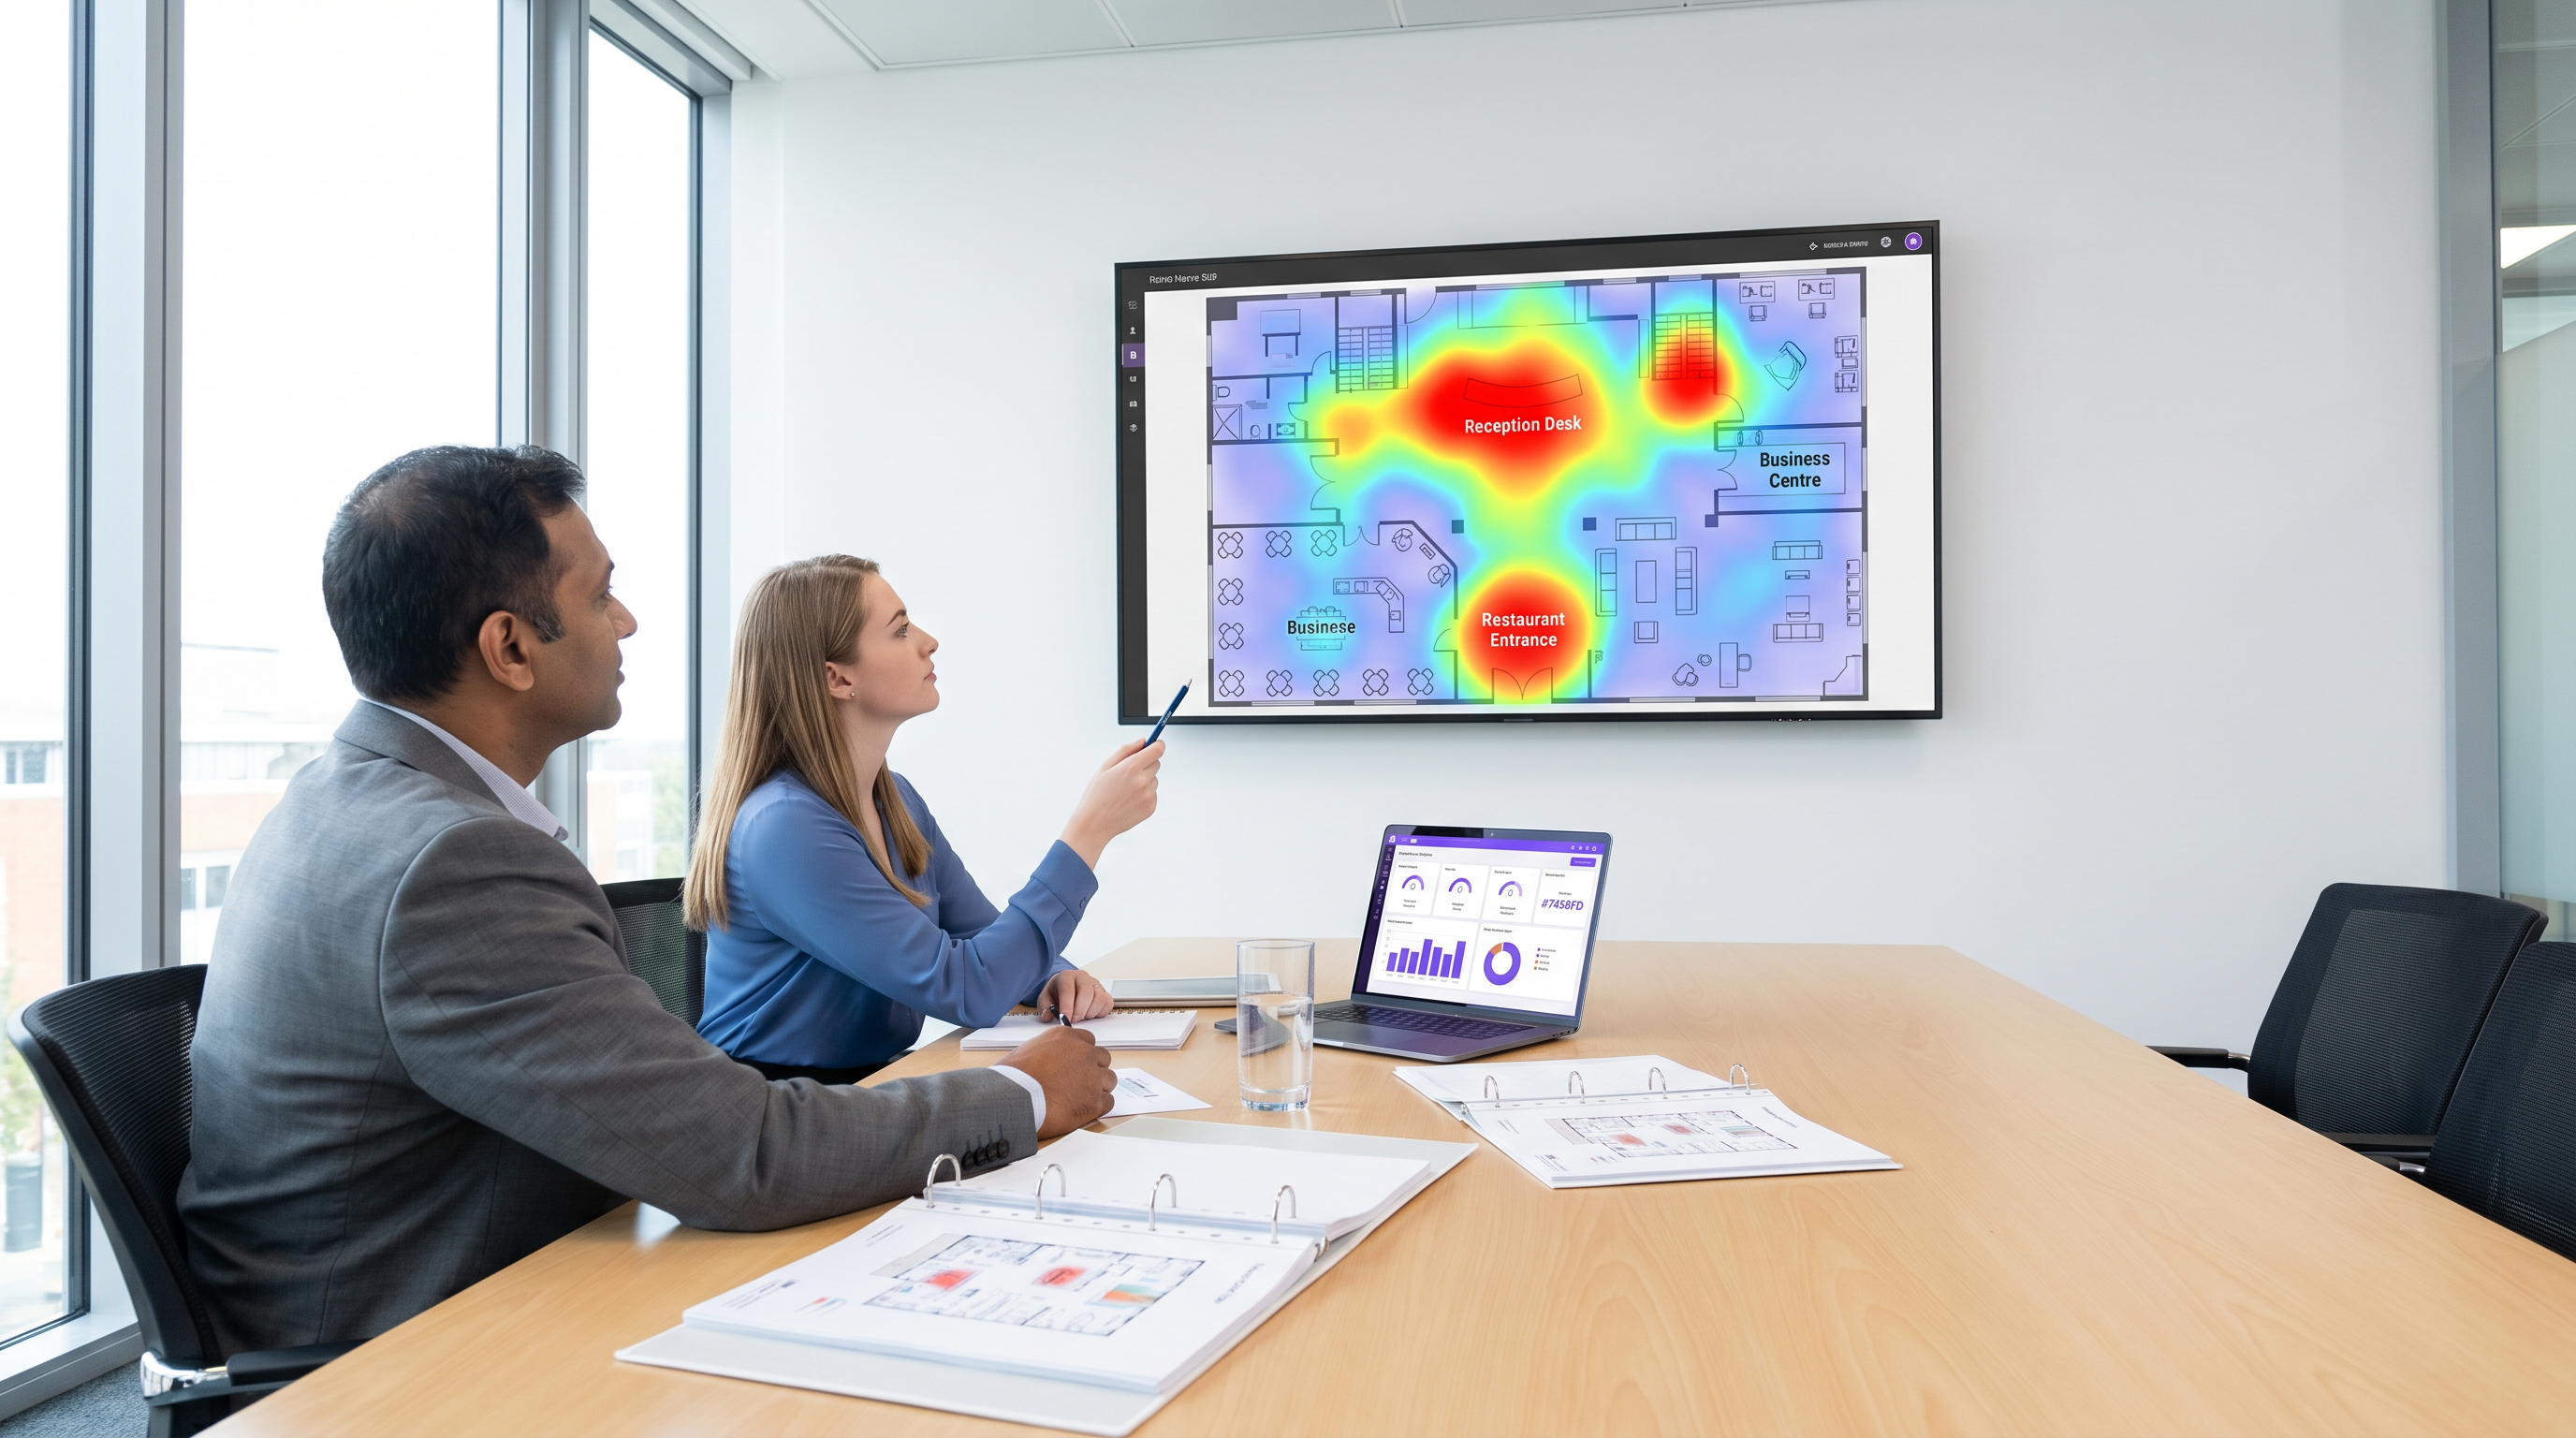
Once the network is capable of accurate triangulation, the physical floor plan must be digitised and mapped into logical zones. A zone should represent a distinct functional area, such as 'Reception Desk', 'Menswear Department', or 'Food Court'. When defining zones, it is critical to avoid creating areas that are too small for the network's resolution capabilities. If the network can only resolve location to within 5 metres, creating a 2-metre zone will result in noisy, unreliable data. Each zone should be semantically tagged to allow for aggregated reporting (e.g., comparing the performance of all 'Food & Beverage' zones across multiple venues).
Phase 3: Data Calibration and Boundary Filtering
The final phase is calibrating the analytics engine to filter out noise and irrelevant data. This includes configuring RSSI thresholds to ignore devices outside the venue's physical boundaries (e.g., pedestrians walking past on the street). It also involves setting dwell time parameters to differentiate between a customer who is actively browsing a display and an employee who is simply walking through the zone.
Best Practices for Actionable Insights
Generating a heatmap is only the first step; the true value lies in how the data is applied to operational challenges.
Retail Store Layout Optimisation: Retail merchandisers can use heatmaps to evaluate the performance of store layouts and product placements. If a heatmap reveals that a high-margin product display is located in a 'cold' zone, the display can be relocated to a high-traffic area to increase visibility and sales. Conversely, if a specific aisle consistently shows high dwell times but low conversion rates, it may indicate a bottleneck or confusing signage that needs to be addressed. For a deeper dive into retail applications, explore our Retail industry overview.
Hospitality F&B Placement: In the hospitality sector, operations directors can use heatmaps to identify underutilised spaces and deploy targeted services. For example, if a hotel lobby heatmap shows a massive spike in footfall between 8:00 AM and 10:00 AM, but the main restaurant is operating below capacity, deploying a pop-up coffee cart in the lobby can capture revenue that would otherwise be lost. Integrating this spatial data with Guest WiFi authentication provides a deeper understanding of guest behaviour and preferences. See our guide on University Campus WiFi: eduroam, Residence Halls, and BYOD at Scale for examples of managing high-density environments.
Wayfinding and Flow Management: In large venues like stadiums and conference centres, heatmaps can identify congestion points in real-time. If a heatmap shows a severe bottleneck at a specific entrance or concession stand, operations teams can dynamically deploy additional staff or update digital signage to redirect traffic to less congested areas. This capability can be further enhanced by integrating Wayfinding solutions to proactively guide visitors through the venue.
Troubleshooting & Risk Mitigation
When deploying heatmap analytics, IT teams must navigate several technical and compliance challenges.
MAC Address Randomisation
Modern mobile operating systems (iOS and Android) employ MAC address randomisation to protect user privacy. This feature periodically changes the device's MAC address when probing for networks, making it difficult to track a single device over time using passive probes alone. To mitigate this, venues must incentivise users to authenticate onto the network via a captive portal. Once authenticated, the device can be tied to a persistent user profile, providing reliable analytics data while maintaining compliance with privacy regulations. For strategies on improving authentication rates, review A/B Testing Captive Portal Designs for Higher Sign-Up Conversion .
Data Privacy and GDPR Compliance
Collecting location data carries significant privacy implications. Venues must ensure compliance with regulations such as GDPR and CCPA. Best practices include anonymising and aggregating data by default, clearly communicating data usage policies within the captive portal terms and conditions, and providing a straightforward opt-out mechanism for users. The focus should always be on understanding macro trends and flow patterns, not tracking individual users without explicit consent.
ROI & Business Impact
The ROI of a heatmap deployment is measured not by the maps themselves, but by the operational decisions they enable. By replacing anecdotal assumptions with empirical data, venues can achieve measurable improvements in space utilisation, staffing efficiency, and revenue generation.
In retail environments, success is often measured by increases in sales per square foot or improvements in conversion rates following a data-driven layout change. In hospitality and events, key metrics include reduced queue times, increased food and beverage capture rates, and improved guest satisfaction scores. Ultimately, heatmap analysis transforms the physical venue into a measurable, optimisable asset, providing the intelligence needed to drive continuous improvement and operational excellence. For a broader perspective on modern network benefits, read The Core SD WAN Benefits for Modern Businesses .
Key Terms & Definitions
Received Signal Strength Indicator (RSSI)
A measurement of the power present in a received radio signal. In heatmap analytics, RSSI is used to estimate the distance between a device and an access point.
IT teams use RSSI thresholds to define zone boundaries and filter out devices that are outside the venue.
MAC Address Randomisation
A privacy feature in modern operating systems that periodically changes a device's MAC address when probing for networks, preventing long-term passive tracking.
This feature requires venues to encourage active network authentication (via captive portals) to maintain accurate, persistent analytics data.
Location Jitter
An anomaly where a device appears to bounce rapidly between adjacent zones on a heatmap, usually caused by poor AP placement or insufficient signal density.
Network architects must design staggered AP layouts to prevent jitter and ensure actionable data.
Probe Request
A frame sent by a client device (e.g., a smartphone) to discover available WiFi networks in its vicinity.
Analytics engines listen for these probes to detect device presence, even if the device does not connect to the network.
Triangulation
The process of determining a device's location by measuring the RSSI from at least three different access points simultaneously.
This is the fundamental mechanism that allows raw WiFi signal data to be translated into a visual heatmap.
Dwell Time
The amount of time a device remains continuously within a specific defined zone.
Operations teams use dwell time to differentiate between transient traffic (walking past) and engaged traffic (browsing a display or waiting in line).
Semantic Tagging
The practice of assigning logical, business-relevant labels (e.g., 'Menswear', 'Food Court') to physical zones on a digital floor plan.
This allows analytics platforms to aggregate data across multiple venues and generate reports that make sense to business stakeholders.
Edge Bleeding
When devices located outside the physical venue (e.g., on the street) are erroneously captured and mapped within the venue's analytics data.
IT teams must carefully calibrate RSSI boundaries to filter out this noise and ensure the heatmap only reflects true venue traffic.
Case Studies
A 200-room business hotel is experiencing congestion in the main lobby during morning checkout (8:00 AM - 10:00 AM). The operations director wants to use WiFi analytics to understand the flow and deploy a mobile coffee cart to capture lost F&B revenue. How should the IT team configure the heatmap zones and analytics to support this?
- Zone Definition: The IT team must define granular zones within the lobby area, separating the 'Reception Desk', 'Main Entrance', 'Lounge Seating', and 'Elevator Bank'.
- Dwell Time Calibration: Configure the analytics engine to filter out transient traffic (dwell time < 2 minutes) to isolate guests who are actually waiting in the lobby versus those simply walking through.
- Heatmap Generation: Generate a time-lapsed heatmap specifically for the 8:00 AM - 10:00 AM window over a two-week period to identify the consistent 'hot zones' where guests congregate while waiting.
- Deployment: Based on the data, position the mobile coffee cart adjacent to the hottest zone (e.g., near the lounge seating) but outside the direct flow path to the main entrance to avoid exacerbating the bottleneck.
A large retail chain is redesigning its flagship store layout. The visual merchandising team wants to identify 'dead zones' where high-margin products are currently placed but receiving little footfall. How should the network architect ensure the WiFi infrastructure can provide accurate data for this analysis?
- AP Placement Audit: The architect must review the existing AP deployment. If APs are deployed in straight lines down the main aisles, they must be repositioned into a staggered grid pattern to enable accurate triangulation.
- Density Check: Ensure that every point on the retail floor is visible to at least three APs at -65 dBm or better.
- Boundary Filtering: Configure RSSI thresholds to filter out devices probing from the street or adjacent stores to ensure the heatmap only reflects actual in-store traffic.
- Integration: Export the heatmap data via API to overlay it onto the store's planogram software, allowing merchandisers to correlate footfall with specific product displays.
Scenario Analysis
Q1. You are deploying a heatmap solution in a long, narrow retail corridor. The initial design places three Access Points in a straight line down the centre of the ceiling. What is the primary risk of this design, and how should it be corrected?
💡 Hint:Consider how the analytics engine calculates the position of a device based on signal strength from multiple angles.
Show Recommended Approach
The primary risk is 'location jitter' or a complete inability to accurately triangulate the device's position on the Y-axis (width of the corridor). Because the APs are in a straight line, the analytics engine cannot determine if a device is on the left side or the right side of the corridor, only its position along the length. To correct this, the APs must be staggered in a zig-zag pattern (e.g., one on the left wall, the next on the right wall, the next on the left) to provide the necessary angles for accurate triangulation.
Q2. A stadium operations director reports that the heatmap for the main concourse is showing significant traffic in the 'Food Court' zone at 3:00 AM, when the venue is closed. What is the most likely cause of this anomaly, and what configuration change is required?
💡 Hint:Think about what is physically located outside the stadium walls and how RF signals travel.
Show Recommended Approach
The most likely cause is 'edge bleeding'—the APs inside the stadium are detecting probe requests from devices outside the venue, such as passing cars or pedestrians on an adjacent street. To resolve this, the IT team needs to calibrate the boundary filtering. This involves adjusting the RSSI thresholds for the APs near the exterior walls so they ignore signals weaker than a specific level (e.g., ignoring signals weaker than -75 dBm), effectively trimming the coverage area to the physical boundaries of the concourse.
Q3. A retail client wants to track the exact path of individual, returning customers across multiple store visits over a six-month period using only passive WiFi heatmaps (no captive portal authentication). Why is this technically unfeasible, and what alternative approach should you recommend?
💡 Hint:Consider the privacy features implemented by modern mobile operating systems.
Show Recommended Approach
This is unfeasible due to MAC Address Randomisation. Modern iOS and Android devices periodically change their MAC addresses when sending passive probe requests to prevent long-term tracking. Therefore, the analytics engine will see the same returning customer as a new, unique device on subsequent visits. The recommended alternative is to deploy a Guest WiFi captive portal that offers a value exchange (e.g., free WiFi, a discount code). Once the user authenticates, their device can be tied to a persistent profile, allowing for accurate long-term tracking while ensuring explicit user consent and GDPR compliance.
Key Takeaways
- ✓WiFi heatmaps transform existing network infrastructure into a location intelligence platform, revealing how people move through physical spaces.
- ✓Accurate location tracking requires a network designed for density and line-of-sight, with any point visible to at least three APs at -65 dBm.
- ✓APs must be deployed in a staggered or zig-zag pattern to enable accurate triangulation and prevent location jitter.
- ✓Heatmaps allow retail merchandisers to optimise store layouts by identifying dead zones and repositioning high-margin displays to high-traffic areas.
- ✓Hospitality operators use spatial data to deploy targeted services, such as pop-up F&B carts in congested areas, capturing lost revenue.
- ✓MAC address randomisation limits passive tracking; venues must encourage captive portal authentication to maintain persistent, compliant analytics data.
- ✓The true ROI of a heatmap deployment is measured by the operational improvements and revenue increases driven by data-backed layout decisions.
