स्थल पर आवाजाही के लिए हीटमैप विश्लेषण: एक व्यावहारिक मार्गदर्शिका
यह तकनीकी संदर्भ मार्गदर्शिका भौतिक स्थलों में WiFi-आधारित हीटमैप्स को तैनात करने और उनका विश्लेषण करने के लिए कार्रवाई योग्य रणनीतियाँ प्रदान करती है। यह बताती है कि आईटी और संचालन प्रमुख ग्राहक प्रवाह पैटर्न का पता लगाने, बाधाओं को दूर करने और स्थानिक ROI को अनुकूलित करने के लिए मौजूदा नेटवर्क इन्फ्रास्ट्रक्चर का लाभ कैसे उठा सकते हैं।
🎧 Listen to this Guide
View Transcript
कार्यकारी सारांश
स्थल संचालकों, खुदरा व्यापारियों और संपत्ति मालिकों के लिए, भौतिक स्थान बैलेंस शीट पर सबसे महंगी संपत्ति है। प्रवेश द्वारों पर पारंपरिक फुटफॉल गणना केवल अधिभोग की एक प्रारंभिक समझ प्रदान करती है, जो ग्राहक व्यवहार, ठहरने के समय और स्थानिक उपयोगिता के बारे में महत्वपूर्ण सवालों का जवाब देने में विफल रहती है। WiFi हीटमैप विश्लेषण मौजूदा वायरलेस इन्फ्रास्ट्रक्चर को एक शक्तिशाली स्थान खुफिया प्लेटफॉर्म में बदलकर इस अंतर को पाटता है। डिवाइस उपस्थिति डेटा को कैप्चर और विश्लेषण करके, संगठन ग्राहक प्रवाह पैटर्न की कल्पना कर सकते हैं, परिचालन बाधाओं की पहचान कर सकते हैं और अपनी फ्लोर योजनाओं में उच्च-मूल्य वाले क्षेत्रों को इंगित कर सकते हैं। यह मार्गदर्शिका हीटमैप एनालिटिक्स को तैनात करने, सटीक डेटा संग्रह सुनिश्चित करने और स्थानिक बुद्धिमत्ता को मापने योग्य व्यावसायिक परिणामों में बदलने के लिए एक व्यावहारिक, विक्रेता-तटस्थ ढांचा प्रदान करती है। चाहे आप एक स्टेडियम के गलियारे, एक खुदरा फ्लैगशिप, या एक होटल की लॉबी का प्रबंधन कर रहे हों, यह संदर्भ आपको डेटा-संचालित निर्णय लेने के लिए सुसज्जित करेगा जो लेआउट को अनुकूलित करते हैं, अतिथि अनुभव में सुधार करते हैं और ROI को अधिकतम करते हैं।
तकनीकी गहन-विश्लेषण: WiFi हीटमैप्स कैसे उत्पन्न होते हैं
WiFi हीटमैप विश्लेषण का आधार उपस्थिति का पता लगाना है। जब किसी आगंतुक के स्मार्टफोन या पहनने योग्य डिवाइस में उसका WiFi इंटरफ़ेस सक्षम होता है, तो वह ज्ञात नेटवर्क का पता लगाने के लिए समय-समय पर जांच अनुरोध प्रसारित करता है। रेंज के भीतर एक्सेस पॉइंट (APs) इन जांचों को सुनते हैं और प्राप्त सिग्नल शक्ति संकेतक (RSSI) को मापते हैं। एक साथ कई APs से RSSI डेटा को एकत्रित करके, नेटवर्क एक डिजिटल फ्लोर प्लान पर डिवाइस की स्थिति को त्रिकोणीय कर सकता है।
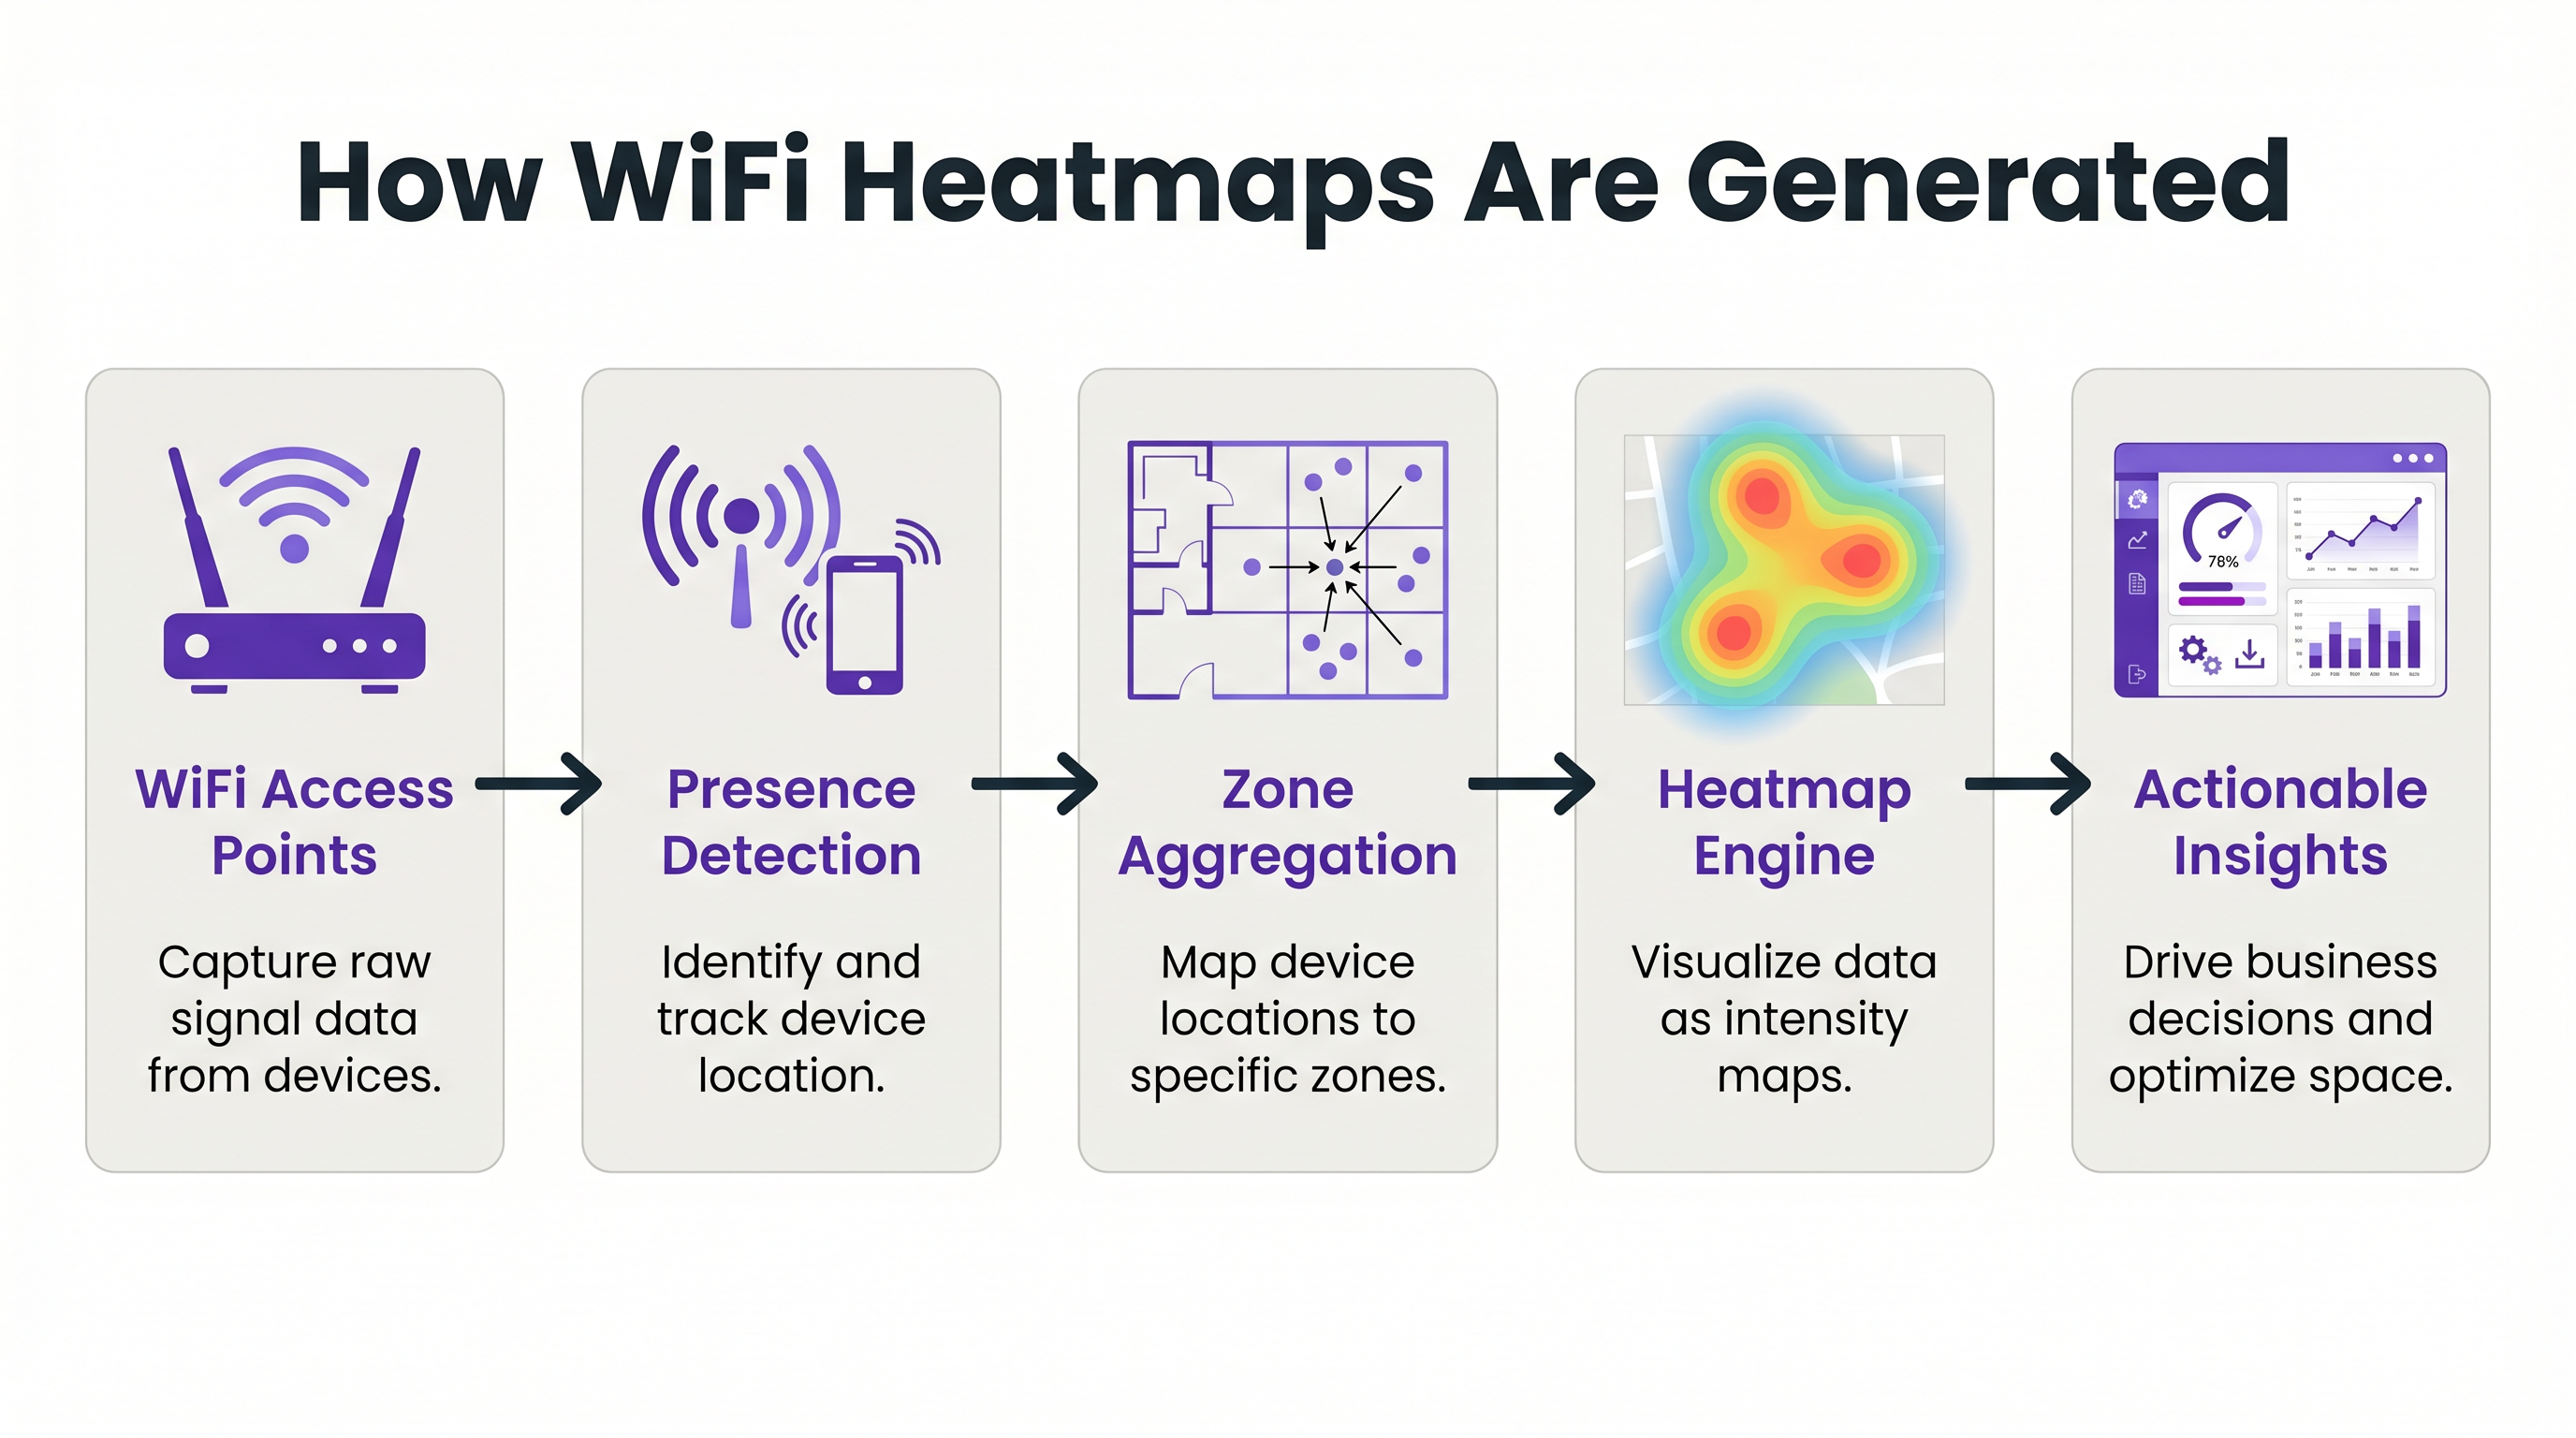
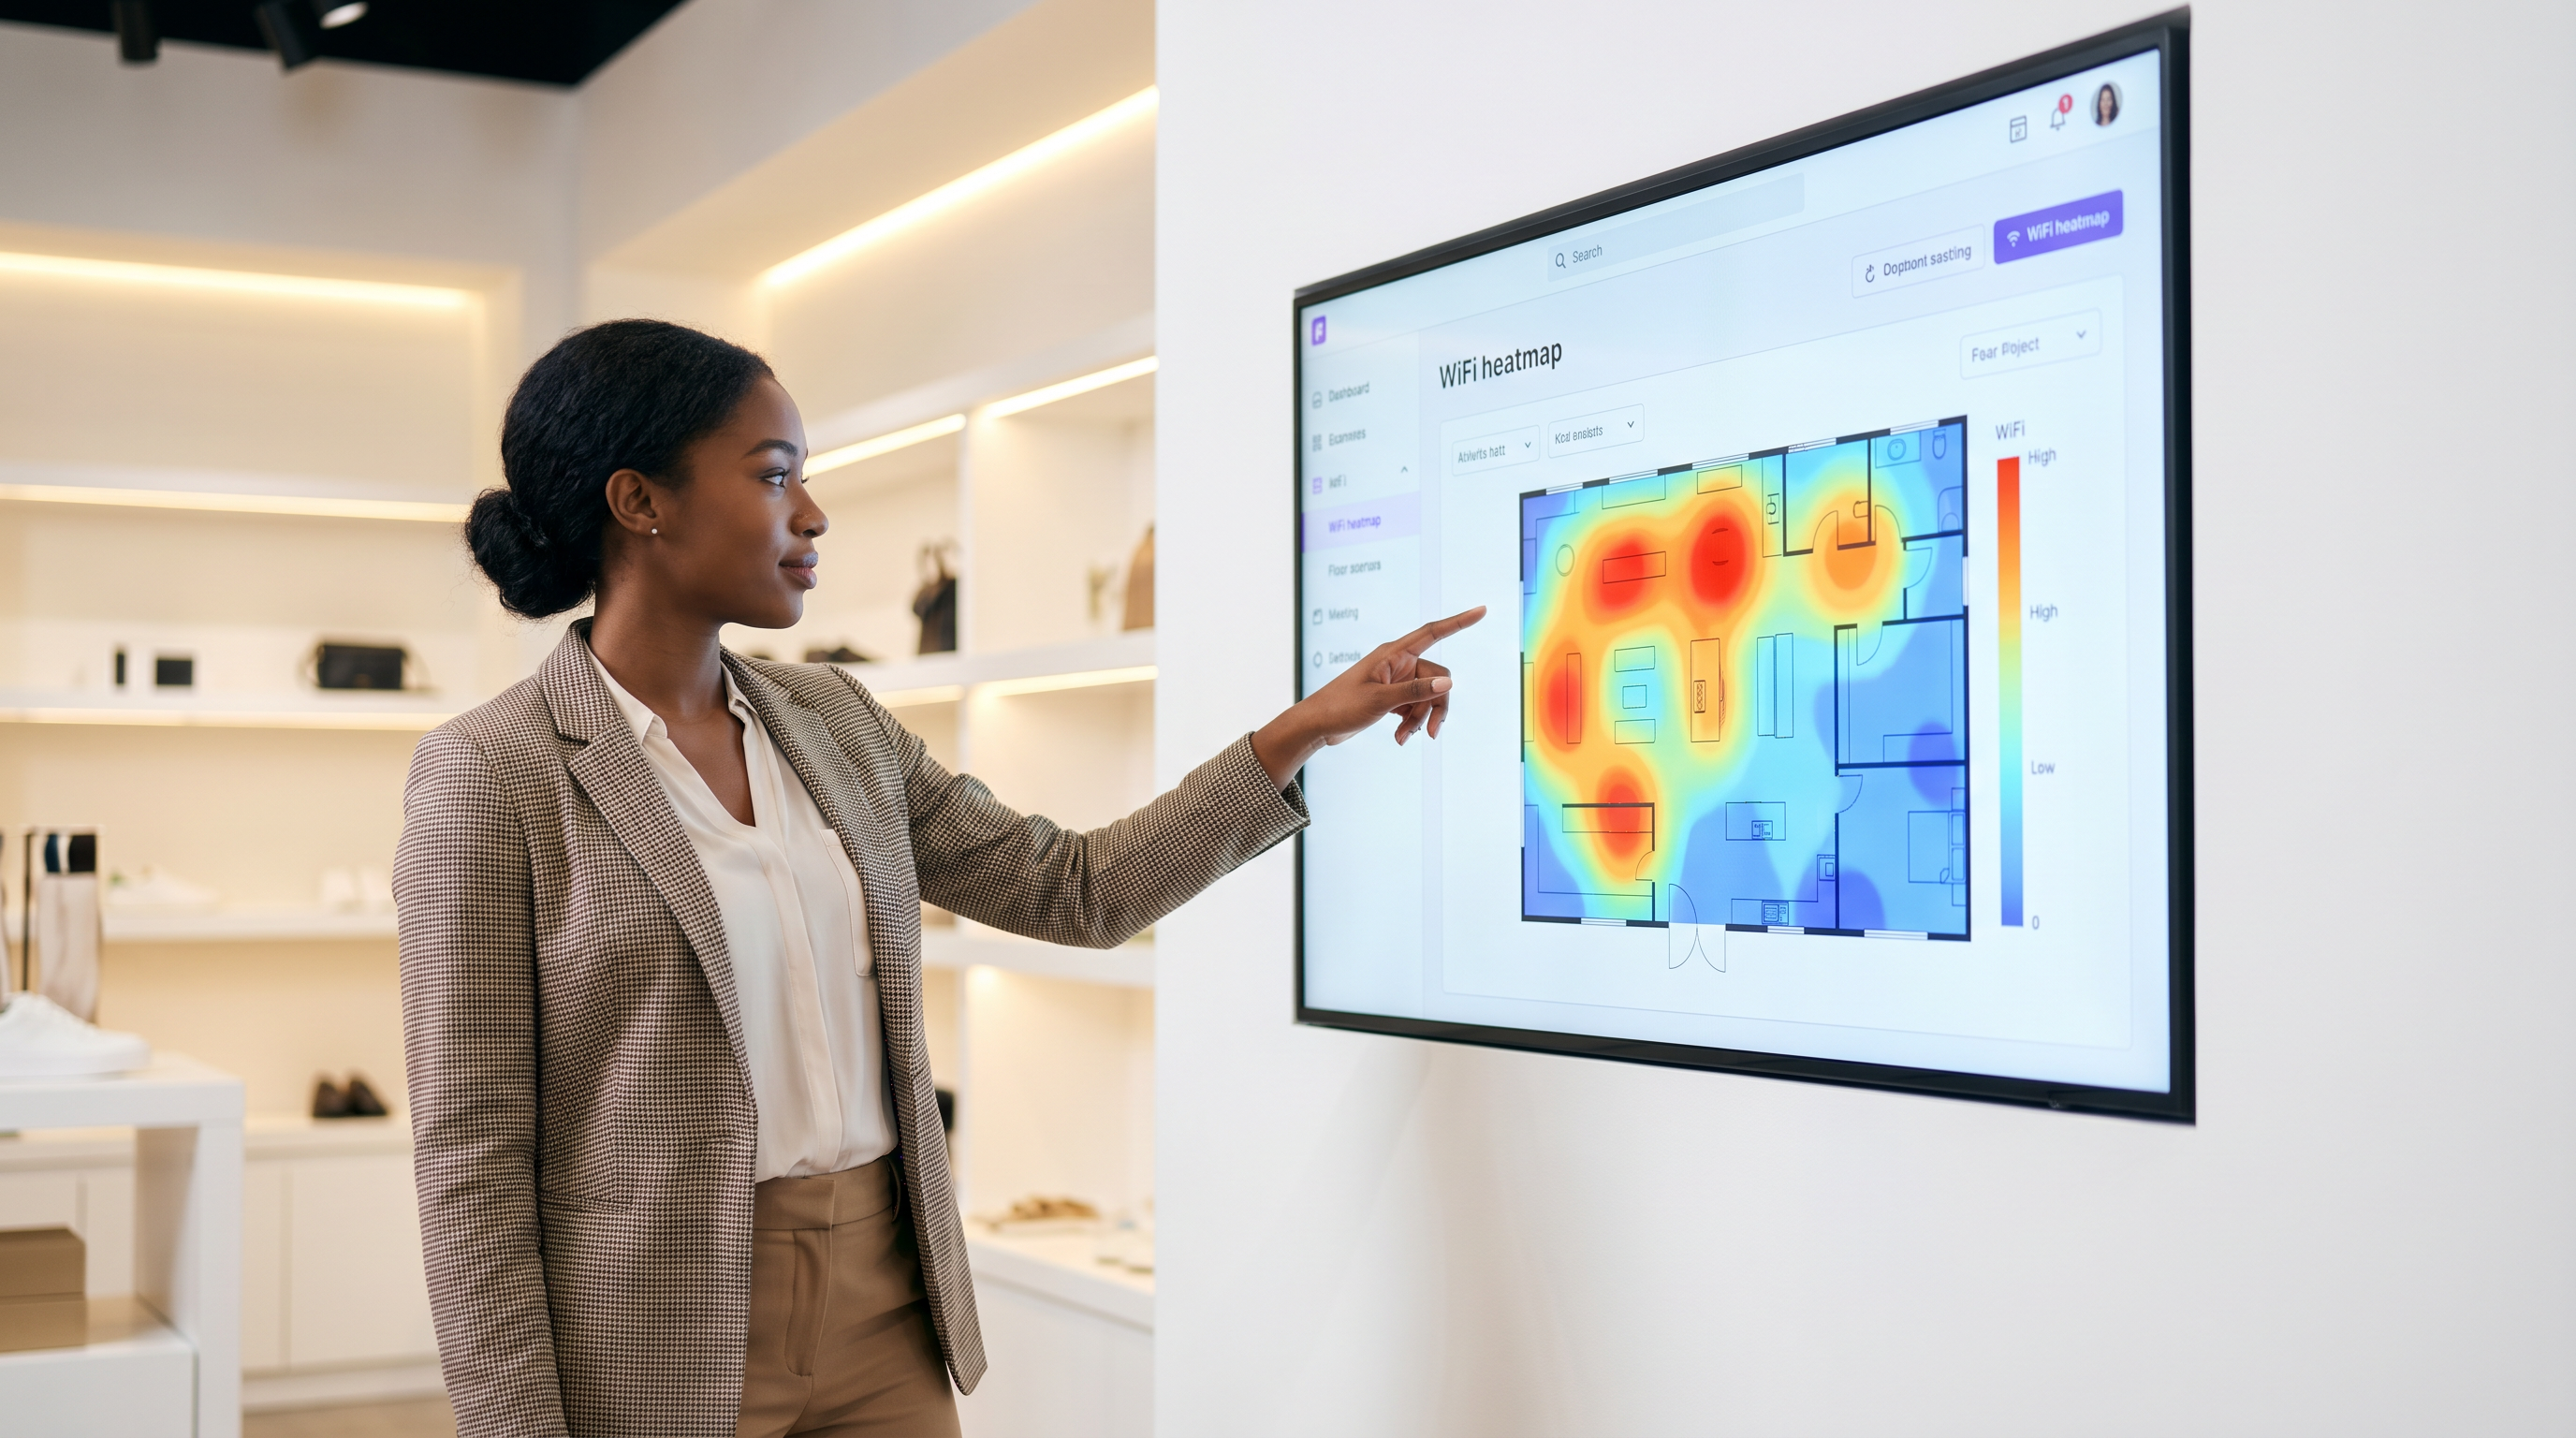
यह कच्चा स्थान डेटा तब एक केंद्रीय एनालिटिक्स इंजन द्वारा संसाधित किया जाता है, जैसे WiFi Analytics , जो निर्देशांकों को पूर्वनिर्धारित स्थानिक क्षेत्रों में मैप करता है। इंजन एकत्रित डेटा को दृश्य तीव्रता मानचित्रों में अनुवादित करता है, जिन्हें आमतौर पर हीटमैप्स के रूप में जाना जाता है। उच्च डिवाइस घनत्व या विस्तारित ठहरने के समय वाले क्षेत्रों को 'गर्म' रंगों (लाल और नारंगी) में प्रस्तुत किया जाता है, जबकि कम आवाजाही वाले क्षेत्रों को 'ठंडे' रंगों (नीले और हरे) में प्रस्तुत किया जाता है।
कार्रवाई योग्य सटीकता प्राप्त करने के लिए, नेटवर्क आर्किटेक्चर को केवल मानक कवरेज के लिए नहीं, बल्कि स्थान सेवाओं के लिए डिज़ाइन किया जाना चाहिए। मौलिक आवश्यकता घनत्व और दृष्टि-रेखा है। एक विश्वसनीय नियम यह है कि फ्लोर प्लान पर कोई भी दिया गया बिंदु कम से कम -65 dBm की न्यूनतम सिग्नल शक्ति पर कम से कम तीन APs के लिए दृश्यमान होना चाहिए। चुनौतीपूर्ण RF वातावरण में, जैसे धातु की अलमारियों वाले गोदामों या घनी संरचनात्मक दीवारों वाले अस्पतालों में, मानक AP परिनियोजन अपर्याप्त हो सकते हैं। इन परिदृश्यों में, समर्पित Sensors को तैनात करना जो क्लाइंट ट्रैफ़िक की सेवा किए बिना केवल जांचों को सुनते हैं, स्थान सटीकता और रिज़ॉल्यूशन में काफी सुधार कर सकते हैं।
कार्यान्वयन मार्गदर्शिका: स्थान बुद्धिमत्ता के लिए डिज़ाइन करना
एक हीटमैप समाधान को तैनात करने के लिए सावधानीपूर्वक योजना की आवश्यकता होती है ताकि यह सुनिश्चित किया जा सके कि एकत्र किया गया डेटा सटीक और कार्रवाई योग्य दोनों है। कार्यान्वयन प्रक्रिया को तीन मुख्य चरणों में विभाजित किया जा सकता है: नेटवर्क तत्परता, ज़ोन मैपिंग और डेटा कैलिब्रेशन।
चरण 1: नेटवर्क तत्परता और AP प्लेसमेंट
स्थान एनालिटिक्स में विफलता का सबसे आम बिंदु खराब AP प्लेसमेंट है। यदि APs को एक गलियारे में सीधी रेखा में तैनात किया जाता है, तो नेटवर्क डिवाइस की स्थिति को सटीक रूप से त्रिकोणीय नहीं कर सकता है, जिसके परिणामस्वरूप 'स्थानिक अस्थिरता' होती है जहां एक डिवाइस आसन्न क्षेत्रों के बीच तेजी से उछलता हुआ प्रतीत होता है। इसे कम करने के लिए, APs को फ्लोर प्लान पर एक ज़िग-ज़ैग या कंपित ग्रिड पैटर्न में व्यवस्थित किया जाना चाहिए। यह सुनिश्चित करता है कि एक डिवाइस का सिग्नल कई कोणों से प्राप्त होता है, जिससे एनालिटिक्स इंजन को एक सटीक स्थान निर्धारण की गणना करने की अनुमति मिलती है।
चरण 2: ज़ोन मैपिंग और सिमेंटिक टैगिंग
एक बार जब नेटवर्क सटीक त्रिकोणीयकरण में सक्षम हो जाता है, तो भौतिक फ्लोर प्लान को डिजिटाइज़ किया जाना चाहिए और तार्किक क्षेत्रों में मैप किया जाना चाहिए। एक ज़ोन को एक विशिष्ट कार्यात्मक क्षेत्र का प्रतिनिधित्व करना चाहिए, जैसे 'रिसेप्शन डेस्क', 'पुरुषों का परिधान विभाग', या 'फूड कोर्ट'। ज़ोन को परिभाषित करते समय, ऐसे क्षेत्र बनाने से बचना महत्वपूर्ण है जो नेटवर्क की रिज़ॉल्यूशन क्षमताओं के लिए बहुत छोटे हों। यदि नेटवर्क केवल 5 मीटर के भीतर स्थान को हल कर सकता है, तो 2-मीटर ज़ोन बनाने से शोरगुल वाला, अविश्वसनीय डेटा प्राप्त होगा। प्रत्येक ज़ोन को सिमेंटिक रूप से टैग किया जाना चाहिए ताकि एकत्रित रिपोर्टिंग की अनुमति मिल सके (उदाहरण के लिए, कई स्थलों पर सभी 'खाद्य और पेय' क्षेत्रों के प्रदर्शन की तुलना करना)।
चरण 3: डेटा कैलिब्रेशन और बाउंड्री फ़िल्टरिंग
अंतिम चरण एनालिटिक्स इंजन को शोर और अप्रासंगिक डेटा को फ़िल्टर करने के लिए कैलिब्रेट करना है। इसमें स्थल की भौतिक सीमाओं के बाहर के उपकरणों (उदाहरण के लिए, सड़क पर चलने वाले पैदल यात्री) को अनदेखा करने के लिए RSSI थ्रेशोल्ड को कॉन्फ़िगर करना शामिल है। इसमें एक ग्राहक जो सक्रिय रूप से एक डिस्प्ले ब्राउज़ कर रहा है और एक कर्मचारी जो केवल ज़ोन से गुजर रहा है, के बीच अंतर करने के लिए ठहरने के समय के मापदंडों को सेट करना भी शामिल है।
कार्रवाई योग्य अंतर्दृष्टि के लिए सर्वोत्तम अभ्यास
एक हीटमैप उत्पन्न करना केवल पहला कदम है; वास्तविक मूल्य इस बात में निहित है कि डेटा को परिचालन चुनौतियों पर कैसे लागू किया जाता है।
खुदरा स्टोर लेआउट अनुकूलन: खुदरा व्यापारी स्टोर लेआउट और उत्पाद प्लेसमेंट के प्रदर्शन का मूल्यांकन करने के लिए हीटमैप्स का उपयोग कर सकते हैं। यदि एक हीटमैप से पता चलता है कि एक उच्च-मार्जिन उत्पाद डिस्प्ले एक 'ठंडे' क्षेत्र में स्थित है, तो डिस्प्ले को दृश्यता और बिक्री बढ़ाने के लिए एक उच्च-आवाजाही वाले क्षेत्र में स्थानांतरित किया जा सकता है। इसके विपरीत, यदि एक विशिष्ट गलियारा लगातार उच्च ठहरने का समय लेकिन कम रूपांतरण दर दिखाता है, तो यह एक बाधा या भ्रमित करने वाले साइनेज का संकेत दे सकता है जिसे संबोधित करने की आवश्यकता है। गहन जानकारी के लिएरिटेल एप्लिकेशन्स में गहराई से जानें, हमारे रिटेल उद्योग अवलोकन को एक्सप्लोर करें।
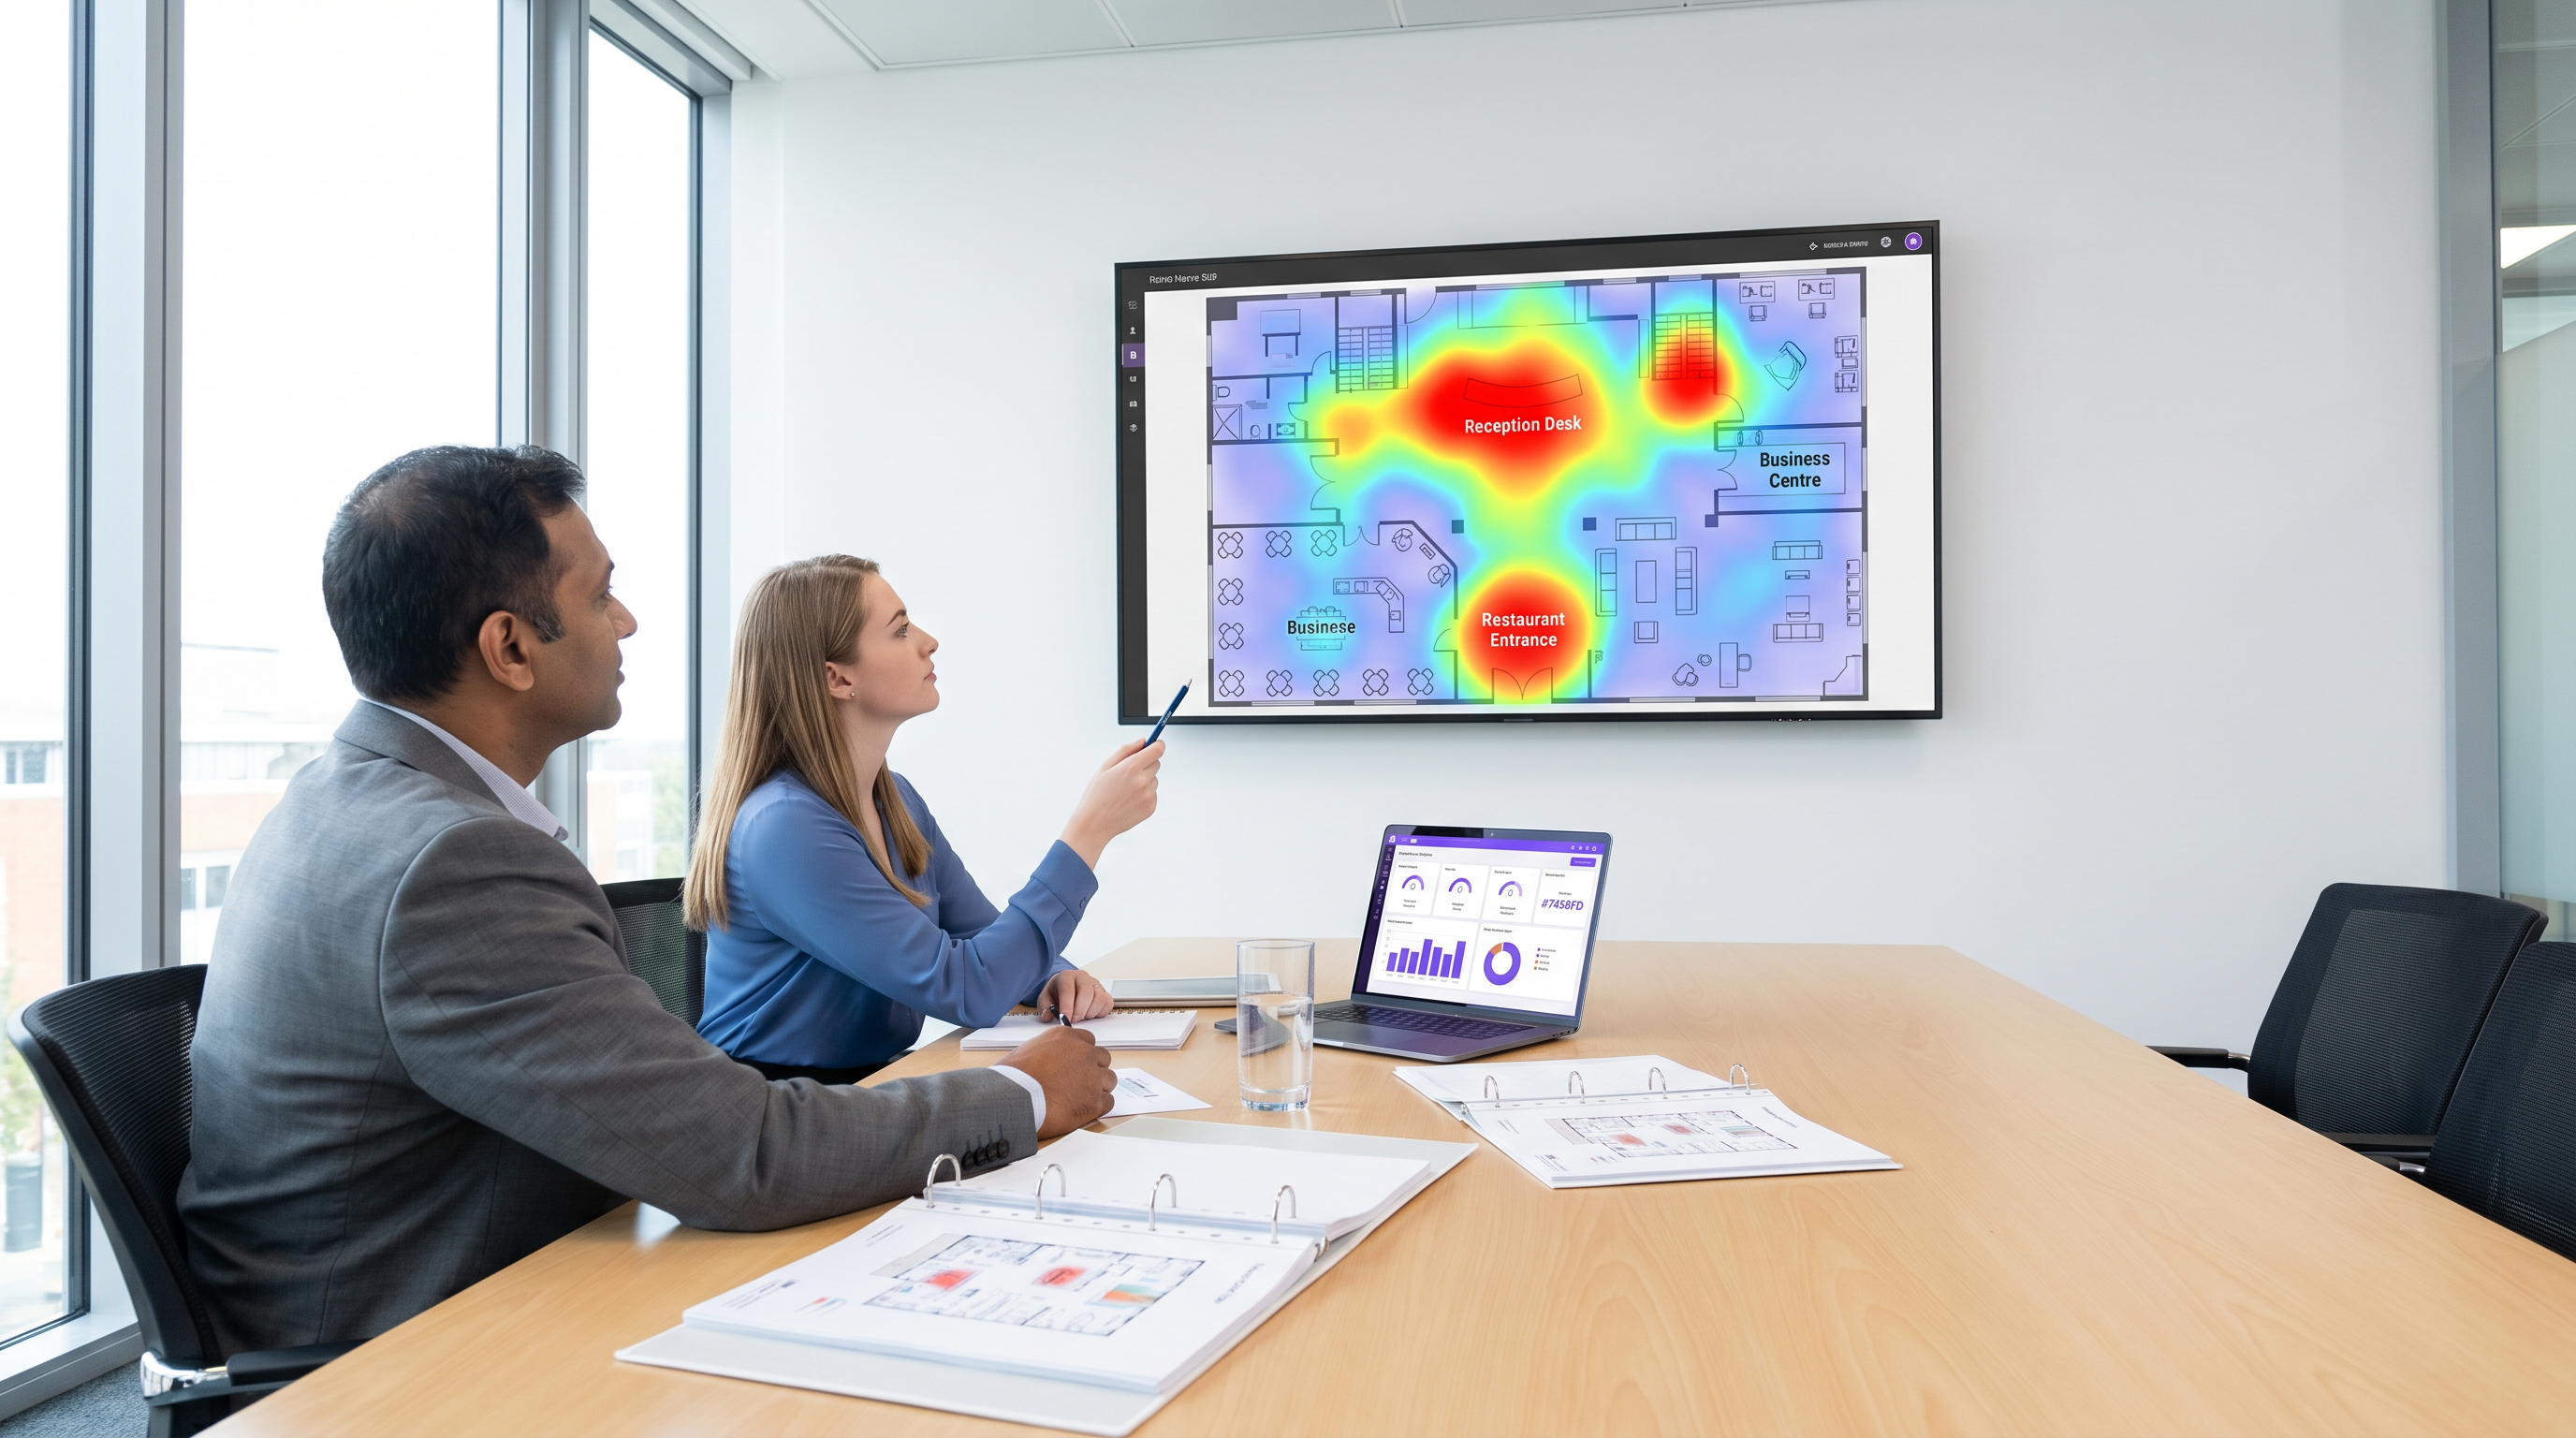
हॉस्पिटैलिटी F&B प्लेसमेंट: हॉस्पिटैलिटी सेक्टर में, ऑपरेशंस डायरेक्टर्स हीटमैप्स का उपयोग करके कम उपयोग किए गए स्थानों की पहचान कर सकते हैं और लक्षित सेवाएं तैनात कर सकते हैं। उदाहरण के लिए, यदि एक होटल लॉबी हीटमैप सुबह 8:00 बजे से 10:00 बजे के बीच फुटफॉल में भारी वृद्धि दिखाता है, लेकिन मुख्य रेस्तरां अपनी क्षमता से कम चल रहा है, तो लॉबी में एक पॉप-अप कॉफी कार्ट तैनात करने से वह राजस्व प्राप्त हो सकता है जो अन्यथा खो जाता। इस स्थानिक डेटा को गेस्ट WiFi प्रमाणीकरण के साथ एकीकृत करने से मेहमानों के व्यवहार और प्राथमिकताओं की गहरी समझ मिलती है। उच्च-घनत्व वाले वातावरण के प्रबंधन के उदाहरणों के लिए यूनिवर्सिटी कैंपस WiFi: eduroam, रेजिडेंस हॉल्स, और BYOD एट स्केल पर हमारी गाइड देखें।
वेफाइंडिंग और फ्लो मैनेजमेंट: स्टेडियम और कॉन्फ्रेंस सेंटर जैसे बड़े स्थानों में, हीटमैप्स वास्तविक समय में भीड़भाड़ वाले बिंदुओं की पहचान कर सकते हैं। यदि एक हीटमैप किसी विशिष्ट प्रवेश द्वार या कंसेशन स्टैंड पर गंभीर अड़चन दिखाता है, तो ऑपरेशंस टीमें अतिरिक्त कर्मचारियों को गतिशील रूप से तैनात कर सकती हैं या डिजिटल साइनेज को अपडेट करके ट्रैफिक को कम भीड़भाड़ वाले क्षेत्रों में रीडायरेक्ट कर सकती हैं। इस क्षमता को वेफाइंडिंग सॉल्यूशंस को एकीकृत करके और बढ़ाया जा सकता है ताकि आगंतुकों को वेन्यू के माध्यम से सक्रिय रूप से मार्गदर्शन किया जा सके।
समस्या निवारण और जोखिम न्यूनीकरण
हीटमैप एनालिटिक्स को तैनात करते समय, IT टीमों को कई तकनीकी और अनुपालन चुनौतियों का सामना करना पड़ता है।
MAC एड्रेस रैंडमाइजेशन
आधुनिक मोबाइल ऑपरेटिंग सिस्टम (iOS और Android) उपयोगकर्ता की गोपनीयता की रक्षा के लिए MAC एड्रेस रैंडमाइजेशन का उपयोग करते हैं। यह सुविधा नेटवर्क की जांच करते समय डिवाइस के MAC एड्रेस को समय-समय पर बदल देती है, जिससे केवल पैसिव प्रोब का उपयोग करके समय के साथ एक ही डिवाइस को ट्रैक करना मुश्किल हो जाता है। इसे कम करने के लिए, वेन्यू को उपयोगकर्ताओं को एक Captive Portal के माध्यम से नेटवर्क पर प्रमाणित करने के लिए प्रोत्साहित करना चाहिए। एक बार प्रमाणित होने के बाद, डिवाइस को एक स्थायी उपयोगकर्ता प्रोफ़ाइल से जोड़ा जा सकता है, जो गोपनीयता नियमों का अनुपालन बनाए रखते हुए विश्वसनीय एनालिटिक्स डेटा प्रदान करता है। प्रमाणीकरण दरों में सुधार के लिए रणनीतियों के लिए, A/B टेस्टिंग Captive Portal डिज़ाइन्स फॉर हायर साइन-अप कन्वर्जन की समीक्षा करें।
डेटा गोपनीयता और GDPR अनुपालन
स्थान डेटा एकत्र करने के महत्वपूर्ण गोपनीयता निहितार्थ हैं। वेन्यू को GDPR और CCPA जैसे विनियमों का अनुपालन सुनिश्चित करना चाहिए। सर्वोत्तम प्रथाओं में डिफ़ॉल्ट रूप से डेटा को गुमनाम करना और एकत्रित करना, Captive Portal के नियमों और शर्तों के भीतर डेटा उपयोग नीतियों को स्पष्ट रूप से संप्रेषित करना, और उपयोगकर्ताओं के लिए एक सीधा ऑप्ट-आउट तंत्र प्रदान करना शामिल है। ध्यान हमेशा मैक्रो रुझानों और प्रवाह पैटर्न को समझने पर होना चाहिए, न कि स्पष्ट सहमति के बिना व्यक्तिगत उपयोगकर्ताओं को ट्रैक करने पर।
ROI और व्यावसायिक प्रभाव
एक हीटमैप परिनियोजन का ROI स्वयं मानचित्रों से नहीं, बल्कि उन परिचालन निर्णयों से मापा जाता है जिन्हें वे सक्षम करते हैं। उपाख्यानात्मक मान्यताओं को अनुभवजन्य डेटा से बदलकर, वेन्यू स्थान के उपयोग, स्टाफिंग दक्षता और राजस्व सृजन में मापने योग्य सुधार प्राप्त कर सकते हैं।
रिटेल वातावरण में, सफलता को अक्सर प्रति वर्ग फुट बिक्री में वृद्धि या डेटा-संचालित लेआउट परिवर्तन के बाद रूपांतरण दरों में सुधार से मापा जाता है। हॉस्पिटैलिटी और इवेंट्स में, प्रमुख मेट्रिक्स में कम कतार समय, बढ़ी हुई खाद्य और पेय कैप्चर दरें, और बेहतर अतिथि संतुष्टि स्कोर शामिल हैं। अंततः, हीटमैप विश्लेषण भौतिक वेन्यू को एक मापने योग्य, अनुकूलनीय संपत्ति में बदल देता है, जो निरंतर सुधार और परिचालन उत्कृष्टता को चलाने के लिए आवश्यक बुद्धिमत्ता प्रदान करता है। आधुनिक नेटवर्क लाभों पर एक व्यापक दृष्टिकोण के लिए, द कोर SD WAN बेनिफिट्स फॉर मॉडर्न बिज़नेसेज़ पढ़ें।
Key Terms & Definitions
Received Signal Strength Indicator (RSSI)
A measurement of the power present in a received radio signal. In heatmap analytics, RSSI is used to estimate the distance between a device and an access point.
IT teams use RSSI thresholds to define zone boundaries and filter out devices that are outside the venue.
MAC Address Randomisation
A privacy feature in modern operating systems that periodically changes a device's MAC address when probing for networks, preventing long-term passive tracking.
This feature requires venues to encourage active network authentication (via captive portals) to maintain accurate, persistent analytics data.
Location Jitter
An anomaly where a device appears to bounce rapidly between adjacent zones on a heatmap, usually caused by poor AP placement or insufficient signal density.
Network architects must design staggered AP layouts to prevent jitter and ensure actionable data.
Probe Request
A frame sent by a client device (e.g., a smartphone) to discover available WiFi networks in its vicinity.
Analytics engines listen for these probes to detect device presence, even if the device does not connect to the network.
Triangulation
The process of determining a device's location by measuring the RSSI from at least three different access points simultaneously.
This is the fundamental mechanism that allows raw WiFi signal data to be translated into a visual heatmap.
Dwell Time
The amount of time a device remains continuously within a specific defined zone.
Operations teams use dwell time to differentiate between transient traffic (walking past) and engaged traffic (browsing a display or waiting in line).
Semantic Tagging
The practice of assigning logical, business-relevant labels (e.g., 'Menswear', 'Food Court') to physical zones on a digital floor plan.
This allows analytics platforms to aggregate data across multiple venues and generate reports that make sense to business stakeholders.
Edge Bleeding
When devices located outside the physical venue (e.g., on the street) are erroneously captured and mapped within the venue's analytics data.
IT teams must carefully calibrate RSSI boundaries to filter out this noise and ensure the heatmap only reflects true venue traffic.
Case Studies
A 200-room business hotel is experiencing congestion in the main lobby during morning checkout (8:00 AM - 10:00 AM). The operations director wants to use WiFi analytics to understand the flow and deploy a mobile coffee cart to capture lost F&B revenue. How should the IT team configure the heatmap zones and analytics to support this?
- Zone Definition: The IT team must define granular zones within the lobby area, separating the 'Reception Desk', 'Main Entrance', 'Lounge Seating', and 'Elevator Bank'.
- Dwell Time Calibration: Configure the analytics engine to filter out transient traffic (dwell time < 2 minutes) to isolate guests who are actually waiting in the lobby versus those simply walking through.
- Heatmap Generation: Generate a time-lapsed heatmap specifically for the 8:00 AM - 10:00 AM window over a two-week period to identify the consistent 'hot zones' where guests congregate while waiting.
- Deployment: Based on the data, position the mobile coffee cart adjacent to the hottest zone (e.g., near the lounge seating) but outside the direct flow path to the main entrance to avoid exacerbating the bottleneck.
A large retail chain is redesigning its flagship store layout. The visual merchandising team wants to identify 'dead zones' where high-margin products are currently placed but receiving little footfall. How should the network architect ensure the WiFi infrastructure can provide accurate data for this analysis?
- AP Placement Audit: The architect must review the existing AP deployment. If APs are deployed in straight lines down the main aisles, they must be repositioned into a staggered grid pattern to enable accurate triangulation.
- Density Check: Ensure that every point on the retail floor is visible to at least three APs at -65 dBm or better.
- Boundary Filtering: Configure RSSI thresholds to filter out devices probing from the street or adjacent stores to ensure the heatmap only reflects actual in-store traffic.
- Integration: Export the heatmap data via API to overlay it onto the store's planogram software, allowing merchandisers to correlate footfall with specific product displays.
Scenario Analysis
Q1. You are deploying a heatmap solution in a long, narrow retail corridor. The initial design places three Access Points in a straight line down the centre of the ceiling. What is the primary risk of this design, and how should it be corrected?
💡 Hint:Consider how the analytics engine calculates the position of a device based on signal strength from multiple angles.
Show Recommended Approach
The primary risk is 'location jitter' or a complete inability to accurately triangulate the device's position on the Y-axis (width of the corridor). Because the APs are in a straight line, the analytics engine cannot determine if a device is on the left side or the right side of the corridor, only its position along the length. To correct this, the APs must be staggered in a zig-zag pattern (e.g., one on the left wall, the next on the right wall, the next on the left) to provide the necessary angles for accurate triangulation.
Q2. A stadium operations director reports that the heatmap for the main concourse is showing significant traffic in the 'Food Court' zone at 3:00 AM, when the venue is closed. What is the most likely cause of this anomaly, and what configuration change is required?
💡 Hint:Think about what is physically located outside the stadium walls and how RF signals travel.
Show Recommended Approach
The most likely cause is 'edge bleeding'—the APs inside the stadium are detecting probe requests from devices outside the venue, such as passing cars or pedestrians on an adjacent street. To resolve this, the IT team needs to calibrate the boundary filtering. This involves adjusting the RSSI thresholds for the APs near the exterior walls so they ignore signals weaker than a specific level (e.g., ignoring signals weaker than -75 dBm), effectively trimming the coverage area to the physical boundaries of the concourse.
Q3. A retail client wants to track the exact path of individual, returning customers across multiple store visits over a six-month period using only passive WiFi heatmaps (no captive portal authentication). Why is this technically unfeasible, and what alternative approach should you recommend?
💡 Hint:Consider the privacy features implemented by modern mobile operating systems.
Show Recommended Approach
This is unfeasible due to MAC Address Randomisation. Modern iOS and Android devices periodically change their MAC addresses when sending passive probe requests to prevent long-term tracking. Therefore, the analytics engine will see the same returning customer as a new, unique device on subsequent visits. The recommended alternative is to deploy a Guest WiFi captive portal that offers a value exchange (e.g., free WiFi, a discount code). Once the user authenticates, their device can be tied to a persistent profile, allowing for accurate long-term tracking while ensuring explicit user consent and GDPR compliance.
