व्हेन्यू ट्रॅफिकसाठी हीटमॅप विश्लेषण: एक व्यावहारिक मार्गदर्शक
हे तांत्रिक संदर्भ मार्गदर्शक भौतिक व्हेन्यूजमध्ये WiFi-आधारित हीटमॅप्स तैनात आणि विश्लेषण करण्यासाठी कृती करण्यायोग्य धोरणे प्रदान करते. IT आणि ऑपरेशन्स लीडर्स ग्राहकांच्या प्रवाहाचे नमुने उघड करण्यासाठी, अडथळे दूर करण्यासाठी आणि अवकाशीय ROI ऑप्टिमाइझ करण्यासाठी विद्यमान नेटवर्क इन्फ्रास्ट्रक्चरचा कसा फायदा घेऊ शकतात हे ते स्पष्ट करते.
हे मार्गदर्शक ऐका
पॉडकास्ट ट्रान्सक्रिप्ट पहा
कार्यकारी सारांश
व्हेन्यू ऑपरेटर, रिटेल मर्चेंडायझर्स आणि मालमत्ता मालकांसाठी, भौतिक जागा ही ताळेबंदावरील सर्वात महागडी मालमत्ता आहे. प्रवेशद्वारांवर पारंपारिक फूटफॉल मोजणी केवळ गर्दीची प्राथमिक समज प्रदान करते, ग्राहकांचे वर्तन, ड्वेल टाईम (थांबण्याची वेळ) आणि जागेचा वापर याबद्दलच्या महत्त्वपूर्ण प्रश्नांची उत्तरे देण्यात अपयशी ठरते. WiFi हीटमॅप विश्लेषण विद्यमान वायरलेस इन्फ्रास्ट्रक्चरला एका शक्तिशाली लोकेशन इंटेलिजन्स प्लॅटफॉर्ममध्ये रूपांतरित करून ही दरी कमी करते. डिव्हाइसच्या उपस्थितीचा डेटा कॅप्चर आणि विश्लेषण करून, संस्था ग्राहकांच्या प्रवाहाचे नमुने दृश्यमान करू शकतात, ऑपरेशनल अडथळे ओळखू शकतात आणि त्यांच्या फ्लोअर प्लॅन्सवर उच्च-मूल्य झोन निश्चित करू शकतात. हे मार्गदर्शक हीटमॅप ॲनालिटिक्स तैनात करण्यासाठी, अचूक डेटा संकलन सुनिश्चित करण्यासाठी आणि अवकाशीय बुद्धिमत्तेचे (spatial intelligence) मोजता येण्याजोग्या व्यावसायिक परिणामांमध्ये भाषांतर करण्यासाठी एक व्यावहारिक, व्हेंडर-न्यूट्रल फ्रेमवर्क प्रदान करते. तुम्ही स्टेडियम कॉनकोर्स, रिटेल फ्लॅगशिप किंवा हॉटेल लॉबी व्यवस्थापित करत असलात तरीही, हा संदर्भ तुम्हाला लेआउट ऑप्टिमाइझ करण्यासाठी, अतिथींचा अनुभव सुधारण्यासाठी आणि ROI वाढवण्यासाठी डेटा-आधारित निर्णय घेण्यास सक्षम करेल.
तांत्रिक सखोल माहिती: WiFi हीटमॅप्स कसे तयार केले जातात
WiFi हीटमॅप विश्लेषणाचा पाया प्रेझेन्स डिटेक्शन (उपस्थिती शोधणे) आहे. जेव्हा एखाद्या अभ्यागताच्या स्मार्टफोन किंवा वेअरेबल डिव्हाइसचा WiFi इंटरफेस सक्षम असतो, तेव्हा तो ज्ञात नेटवर्क शोधण्यासाठी वेळोवेळी प्रोब विनंत्या (probe requests) प्रसारित करतो. रेंजमधील ॲक्सेस पॉइंट्स (APs) या प्रोब्स ऐकतात आणि रिसीव्ह्ड सिग्नल स्ट्रेंथ इंडिकेटर (RSSI) मोजतात. एकाच वेळी एकाधिक APs कडून RSSI डेटा एकत्रित करून, नेटवर्क डिजिटल फ्लोअर प्लॅनवर डिव्हाइसच्या स्थानाचे त्रिकोणीकरण (triangulate) करू शकते.
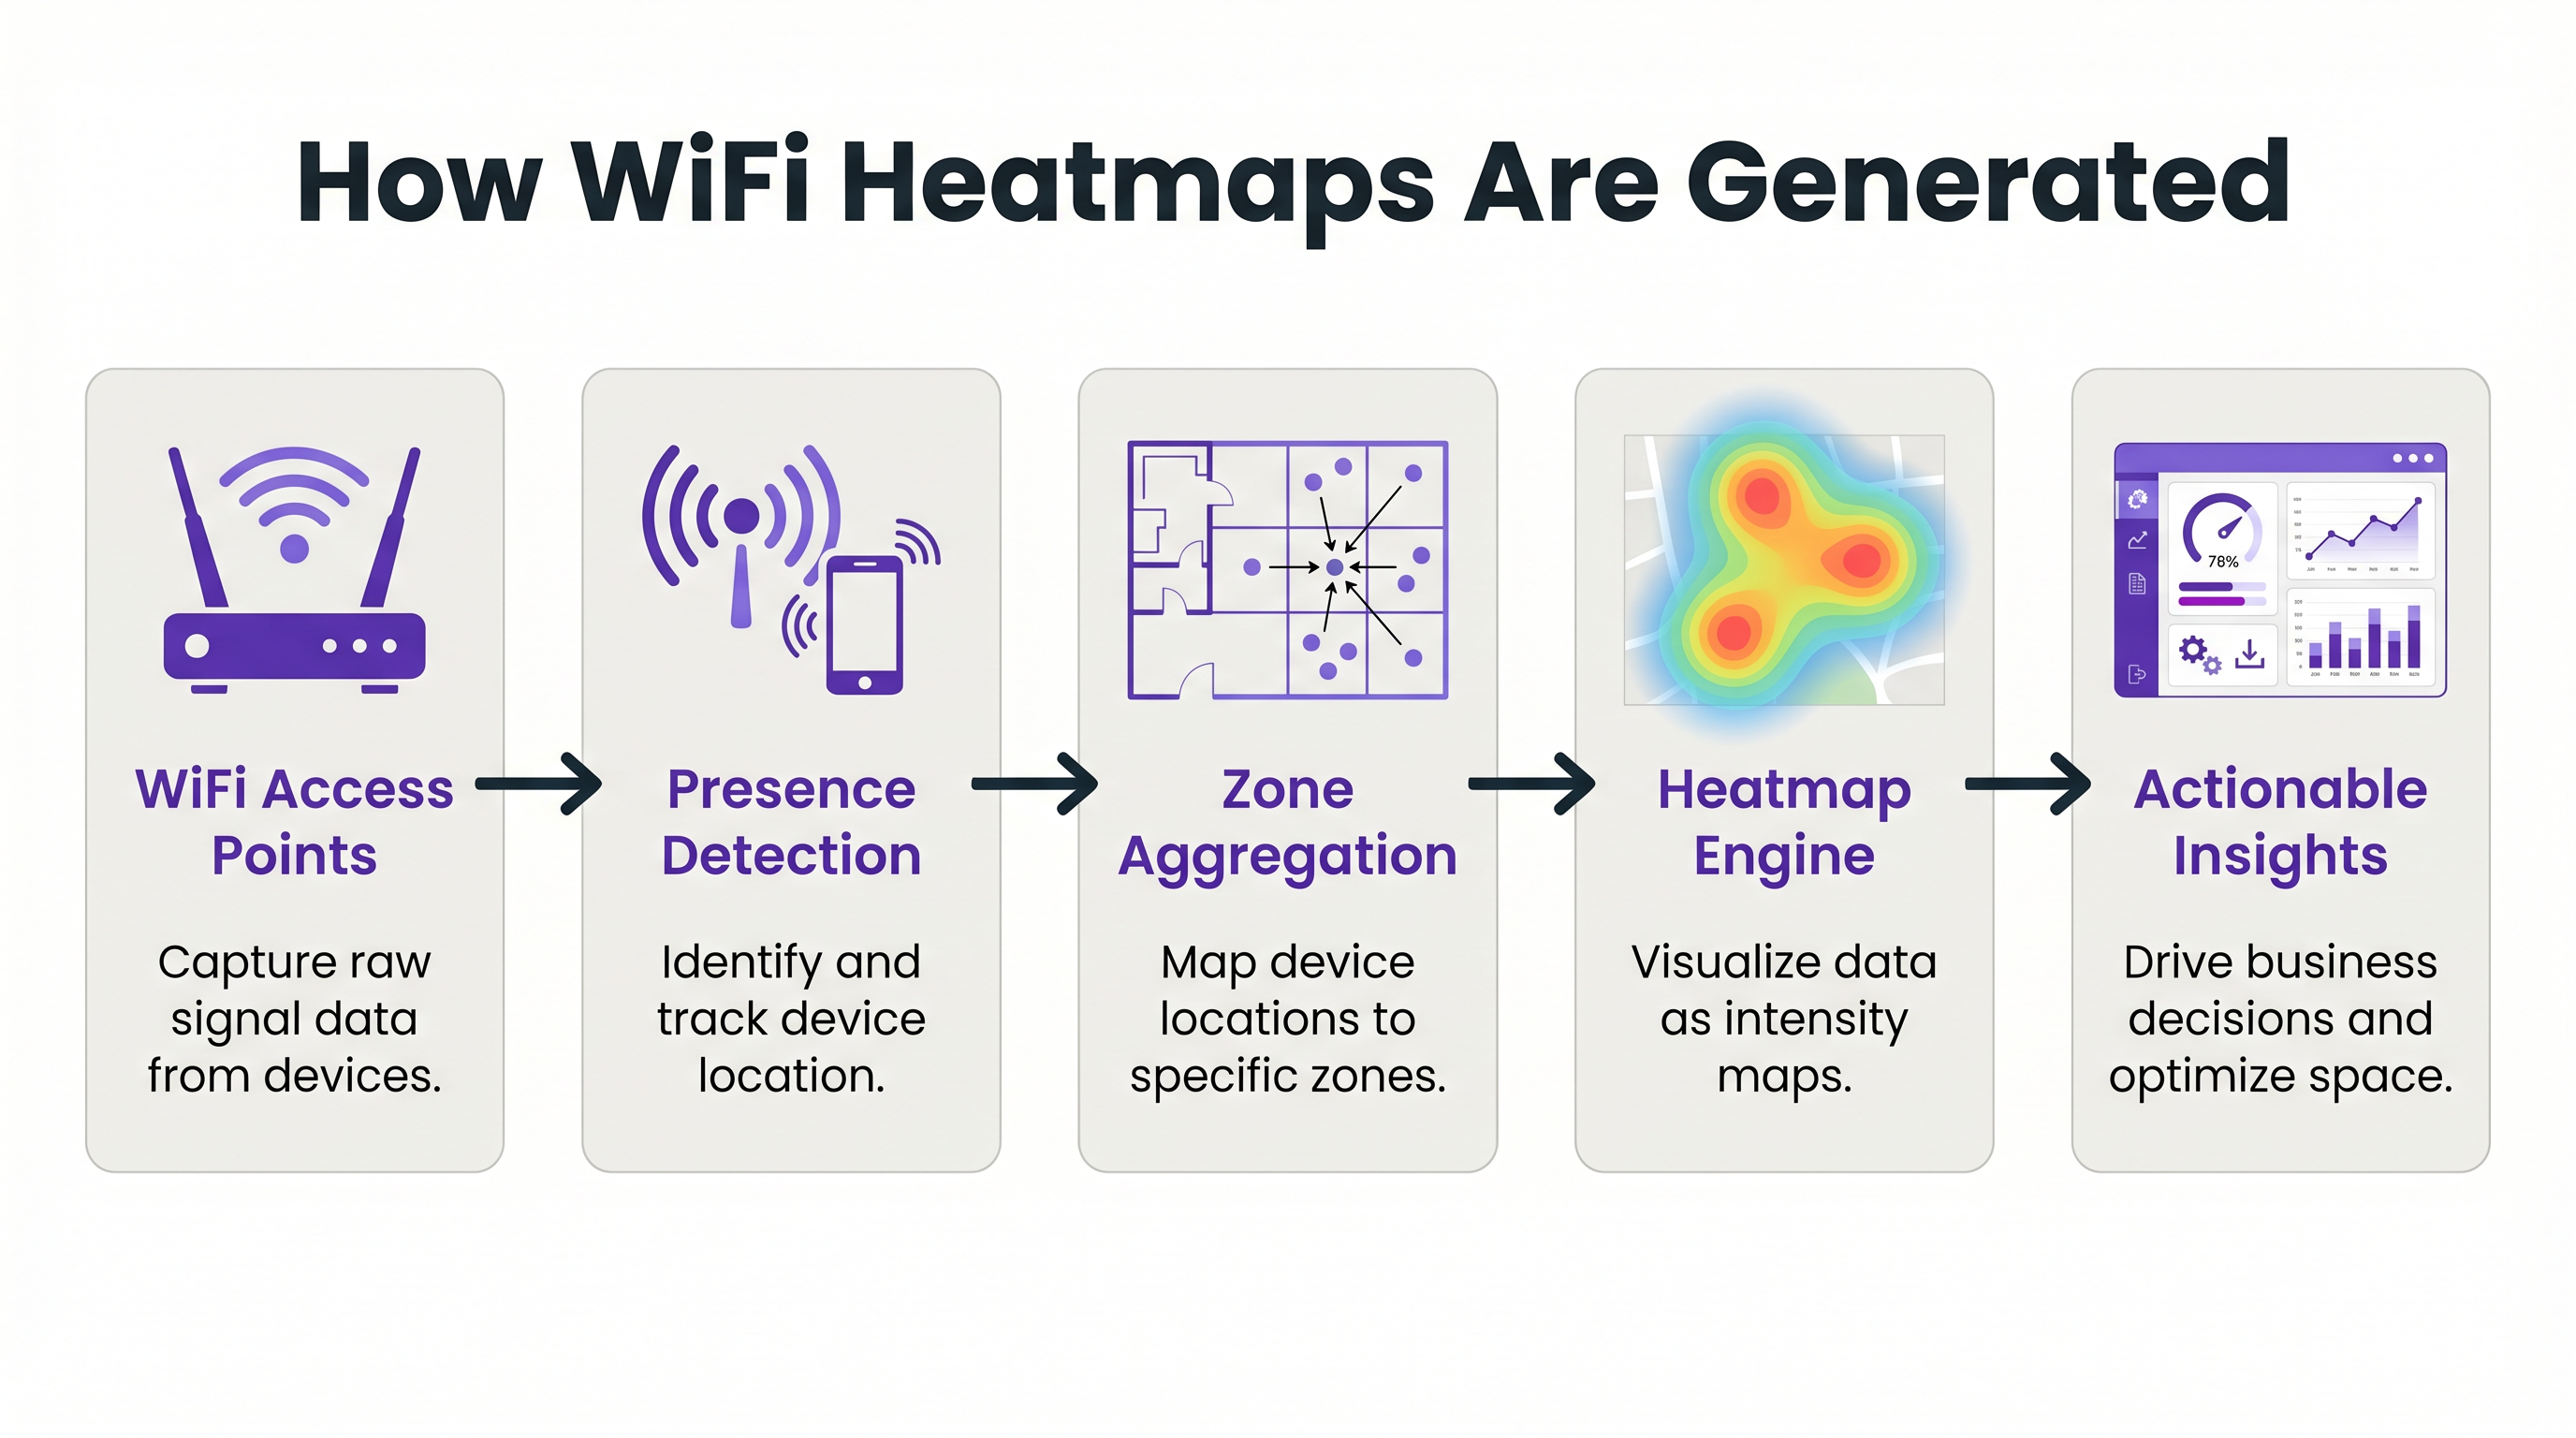
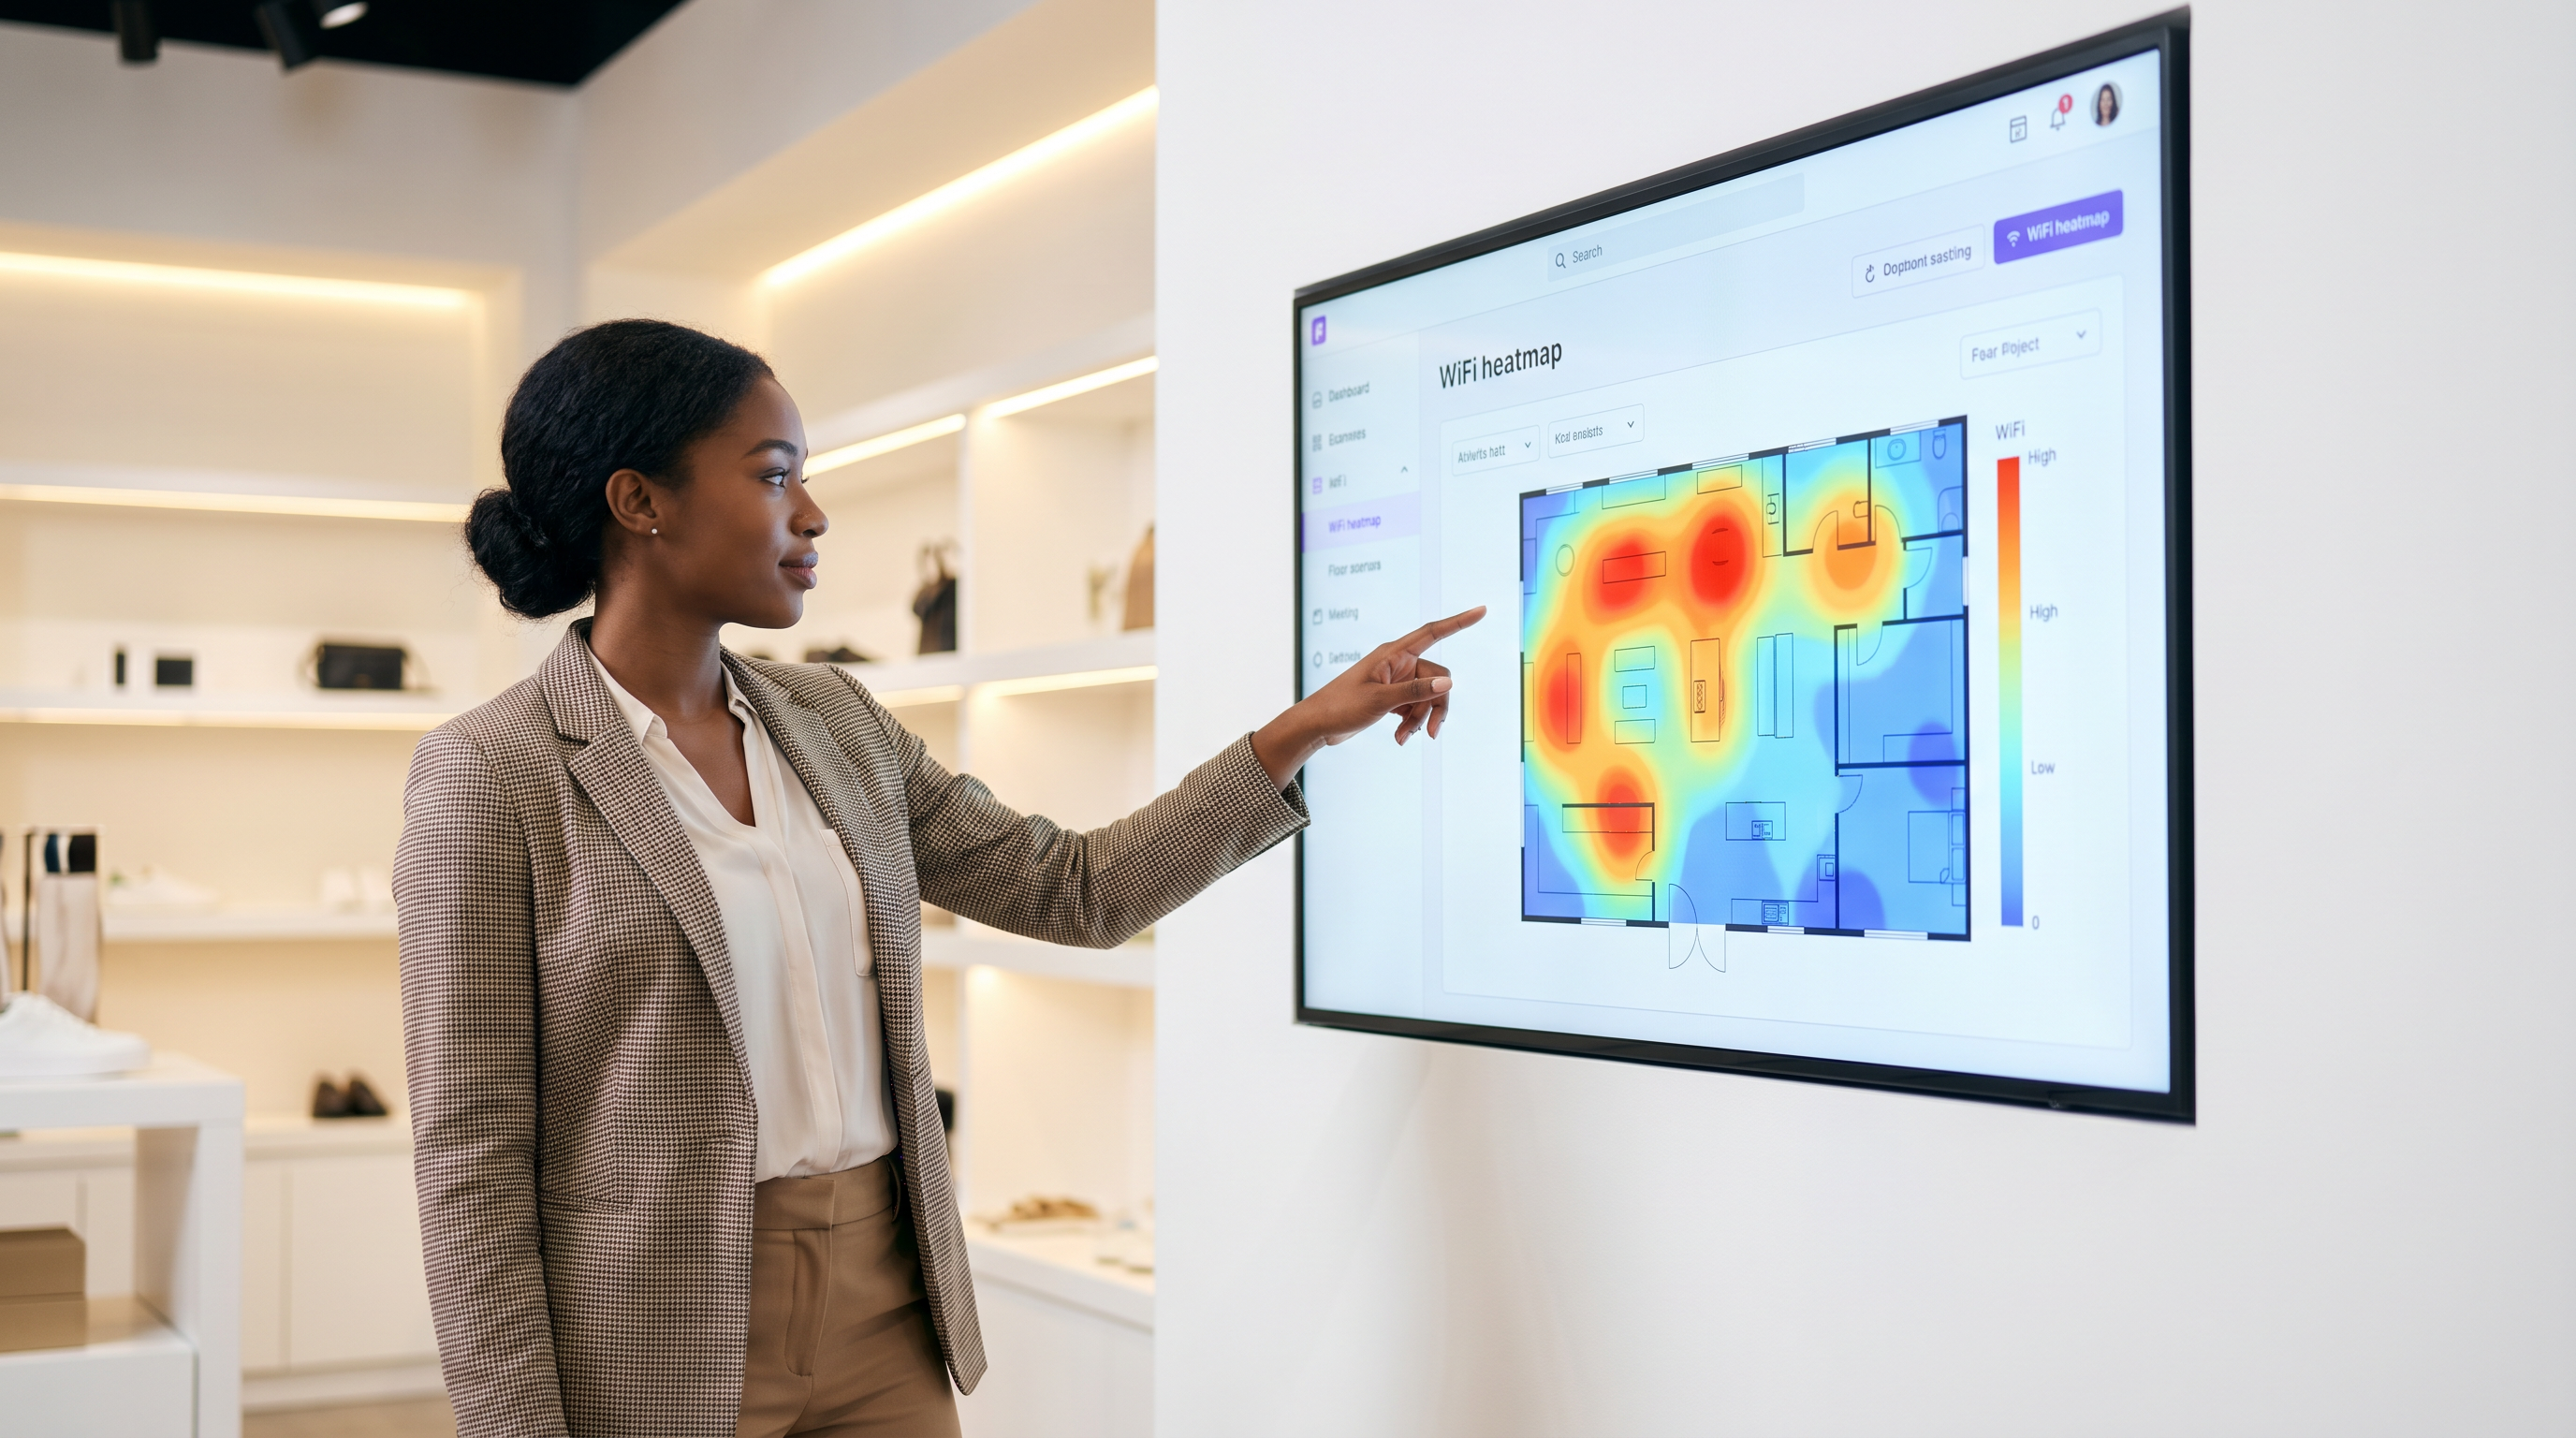
हा कच्चा लोकेशन डेटा नंतर मध्यवर्ती ॲनालिटिक्स इंजिनद्वारे प्रोसेस केला जातो, जसे की WiFi Analytics , जे पूर्वनिर्धारित अवकाशीय झोनमध्ये (spatial zones) निर्देशांकांना मॅप करते. इंजिन एकत्रित डेटाचे व्हिज्युअल इंटेन्सिटी मॅप्समध्ये भाषांतर करते, ज्यांना सामान्यतः हीटमॅप्स म्हणून ओळखले जाते. उच्च डिव्हाइस घनता किंवा विस्तारित ड्वेल टाईम असलेले क्षेत्र 'उबदार' रंगांमध्ये (लाल आणि केशरी) प्रस्तुत केले जातात, तर कमी रहदारी असलेले क्षेत्र 'थंड' रंगांमध्ये (निळे आणि हिरवे) प्रस्तुत केले जातात.
कृती करण्यायोग्य अचूकता साध्य करण्यासाठी, नेटवर्क आर्किटेक्चर केवळ मानक कव्हरेजसाठी नाही तर लोकेशन सेवांसाठी डिझाइन केलेले असणे आवश्यक आहे. घनता आणि लाइन-ऑफ-साइट ही मूलभूत आवश्यकता आहे. एक विश्वासार्ह नियम असा आहे की फ्लोअर प्लॅनवरील कोणताही बिंदू किमान -65 dBm च्या सिग्नल स्ट्रेंथवर किमान तीन APs ला दृश्यमान असावा. आव्हानात्मक RF वातावरणात, जसे की मेटल शेल्व्हिंग असलेली गोदामे किंवा दाट संरचनात्मक भिंती असलेली रुग्णालये, मानक AP डिप्लॉयमेंट अपुरे असू शकतात. या परिस्थितींमध्ये, क्लायंट ट्रॅफिक न देता केवळ प्रोब्स ऐकणारे समर्पित Sensors तैनात केल्याने लोकेशनची अचूकता आणि रिझोल्यूशन लक्षणीयरीत्या सुधारू शकते.
अंमलबजावणी मार्गदर्शक: लोकेशन इंटेलिजन्ससाठी डिझाइन करणे
गोळा केलेला डेटा अचूक आणि कृती करण्यायोग्य आहे याची खात्री करण्यासाठी हीटमॅप सोल्यूशन तैनात करण्यासाठी काळजीपूर्वक नियोजन करणे आवश्यक आहे. अंमलबजावणी प्रक्रिया तीन मुख्य टप्प्यांत विभागली जाऊ शकते: नेटवर्क रेडीनेस, झोन मॅपिंग आणि डेटा कॅलिब्रेशन.
टप्पा 1: नेटवर्क रेडीनेस आणि AP प्लेसमेंट
लोकेशन ॲनालिटिक्समधील अपयशाचे सर्वात सामान्य कारण म्हणजे खराब AP प्लेसमेंट. जर APs कॉरिडॉरमध्ये एका सरळ रेषेत तैनात केले असतील, तर नेटवर्क डिव्हाइसच्या स्थानाचे अचूक त्रिकोणीकरण करू शकत नाही, परिणामी 'लोकेशन जिटर' (location jitter) होते जेथे डिव्हाइस लगतच्या झोनमध्ये वेगाने उसळताना दिसते. हे कमी करण्यासाठी, फ्लोअर प्लॅनवर APs झिग-झॅग किंवा स्टॅगर्ड ग्रिड पॅटर्नमध्ये (staggered grid pattern) लावले पाहिजेत. हे सुनिश्चित करते की डिव्हाइसचा सिग्नल एकाधिक कोनातून प्राप्त झाला आहे, ज्यामुळे ॲनालिटिक्स इंजिनला अचूक लोकेशन फिक्सची गणना करता येते.
टप्पा 2: झोन मॅपिंग आणि सिमेंटिक टॅगिंग
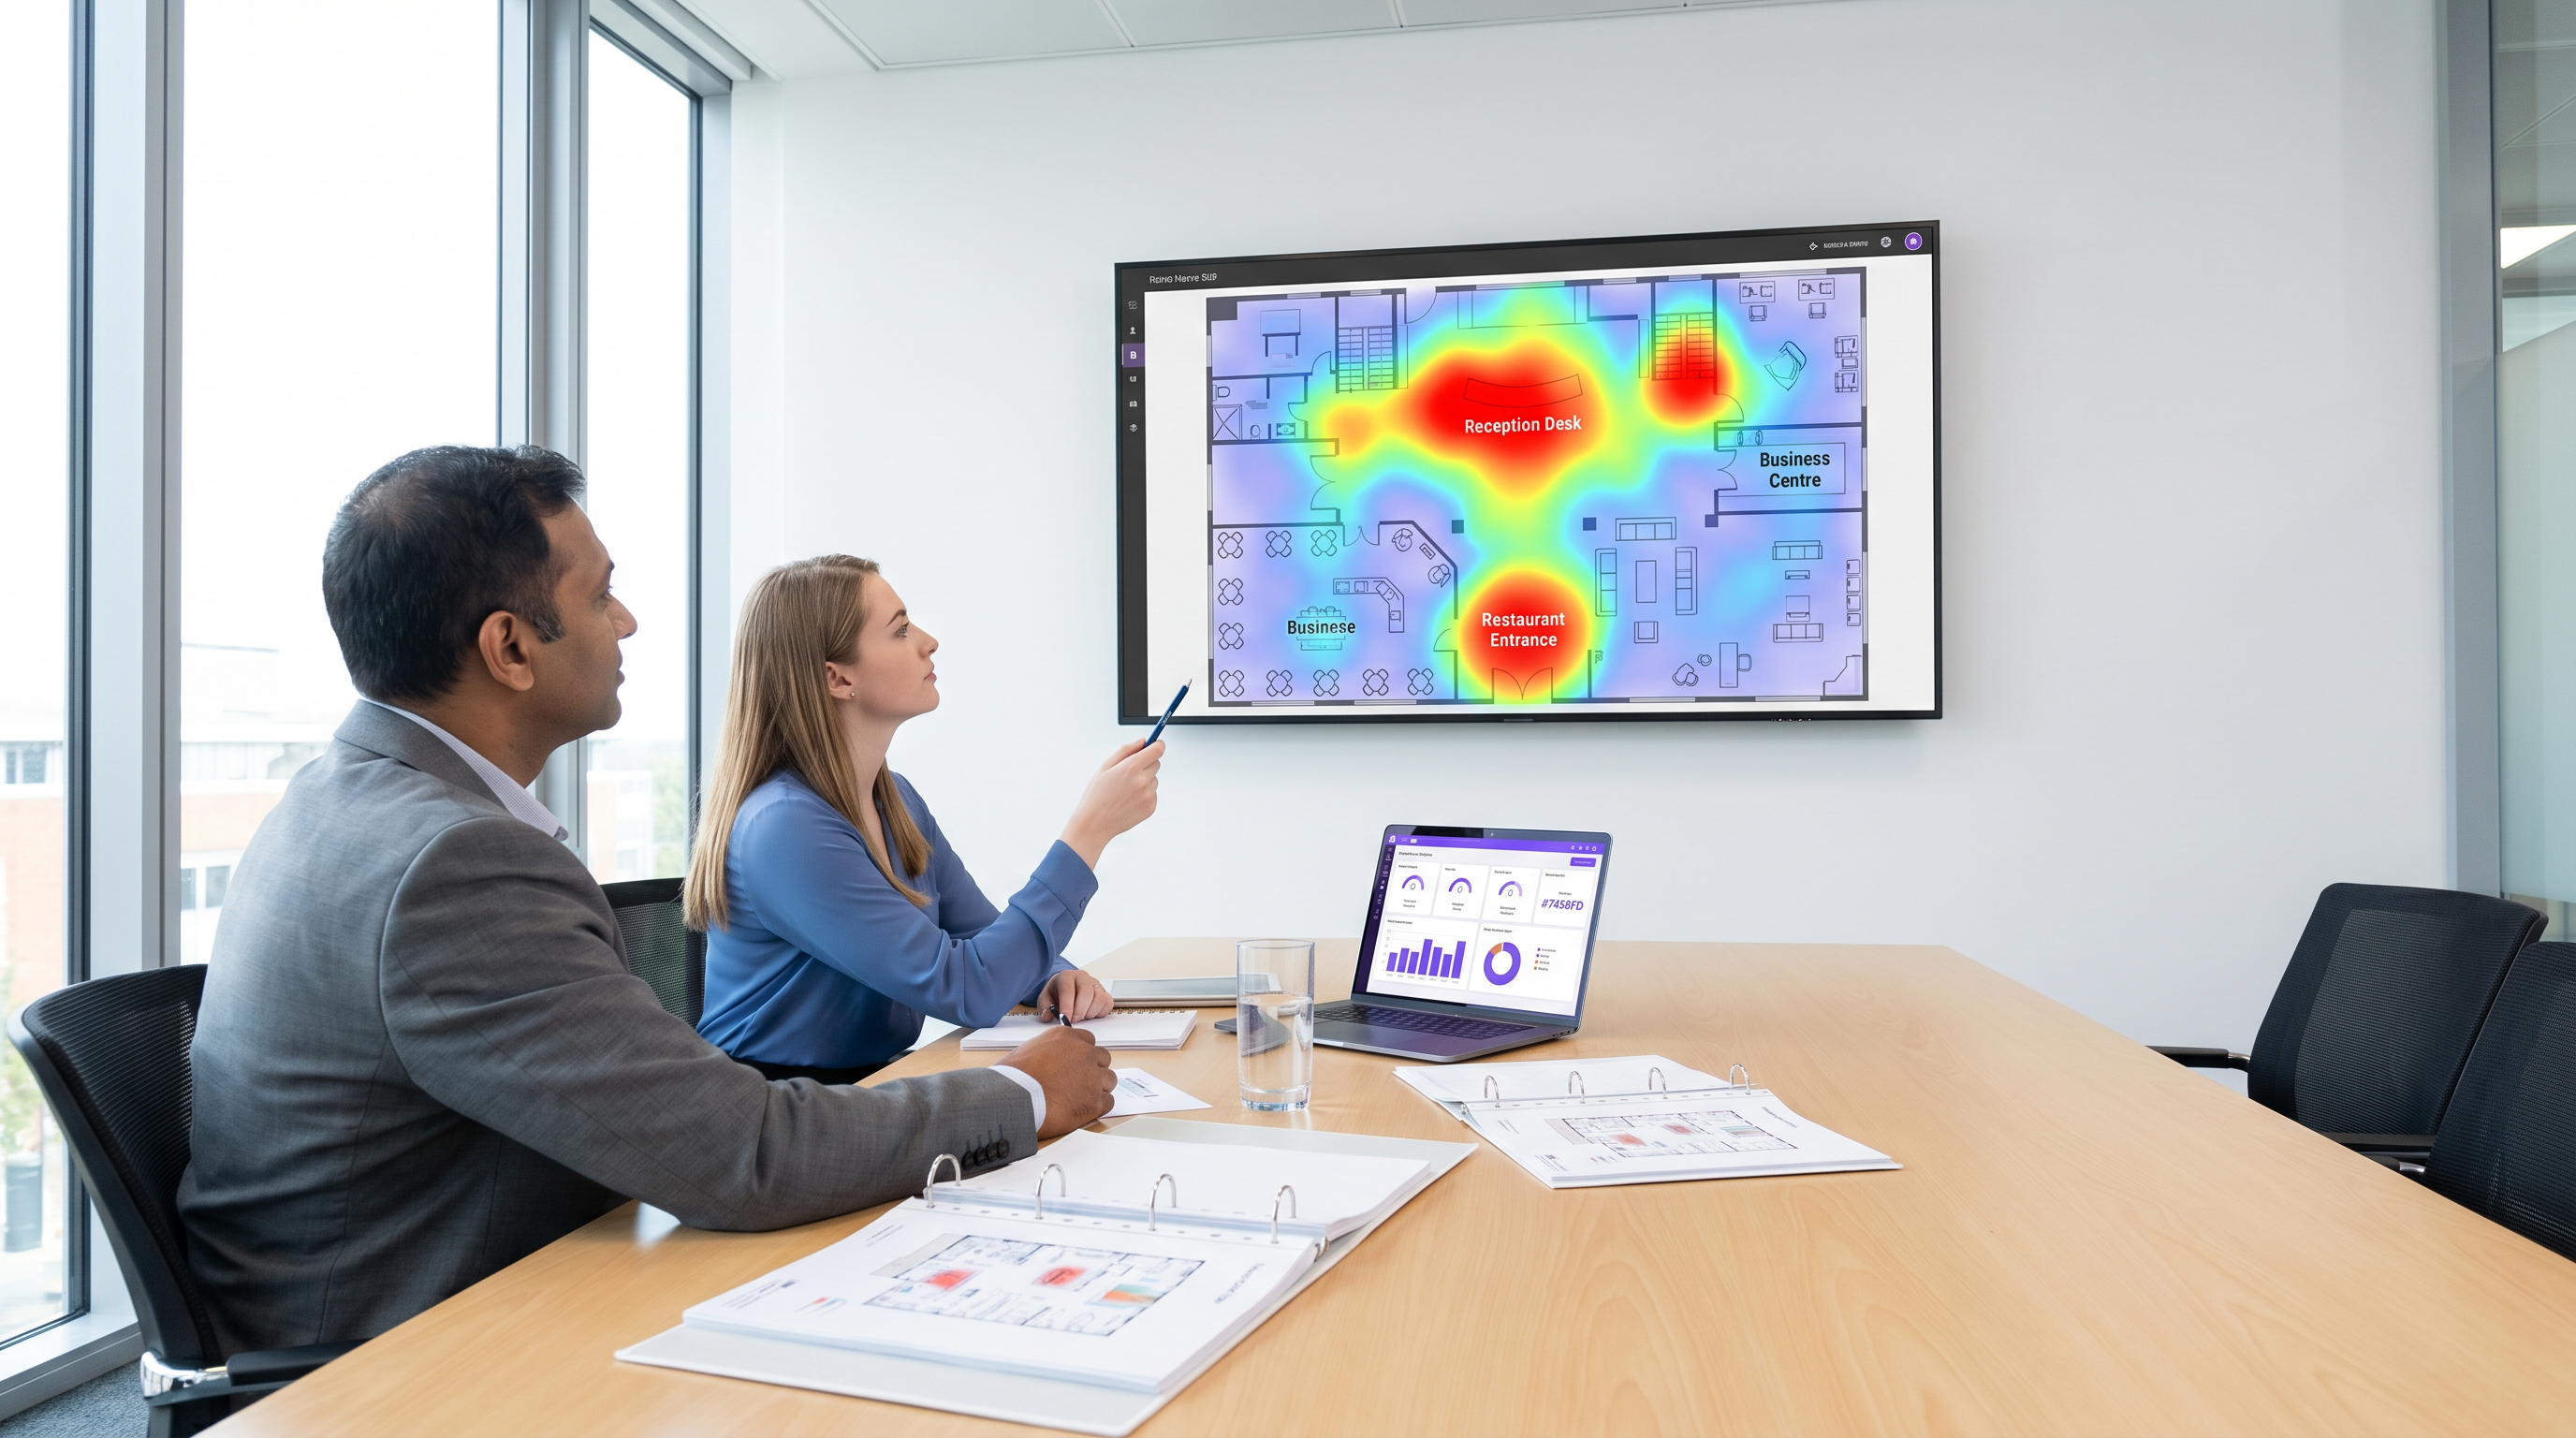
एकदा नेटवर्क अचूक त्रिकोणीकरणास सक्षम झाल्यानंतर, भौतिक फ्लोअर प्लॅन डिजिटाइझ करणे आणि लॉजिकल झोनमध्ये मॅप करणे आवश्यक आहे. झोनने 'रिसेप्शन डेस्क', 'मेन्सवेअर डिपार्टमेंट' किंवा 'फूड कोर्ट' यासारख्या वेगळ्या कार्यात्मक क्षेत्राचे प्रतिनिधित्व केले पाहिजे. झोन परिभाषित करताना, नेटवर्कच्या रिझोल्यूशन क्षमतेसाठी खूप लहान असलेली क्षेत्रे तयार करणे टाळणे महत्त्वाचे आहे. जर नेटवर्क केवळ 5 मीटरच्या आत लोकेशन रिझोलव्ह करू शकत असेल, तर 2-मीटरचा झोन तयार केल्याने गोंगाटयुक्त (noisy), अविश्वासार्ह डेटा मिळेल. एकत्रित रिपोर्टिंगला अनुमती देण्यासाठी प्रत्येक झोनला सिमेंटिकली टॅग केले जावे (उदा., एकाधिक व्हेन्यूजमधील सर्व 'Food & Beverage' झोनच्या कामगिरीची तुलना करणे).
टप्पा 3: डेटा कॅलिब्रेशन आणि बाउंड्री फिल्टरिंग
अंतिम टप्पा म्हणजे गोंगाट आणि अप्रासंगिक डेटा फिल्टर करण्यासाठी ॲनालिटिक्स इंजिन कॅलिब्रेट करणे. यामध्ये व्हेन्यूच्या भौतिक सीमांच्या बाहेरील डिव्हाइसेसकडे दुर्लक्ष करण्यासाठी RSSI थ्रेशोल्ड कॉन्फिगर करणे समाविष्ट आहे (उदा., रस्त्यावरून जाणारे पादचारी). डिस्प्ले सक्रियपणे ब्राउझ करणारा ग्राहक आणि झोनमधून फक्त चालत जाणारा कर्मचारी यांच्यात फरक करण्यासाठी ड्वेल टाईम पॅरामीटर्स सेट करणे देखील यात समाविष्ट आहे.
कृती करण्यायोग्य इनसाइट्ससाठी सर्वोत्तम पद्धती
हीटमॅप तयार करणे ही केवळ पहिली पायरी आहे; खरे मूल्य डेटा ऑपरेशनल आव्हानांवर कसा लागू केला जातो यात आहे.
रिटेल स्टोअर लेआउट ऑप्टिमायझेशन: रिटेल मर्चेंडायझर्स स्टोअर लेआउट्स आणि उत्पादन प्लेसमेंटच्या कामगिरीचे मूल्यांकन करण्यासाठी हीटमॅप्स वापरू शकतात. जर हीटमॅपवरून असे दिसून आले की उच्च-मार्जिन उत्पादन डिस्प्ले 'थंड' झोनमध्ये स्थित आहे, तर दृश्यमानता आणि विक्री वाढवण्यासाठी डिस्प्ले उच्च-रहदारीच्या क्षेत्रात हलविला जाऊ शकतो. याउलट, जर एखाद्या विशिष्ट आयलमध्ये (aisle) सातत्याने उच्च ड्वेल टाईम परंतु कमी रूपांतरण दर (conversion rates) दिसत असतील, तर ते एक अडथळा किंवा गोंधळात टाकणारे साइनेज दर्शवू शकते ज्याकडे लक्ष देणे आवश्यक आहे. रिटेल ॲप्लिकेशन्सच्या सखोल माहितीसाठी, आमचे Retail इंडस्ट्री ओव्हरव्ह्यू एक्सप्लोर करा.
हॉस्पिटॅलिटी F&B प्लेसमेंट: हॉस्पिटॅलिटी क्षेत्रात, ऑपरेशन्स डायरेक्टर्स कमी वापरल्या जाणाऱ्या जागा ओळखण्यासाठी आणि लक्ष्यित सेवा तैनात करण्यासाठी हीटमॅप्स वापरू शकतात. उदाहरणार्थ, जर हॉटेल लॉबी हीटमॅप सकाळी 8:00 ते 10:00 दरम्यान फूटफॉलमध्ये मोठी वाढ दर्शवत असेल, परंतु मुख्य रेस्टॉरंट क्षमतेपेक्षा कमी चालत असेल, तर लॉबीमध्ये पॉप-अप कॉफी कार्ट तैनात केल्याने अन्यथा गमावला जाणारा महसूल मिळवता येतो. हा अवकाशीय डेटा Guest WiFi ऑथेंटिकेशनसह एकत्रित केल्याने अतिथींचे वर्तन आणि प्राधान्यांची सखोल समज मिळते. उच्च-घनतेची वातावरणे व्यवस्थापित करण्याच्या उदाहरणांसाठी आमचे University Campus WiFi: eduroam, Residence Halls, and BYOD at Scale वरील मार्गदर्शक पहा.
वेफाइंडिंग आणि फ्लो मॅनेजमेंट: स्टेडियम्स आणि कॉन्फरन्स सेंटर्ससारख्या मोठ्या व्हेन्यूजमध्ये, हीटमॅप्स रिअल-टाइममध्ये गर्दीचे बिंदू ओळखू शकतात. जर हीटमॅप एखाद्या विशिष्ट प्रवेशद्वारावर किंवा कन्सेशन स्टँडवर तीव्र अडथळा दर्शवत असेल, तर ऑपरेशन्स टीम्स कमी गर्दीच्या भागात रहदारी वळवण्यासाठी डायनॅमिकली अतिरिक्त कर्मचारी तैनात करू शकतात किंवा डिजिटल साइनेज अपडेट करू शकतात. व्हेन्यूमधून अभ्यागतांना सक्रियपणे मार्गदर्शन करण्यासाठी Wayfinding सोल्यूशन्स एकत्रित करून ही क्षमता आणखी वाढविली जाऊ शकते.
ट्रबलशूटिंग आणि जोखीम निवारण
हीटमॅप ॲनालिटिक्स तैनात करताना, IT टीम्सना अनेक तांत्रिक आणि अनुपालन आव्हानांचा सामना करावा लागतो.
MAC ॲड्रेस रँडमायझेशन
आधुनिक मोबाइल ऑपरेटिंग सिस्टीम्स (iOS आणि Android) वापरकर्त्याच्या गोपनीयतेचे रक्षण करण्यासाठी MAC ॲड्रेस रँडमायझेशन वापरतात. नेटवर्कसाठी प्रोबिंग करताना हे वैशिष्ट्य वेळोवेळी डिव्हाइसचा MAC ॲड्रेस बदलते, ज्यामुळे केवळ पॅसिव्ह प्रोब्स वापरून कालांतराने एकाच डिव्हाइसचा मागोवा घेणे कठीण होते. हे कमी करण्यासाठी, व्हेन्यूजनी वापरकर्त्यांना Captive Portal द्वारे नेटवर्कवर ऑथेंटिकेट करण्यासाठी प्रोत्साहित केले पाहिजे. एकदा ऑथेंटिकेट झाल्यानंतर, डिव्हाइसला कायमस्वरूपी वापरकर्ता प्रोफाइलशी जोडले जाऊ शकते, जे गोपनीयता नियमांचे पालन करताना विश्वसनीय ॲनालिटिक्स डेटा प्रदान करते. ऑथेंटिकेशन दर सुधारण्याच्या धोरणांसाठी, A/B Testing Captive Portal Designs for Higher Sign-Up Conversion चे पुनरावलोकन करा.
डेटा गोपनीयता आणि GDPR अनुपालन
लोकेशन डेटा गोळा केल्याने गोपनीयतेवर महत्त्वपूर्ण परिणाम होतात. व्हेन्यूजनी GDPR आणि CCPA सारख्या नियमांचे अनुपालन सुनिश्चित केले पाहिजे. सर्वोत्तम पद्धतींमध्ये डीफॉल्टनुसार डेटा अनामित (anonymise) करणे आणि एकत्रित करणे, Captive Portal अटी आणि शर्तींमध्ये डेटा वापर धोरणे स्पष्टपणे संप्रेषित करणे आणि वापरकर्त्यांसाठी एक सोपी ऑप्ट-आउट यंत्रणा प्रदान करणे समाविष्ट आहे. स्पष्ट संमतीशिवाय वैयक्तिक वापरकर्त्यांचा मागोवा न घेता, मॅक्रो ट्रेंड आणि प्रवाहाचे नमुने समजून घेण्यावर नेहमी लक्ष केंद्रित केले पाहिजे.
ROI आणि व्यावसायिक प्रभाव
हीटमॅप डिप्लॉयमेंटचा ROI स्वतः नकाशेद्वारे मोजला जात नाही, तर ते सक्षम करत असलेल्या ऑपरेशनल निर्णयांद्वारे मोजला जातो. अनुभवजन्य डेटासह किस्सात्मक गृहितके (anecdotal assumptions) बदलून, व्हेन्यूज जागेचा वापर, कर्मचाऱ्यांची कार्यक्षमता आणि महसूल निर्मितीमध्ये मोजता येण्याजोग्या सुधारणा साध्य करू शकतात.
रिटेल वातावरणात, डेटा-आधारित लेआउट बदलानंतर प्रति चौरस फूट विक्रीतील वाढ किंवा रूपांतरण दरांमधील सुधारणांद्वारे यश मोजले जाते. हॉस्पिटॅलिटी आणि इव्हेंट्समध्ये, मुख्य मेट्रिक्समध्ये रांगेतील वेळ कमी करणे, अन्न आणि पेये कॅप्चर दर वाढवणे आणि अतिथी समाधान स्कोअर सुधारणे समाविष्ट आहे. शेवटी, हीटमॅप विश्लेषण भौतिक व्हेन्यूला मोजता येण्याजोग्या, ऑप्टिमाइझ करण्यायोग्य मालमत्तेत रूपांतरित करते, जे सतत सुधारणा आणि ऑपरेशनल उत्कृष्टता चालविण्यासाठी आवश्यक बुद्धिमत्ता प्रदान करते. आधुनिक नेटवर्क फायद्यांच्या व्यापक दृष्टीकोनासाठी, The Core SD WAN Benefits for Modern Businesses वाचा.
महत्वाच्या व्याख्या
रिसीव्ह्ड सिग्नल स्ट्रेंथ इंडिकेटर (RSSI)
प्राप्त झालेल्या रेडिओ सिग्नलमध्ये उपस्थित असलेल्या शक्तीचे मोजमाप. हीटमॅप ॲनालिटिक्समध्ये, RSSI चा वापर डिव्हाइस आणि ॲक्सेस पॉइंटमधील अंतराचा अंदाज घेण्यासाठी केला जातो.
IT टीम्स झोन सीमा परिभाषित करण्यासाठी आणि व्हेन्यूच्या बाहेरील डिव्हाइसेस फिल्टर करण्यासाठी RSSI थ्रेशोल्ड वापरतात.
MAC ॲड्रेस रँडमायझेशन
आधुनिक ऑपरेटिंग सिस्टीम्समधील एक गोपनीयता वैशिष्ट्य जे नेटवर्कसाठी प्रोबिंग करताना वेळोवेळी डिव्हाइसचा MAC ॲड्रेस बदलते, दीर्घकालीन पॅसिव्ह ट्रॅकिंग प्रतिबंधित करते.
अचूक, कायमस्वरूपी ॲनालिटिक्स डेटा राखण्यासाठी या वैशिष्ट्यामुळे व्हेन्यूजनी सक्रिय नेटवर्क ऑथेंटिकेशनला (Captive Portal द्वारे) प्रोत्साहन देणे आवश्यक आहे.
लोकेशन जिटर
एक विसंगती जिथे डिव्हाइस हीटमॅपवरील लगतच्या झोनमध्ये वेगाने उसळताना दिसते, जे सहसा खराब AP प्लेसमेंट किंवा अपुऱ्या सिग्नल घनतेमुळे होते.
जिटर टाळण्यासाठी आणि कृती करण्यायोग्य डेटा सुनिश्चित करण्यासाठी नेटवर्क आर्किटेक्ट्सनी स्टॅगर्ड AP लेआउट्स डिझाइन केले पाहिजेत.
प्रोब रिक्वेस्ट
क्लायंट डिव्हाइसद्वारे (उदा., स्मार्टफोन) त्याच्या आसपास उपलब्ध WiFi नेटवर्क शोधण्यासाठी पाठविलेली फ्रेम.
डिव्हाइस नेटवर्कशी कनेक्ट नसले तरीही, डिव्हाइसची उपस्थिती शोधण्यासाठी ॲनालिटिक्स इंजिन्स या प्रोब्स ऐकतात.
त्रिकोणीकरण (Triangulation)
एकाच वेळी किमान तीन वेगवेगळ्या ॲक्सेस पॉइंट्सवरून RSSI मोजून डिव्हाइसचे स्थान निश्चित करण्याची प्रक्रिया.
ही मूलभूत यंत्रणा आहे जी कच्च्या WiFi सिग्नल डेटाला व्हिज्युअल हीटमॅपमध्ये अनुवादित करण्यास अनुमती देते.
ड्वेल टाईम (Dwell Time)
एखादे डिव्हाइस विशिष्ट परिभाषित झोनमध्ये सतत जितका वेळ राहते तो वेळ.
ऑपरेशन्स टीम्स ट्रान्झिएंट ट्रॅफिक (चालत जाणारे) आणि एंगेज्ड ट्रॅफिक (डिस्प्ले ब्राउझ करणे किंवा रांगेत वाट पाहणे) यांच्यात फरक करण्यासाठी ड्वेल टाईम वापरतात.
सिमेंटिक टॅगिंग
डिजिटल फ्लोअर प्लॅनवरील भौतिक झोनला तार्किक, व्यवसायाशी संबंधित लेबले (उदा., 'मेन्सवेअर', 'फूड कोर्ट') नियुक्त करण्याची प्रथा.
हे ॲनालिटिक्स प्लॅटफॉर्म्सना एकाधिक व्हेन्यूजमधील डेटा एकत्रित करण्यास आणि व्यावसायिक भागधारकांना समजतील असे अहवाल तयार करण्यास अनुमती देते.
एज ब्लीडिंग
जेव्हा भौतिक व्हेन्यूच्या बाहेर (उदा., रस्त्यावर) असलेली डिव्हाइसेस चुकून कॅप्चर केली जातात आणि व्हेन्यूच्या ॲनालिटिक्स डेटामध्ये मॅप केली जातात.
हा गोंगाट फिल्टर करण्यासाठी आणि हीटमॅप केवळ खऱ्या व्हेन्यू ट्रॅफिकला प्रतिबिंबित करतो हे सुनिश्चित करण्यासाठी IT टीम्सनी RSSI सीमा काळजीपूर्वक कॅलिब्रेट केल्या पाहिजेत.
सोडवलेली उदाहरणे
एका 200-खोल्यांच्या बिझनेस हॉटेलमध्ये सकाळच्या चेकआउट दरम्यान (सकाळी 8:00 - 10:00) मुख्य लॉबीमध्ये गर्दी होत आहे. ऑपरेशन्स डायरेक्टर प्रवाह समजून घेण्यासाठी WiFi ॲनालिटिक्स वापरू इच्छितात आणि गमावलेला F&B महसूल मिळवण्यासाठी मोबाइल कॉफी कार्ट तैनात करू इच्छितात. याला समर्थन देण्यासाठी IT टीमने हीटमॅप झोन आणि ॲनालिटिक्स कसे कॉन्फिगर करावे?
- झोन व्याख्या: IT टीमने लॉबी क्षेत्रामध्ये 'रिसेप्शन डेस्क', 'मुख्य प्रवेशद्वार', 'लाउंज सिटिंग' आणि 'एलि्हेटर बँक' वेगळे करून ग्रॅन्युलर झोन परिभाषित केले पाहिजेत.
- ड्वेल टाईम कॅलिब्रेशन: लॉबीमध्ये खरोखर वाट पाहत असलेल्या अतिथींना आणि फक्त चालत जाणाऱ्यांना वेगळे करण्यासाठी ट्रान्झिएंट ट्रॅफिक (ड्वेल टाईम < 2 मिनिटे) फिल्टर करण्यासाठी ॲनालिटिक्स इंजिन कॉन्फिगर करा.
- हीटमॅप जनरेशन: अतिथी वाट पाहत असताना कुठे एकत्र येतात ते सातत्यपूर्ण 'हॉट झोन' ओळखण्यासाठी दोन आठवड्यांच्या कालावधीत विशेषतः सकाळी 8:00 - 10:00 च्या विंडोसाठी टाइम-लॅप्स हीटमॅप तयार करा.
- डिप्लॉयमेंट: डेटाच्या आधारे, मोबाइल कॉफी कार्ट सर्वात हॉट झोनच्या शेजारी (उदा. लाउंज सिटिंगजवळ) ठेवा परंतु अडथळा वाढू नये म्हणून मुख्य प्रवेशद्वाराच्या थेट प्रवाहाच्या मार्गाबाहेर ठेवा.
एक मोठी रिटेल चेन त्यांच्या फ्लॅगशिप स्टोअर लेआउटची पुनर्रचना करत आहे. व्हिज्युअल मर्चेंडायझिंग टीमला 'डेड झोन' ओळखायचे आहेत जिथे सध्या उच्च-मार्जिन उत्पादने ठेवली आहेत परंतु त्यांना कमी फूटफॉल मिळत आहे. या विश्लेषणासाठी WiFi इन्फ्रास्ट्रक्चर अचूक डेटा देऊ शकेल याची खात्री नेटवर्क आर्किटेक्टने कशी करावी?
- AP प्लेसमेंट ऑडिट: आर्किटेक्टने विद्यमान AP डिप्लॉयमेंटचे पुनरावलोकन केले पाहिजे. जर APs मुख्य आयल्समध्ये सरळ रेषेत तैनात केले असतील, तर अचूक त्रिकोणीकरण सक्षम करण्यासाठी त्यांना स्टॅगर्ड ग्रिड पॅटर्नमध्ये पुनर्स्थित केले पाहिजे.
- घनता तपासणी: रिटेल फ्लोअरवरील प्रत्येक बिंदू किमान तीन APs ला -65 dBm किंवा त्याहून अधिक चांगल्या प्रकारे दृश्यमान असल्याची खात्री करा.
- बाउंड्री फिल्टरिंग: हीटमॅप केवळ स्टोअरमधील वास्तविक रहदारी प्रतिबिंबित करतो हे सुनिश्चित करण्यासाठी रस्त्यावरून किंवा लगतच्या स्टोअरमधून प्रोबिंग करणाऱ्या डिव्हाइसेसना फिल्टर करण्यासाठी RSSI थ्रेशोल्ड कॉन्फिगर करा.
- इंटिग्रेशन: हीटमॅप डेटा API द्वारे एक्सपोर्ट करा जेणेकरून तो स्टोअरच्या प्लॅनोग्राम सॉफ्टवेअरवर ओव्हरले करता येईल, ज्यामुळे मर्चेंडायझर्सना विशिष्ट उत्पादन डिस्प्लेसह फूटफॉलचा सहसंबंध जोडता येईल.
सराव प्रश्न
Q1. तुम्ही एका लांब, अरुंद रिटेल कॉरिडॉरमध्ये हीटमॅप सोल्यूशन तैनात करत आहात. प्रारंभिक डिझाइनमध्ये छताच्या मध्यभागी एका सरळ रेषेत तीन ॲक्सेस पॉइंट्स ठेवले आहेत. या डिझाइनचा प्राथमिक धोका काय आहे आणि तो कसा दुरुस्त केला पाहिजे?
टीप: ॲनालिटिक्स इंजिन एकाधिक कोनातून सिग्नल स्ट्रेंथच्या आधारे डिव्हाइसच्या स्थानाची गणना कशी करते याचा विचार करा.
नमुना उत्तर पहा
प्राथमिक धोका 'लोकेशन जिटर' किंवा Y-अक्षावर (कॉरिडॉरची रुंदी) डिव्हाइसच्या स्थानाचे अचूक त्रिकोणीकरण करण्यात पूर्ण असमर्थता हा आहे. कारण APs एका सरळ रेषेत आहेत, ॲनालिटिक्स इंजिन हे ठरवू शकत नाही की डिव्हाइस कॉरिडॉरच्या डाव्या बाजूला आहे की उजव्या बाजूला, फक्त लांबीच्या बाजूने त्याचे स्थान ठरवू शकते. हे दुरुस्त करण्यासाठी, अचूक त्रिकोणीकरणासाठी आवश्यक कोन प्रदान करण्यासाठी APs झिग-झॅग पॅटर्नमध्ये (उदा., एक डाव्या भिंतीवर, पुढचा उजव्या भिंतीवर, पुढचा डावीकडे) स्टॅगर्ड केले पाहिजेत.
Q2. स्टेडियम ऑपरेशन्स डायरेक्टर अहवाल देतात की मुख्य कॉनकोर्सचा हीटमॅप पहाटे 3:00 वाजता 'फूड कोर्ट' झोनमध्ये लक्षणीय रहदारी दर्शवत आहे, जेव्हा व्हेन्यू बंद असतो. या विसंगतीचे सर्वात संभाव्य कारण काय आहे आणि कोणता कॉन्फिगरेशन बदल आवश्यक आहे?
टीप: स्टेडियमच्या भिंतीबाहेर भौतिकदृष्ट्या काय आहे आणि RF सिग्नल्स कसे प्रवास करतात याचा विचार करा.
नमुना उत्तर पहा
सर्वात संभाव्य कारण 'एज ब्लीडिंग' आहे—स्टेडियमच्या आतील APs व्हेन्यूच्या बाहेरील डिव्हाइसेसकडून प्रोब विनंत्या शोधत आहेत, जसे की जाणाऱ्या गाड्या किंवा लगतच्या रस्त्यावरील पादचारी. याचे निराकरण करण्यासाठी, IT टीमला बाउंड्री फिल्टरिंग कॅलिब्रेट करणे आवश्यक आहे. यामध्ये बाहेरील भिंतींजवळील APs साठी RSSI थ्रेशोल्ड समायोजित करणे समाविष्ट आहे जेणेकरून ते विशिष्ट स्तरापेक्षा कमकुवत सिग्नल्सकडे दुर्लक्ष करतील (उदा., -75 dBm पेक्षा कमकुवत सिग्नल्सकडे दुर्लक्ष करणे), प्रभावीपणे कव्हरेज क्षेत्र कॉनकोर्सच्या भौतिक सीमांपर्यंत ट्रिम करणे.
Q3. एका रिटेल क्लायंटला केवळ पॅसिव्ह WiFi हीटमॅप्स (कोणतेही Captive Portal ऑथेंटिकेशन नाही) वापरून सहा महिन्यांच्या कालावधीत एकाधिक स्टोअर भेटींमध्ये वैयक्तिक, परत येणाऱ्या ग्राहकांच्या अचूक मार्गाचा मागोवा घ्यायचा आहे. हे तांत्रिकदृष्ट्या अशक्य का आहे आणि तुम्ही कोणत्या पर्यायी दृष्टिकोनाची शिफारस कराल?
टीप: आधुनिक मोबाइल ऑपरेटिंग सिस्टीम्सद्वारे लागू केलेल्या गोपनीयता वैशिष्ट्यांचा विचार करा.
नमुना उत्तर पहा
MAC ॲड्रेस रँडमायझेशनमुळे हे अशक्य आहे. आधुनिक iOS आणि Android डिव्हाइसेस दीर्घकालीन ट्रॅकिंग टाळण्यासाठी पॅसिव्ह प्रोब विनंत्या पाठवताना वेळोवेळी त्यांचे MAC ॲड्रेस बदलतात. त्यामुळे, ॲनालिटिक्स इंजिनला तोच परत येणारा ग्राहक पुढील भेटींमध्ये एक नवीन, अद्वितीय डिव्हाइस म्हणून दिसेल. शिफारस केलेला पर्याय म्हणजे Guest WiFi Captive Portal तैनात करणे जे मूल्य विनिमय (उदा., मोफत WiFi, डिस्काउंट कोड) ऑफर करते. एकदा वापरकर्त्याने ऑथेंटिकेट केले की, त्यांचे डिव्हाइस कायमस्वरूपी प्रोफाइलशी जोडले जाऊ शकते, स्पष्ट वापरकर्ता संमती आणि GDPR अनुपालन सुनिश्चित करताना अचूक दीर्घकालीन ट्रॅकिंगला अनुमती देते.
या मालिकेमध्ये पुढे वाचा
डिझाइननुसार गोपनीयता: GDPR अनुपालनासाठी WiFi डेटा अनामिक करणे
हे अधिकृत मार्गदर्शक GDPR अनुपालन सुनिश्चित करण्यासाठी WiFi डेटा अनामिक करण्याच्या तांत्रिक रचना आणि अंमलबजावणी धोरणांचे तपशीलवार वर्णन करते. हे IT नेते आणि नेटवर्क आर्किटेक्टना कठोर डेटा गोपनीयता आवश्यकतांसह मजबूत ठिकाण विश्लेषणाचे संतुलन साधण्यासाठी कृतीयोग्य फ्रेमवर्क प्रदान करते.
Heatmapping विरुद्ध Presence Analytics: तांत्रिक फरक
हे अधिकृत तांत्रिक मार्गदर्शक एंटरप्राइझ स्थळ चालकांसाठी WiFi heatmapping आणि presence analytics मधील महत्त्वाचे आर्किटेक्चरल आणि ऑपरेशनल फरक तपशीलवार स्पष्ट करते. हे IT नेते, नेटवर्क आर्किटेक्ट आणि ऑपरेशन्स डायरेक्टर्सना कार्यक्षम अंमलबजावणी फ्रेमवर्क, वास्तविक-जगातील अंमलबजावणी परिस्थिती आणि त्यांच्या सध्याच्या वायरलेस इन्फ्रास्ट्रक्चरमधून जास्तीत जास्त ROI मिळवण्यासाठी विक्रेता-निरपेक्ष सर्वोत्तम पद्धती प्रदान करते.
WiFi लोकेशन ॲनालिटिक्स वापरून ड्वेल टाइम कसा मोजावा
हे मार्गदर्शक WiFi लोकेशन ॲनालिटिक्स वापरून WiFi ड्वेल टाइम मोजण्यासाठी एक सर्वसमावेशक तांत्रिक संदर्भ प्रदान करते, ज्यामध्ये 802.11 प्रोब रिक्वेस्ट कॅप्चरपासून RSSI-आधारित ट्रायलेटरेशन ते जिओफेन्स्ड झोन ॲनालिसिसपर्यंत संपूर्ण आर्किटेक्चर समाविष्ट आहे. हे IT व्यवस्थापक, नेटवर्क आर्किटेक्ट आणि ठिकाणांच्या ऑपरेशन्स संचालकांसाठी डिझाइन केले आहे ज्यांना रिटेल, हॉस्पिटॅलिटी, हेल्थकेअर आणि सार्वजनिक क्षेत्रातील वातावरणात अचूक, स्केलेबल लोकेशन इंटेलिजन्स तैनात करण्याची आवश्यकता आहे. वाचकांना कृती करण्यायोग्य अंमलबजावणी मार्गदर्शन, वास्तविक-जगातील केस स्टडीज आणि कच्च्या स्थानिक डेटाचे मोजता येण्याजोग्या व्यावसायिक परिणामांमध्ये रूपांतरित करण्यासाठी एक स्पष्ट फ्रेमवर्क मिळेल.