Heatmapping vs Presence Analytics: तांत्रिक फरक
हे अधिकृत तांत्रिक मार्गदर्शक एंटरप्राइझ व्हेन्यू ऑपरेटर्ससाठी WiFi heatmapping आणि presence analytics मधील महत्त्वपूर्ण आर्किटेक्चरल आणि ऑपरेशनल फरक तपशीलवार स्पष्ट करते. हे IT लीडर्स, नेटवर्क आर्किटेक्ट्स आणि ऑपरेशन्स डायरेक्टर्सना त्यांच्या विद्यमान वायरलेस इन्फ्रास्ट्रक्चरमधून जास्तीत जास्त ROI मिळवण्यासाठी प्रत्यक्ष अंमलबजावणीचे आराखडे, वास्तविक-जगातील अंमलबजावणीची उदाहरणे आणि वेंडर-तटस्थ सर्वोत्तम पद्धती प्रदान करते.
हे मार्गदर्शक ऐका
पॉडकास्ट ट्रान्सक्रिप्ट पहा
執行摘要
對於管理複雜實體場域的企業 IT 團隊而言,理解 WiFi 熱圖(heatmapping)與存在分析(presence analytics)之間的區別已不再是可有可無的選項。雖然這兩者在行銷文獻中經常被混為一談,但它們在根本上是服務於不同營運任務的截然不同的技術。
WiFi 熱圖是一種以基礎設施為中心的診斷工具,旨在測量射頻(RF)訊號傳播、識別覆蓋盲點並優化存取點(AP)的配置。存在分析則是一個商業智慧層,它利用相同的網路基礎設施來追蹤裝置移動、計算停留時間,並繪製訪客在實體空間中的行為軌跡。
本指南對這兩種方法進行了嚴謹的技術比較。我們將探討在零售、旅宿和大型公共環境中有效部署這些系統所需的底層架構、數據收集方法和實作框架。透過將這些功能對接至 Purple 的 Guest WiFi 和 WiFi Analytics 平台,我們為您提供了一套藍圖,幫助您從現有的網路硬體中榨取最大的投資報酬率(ROI)——而無需對實體基礎設施進行全面汰換。
技術深挖:架構與方法論
WiFi 熱圖:RF 診斷層
WiFi 熱圖的核心是依賴接收訊號強度指示(RSSI)測量值來構建網路覆蓋範圍的視覺化呈現。此過程對於網路規劃、故障排除和持續的效能驗證至關重要。
數據收集機制分為三類。主動調查(Active surveys)涉及裝置主動與 AP 關聯,以測量吞吐量、封包遺失率和延遲以及 RSSI——從用戶端視角提供網路效能視圖。被動調查(Passive surveys)使用掃描器在不關聯的情況下監聽所有頻道上的信標訊框(beacon frames)和探測回應(probe responses),提供包括同頻干擾和惡意 AP 檢測在內的整體 RF 環境視圖。預測建模(Predictive modelling)則在實際部署前,利用軟體根據平面圖、牆壁衰減值和 AP 天線圖形來模擬覆蓋範圍,實現部署前的驗證。
關鍵技術指標包括訊噪比(SNR),這對於確定特定區域內可實現的實際數據傳輸速率至關重要,且比單純的 RSSI 原始值更能可靠地反映品質。頻道重疊識別(Channel overlap identification)則能揭示相鄰 AP 在重疊頻率上運作的區域,這種情況會導致破壞性干擾,即使在訊號強度看似充足的情況下也會降低吞吐量。
存在分析:行為智慧層
存在分析將焦點從網路基礎設施轉移到穿梭其中的裝置上。它主要依賴擷取探測請求(probe requests)——智慧型手機和平板電腦在搜尋已知網路時發射的管理訊框——以便在不需要未關聯裝置進行連線的情況下對其進行追蹤。
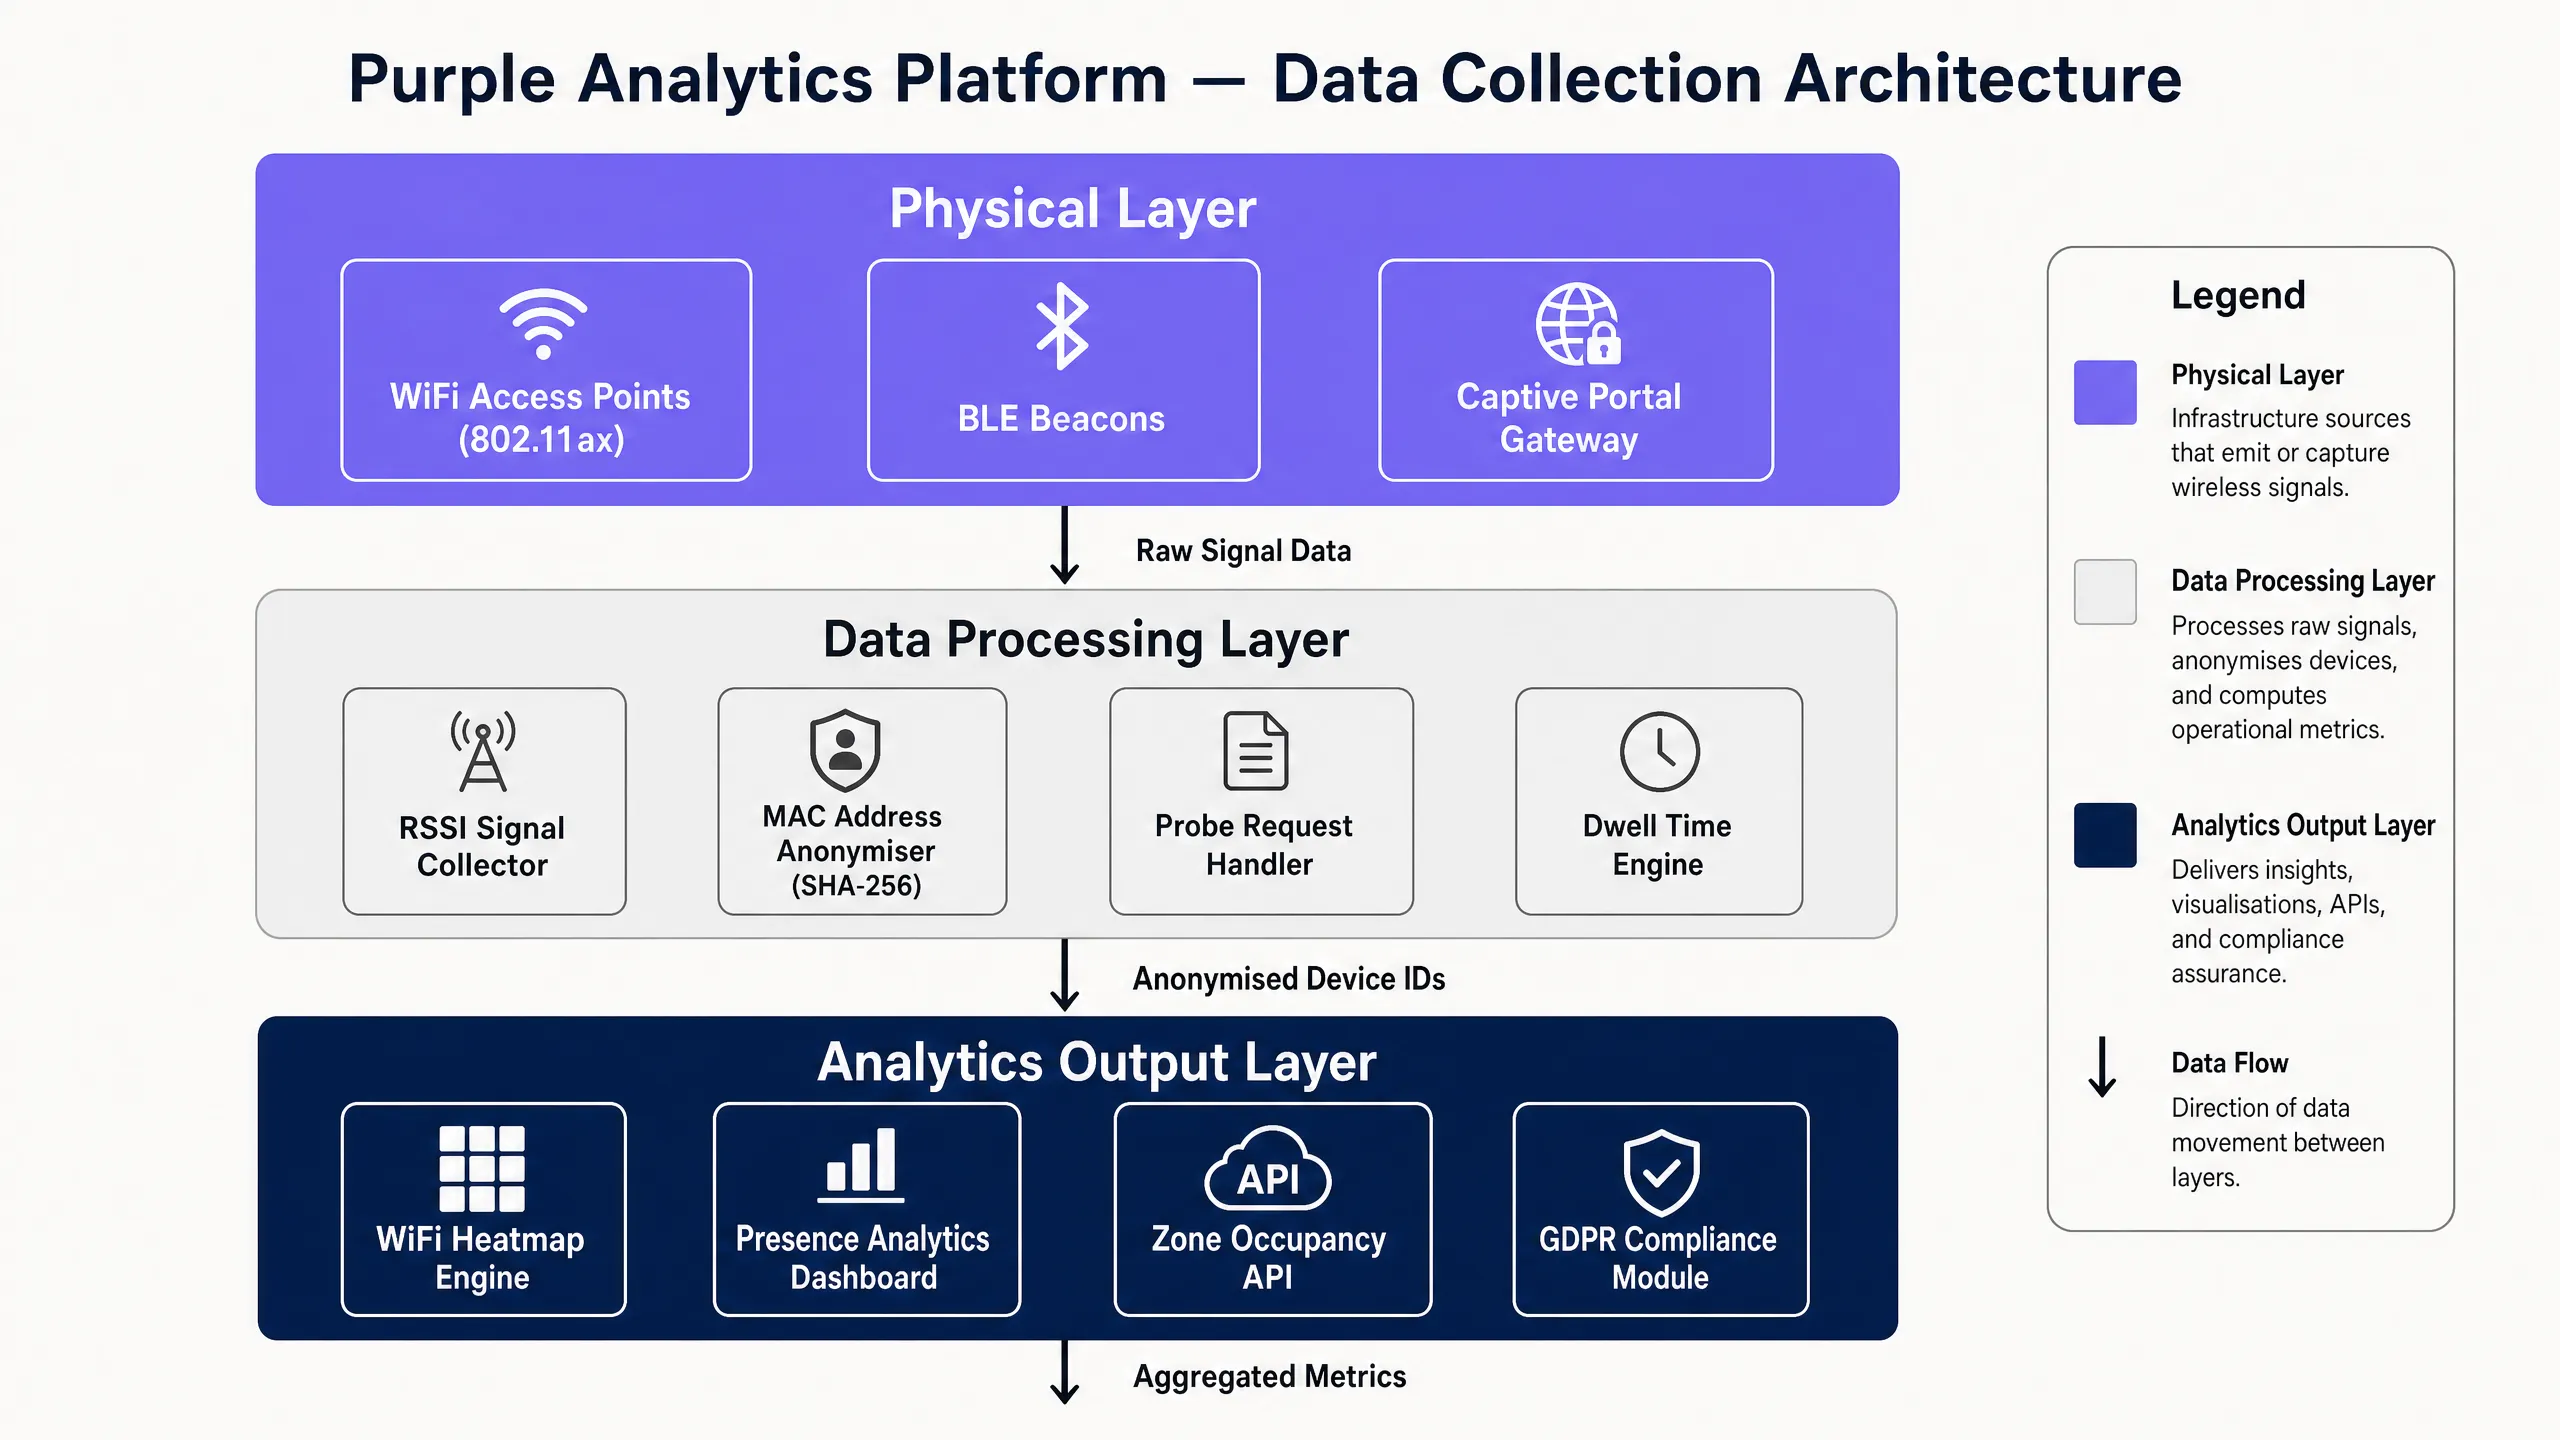
數據收集架構分為三個階段。首先,AP 或專用感測器攔截包含裝置 MAC 位址和訊號強度的未關聯探測請求。其次,為了符合包括 GDPR 和 CCPA 在內的隱私框架,MAC 位址在傳輸到分析引擎之前,會立即在邊緣端進行雜湊處理(使用 SHA-256 或同等演算法)——確保沒有任何個人識別資訊(PII)以原始格式跨網路傳輸。第三,三邊測量(trilateration)引擎比較單一裝置在三個或更多 AP 上的 RSSI,以計算該裝置的大致 X/Y 座標。欲深入瞭解此機制,請參閱我們的指南: WiFi 定位機制解析:三邊測量與 RSSI 詳解 。
關鍵區別:覆蓋範圍 vs. 情境資訊
企業部署中最常見的誤解是,認為提供充足覆蓋範圍的網路就自動做好了進行存在分析的準備。這是錯誤的。覆蓋範圍僅要求裝置能從一個 AP 接收到可用訊號。而用於存在分析的精確三邊測量,則要求裝置必須同時被至少三個 AP 偵測到,且訊號強度需達到 -75 dBm 或更佳。這種根本性的差異導致了完全不同的 AP 密度和配置需求。
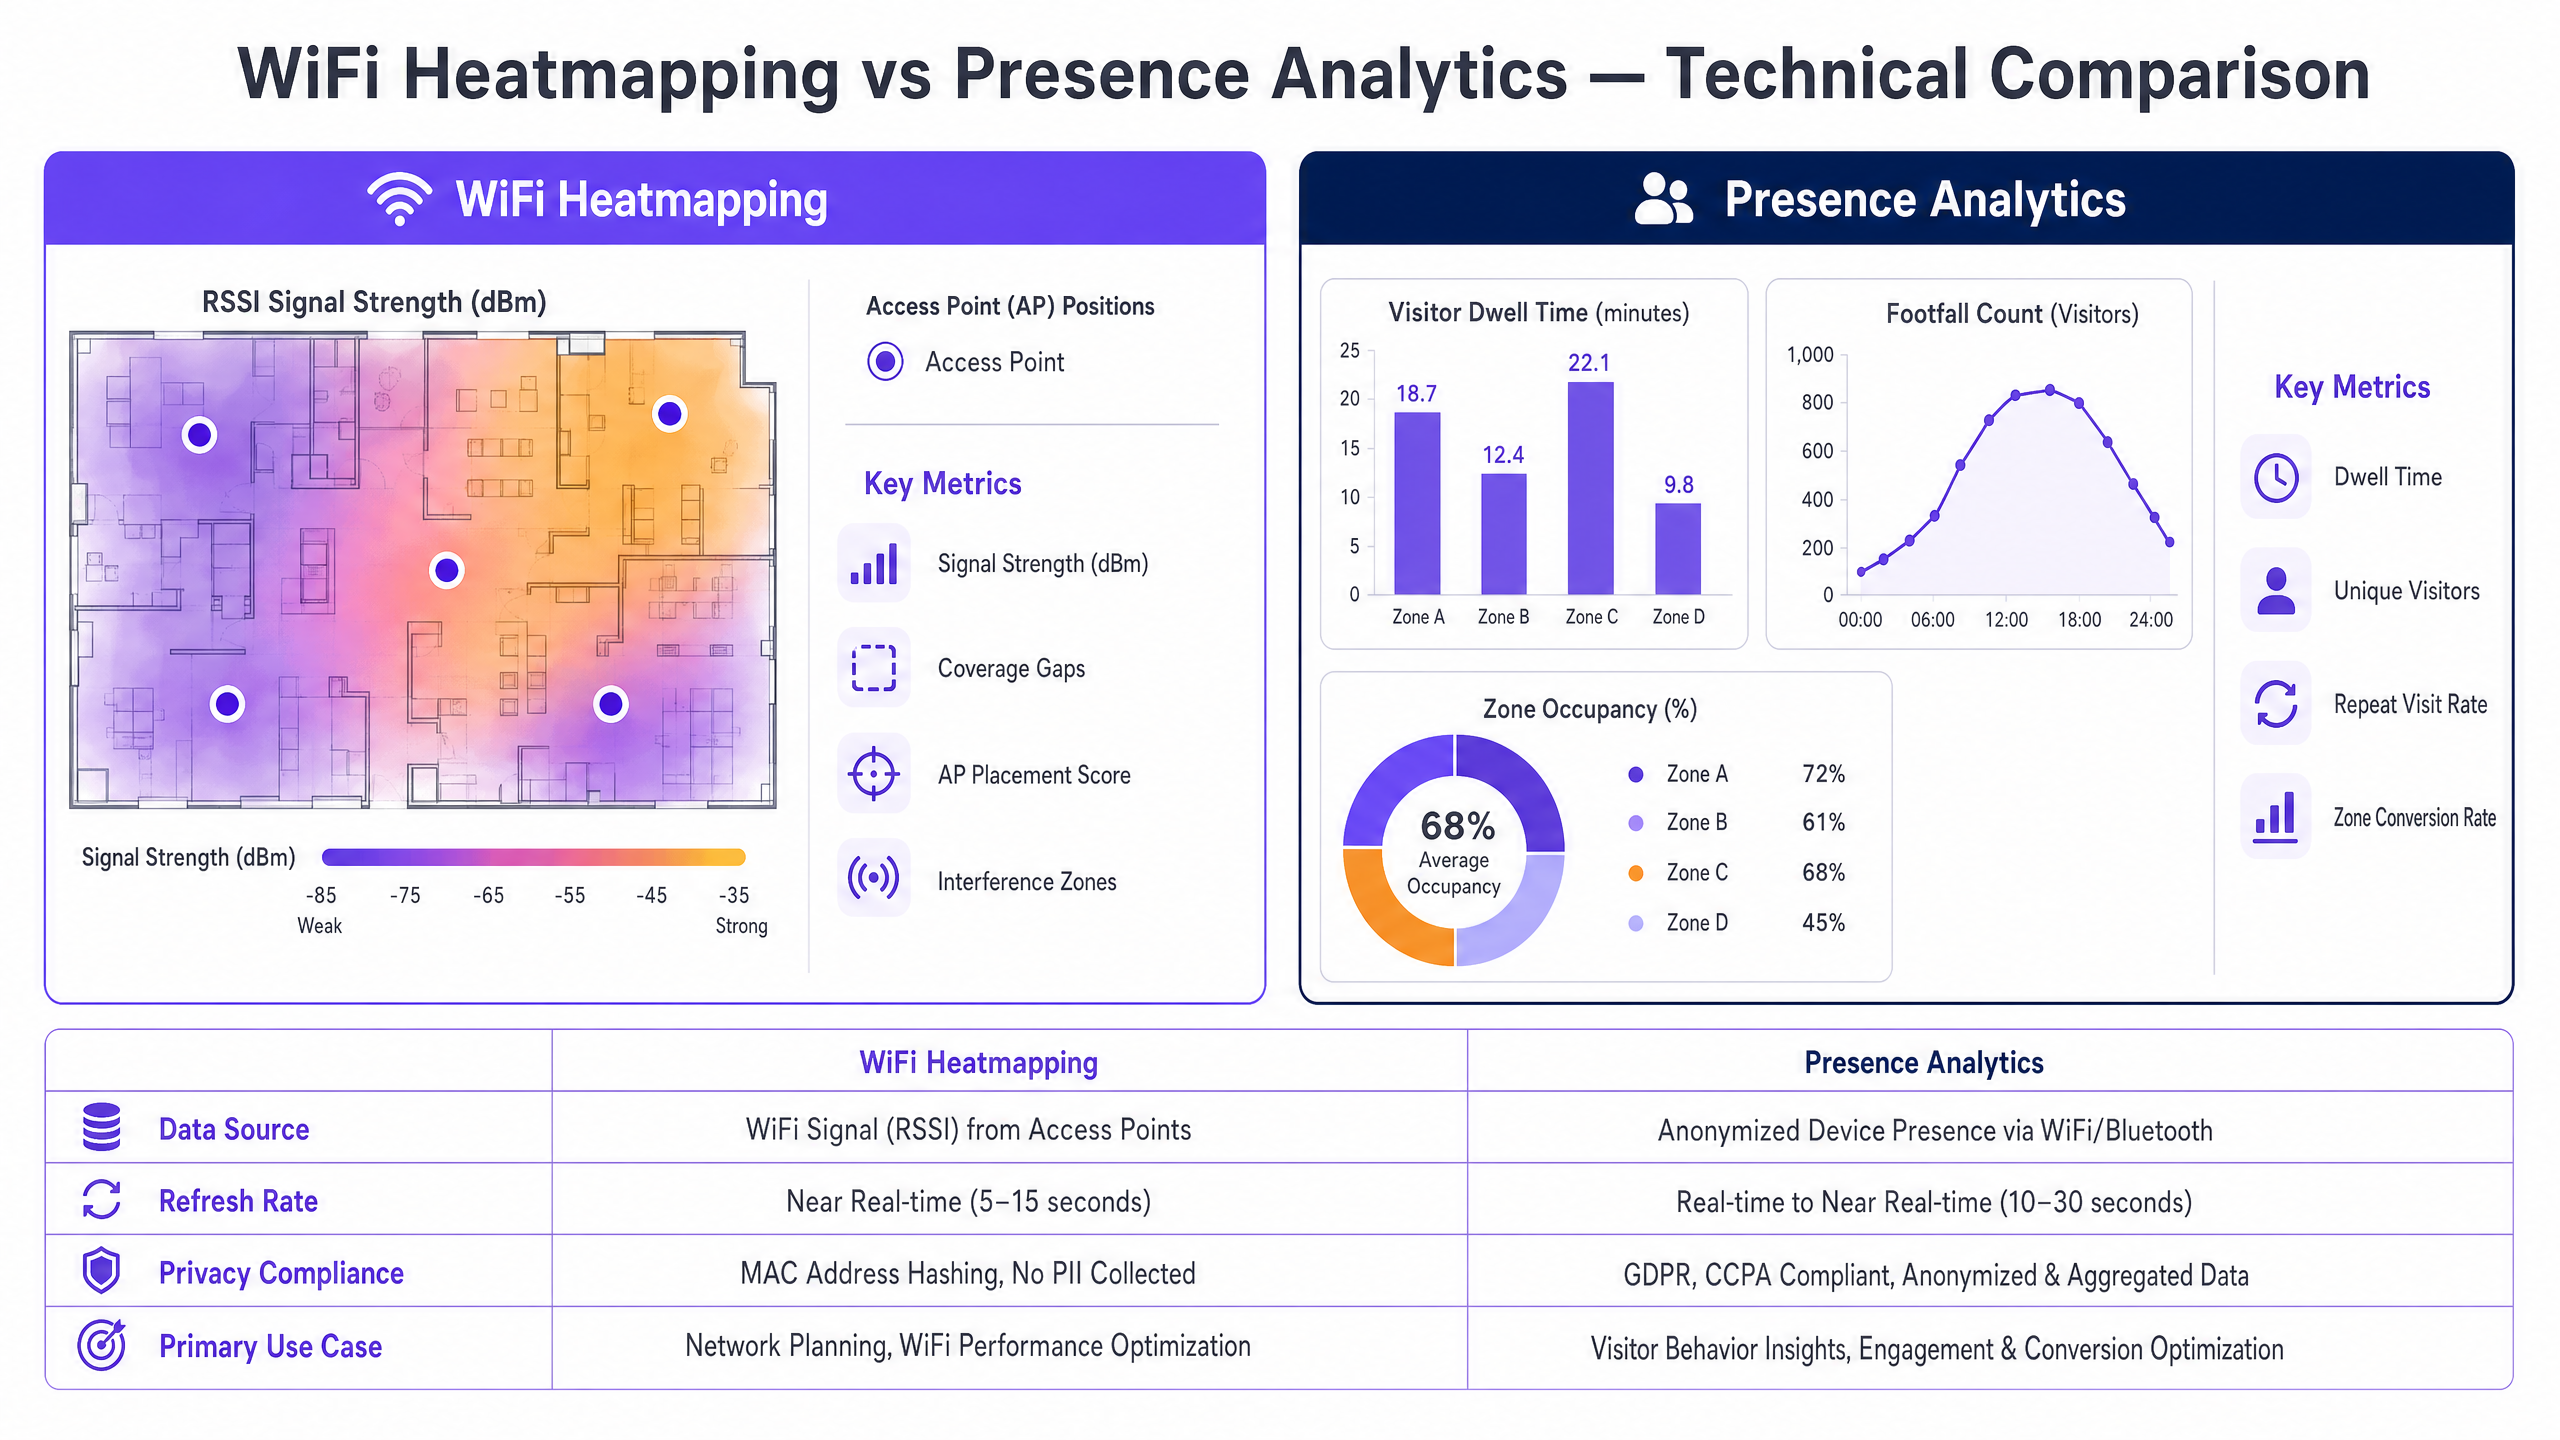
| 維度 | WiFi 熱圖 | 存在分析 |
|---|---|---|
| 主要數據源 | 來自 AP 信標的 RSSI | 來自用戶端裝置的探測請求 |
| 基礎設施需求 | 標準覆蓋密度 | 高密度(每個區域 ≥3 個 AP) |
| 數據更新率 | 接近即時(5–15 秒調查) | 即時(10–30 秒更新) |
| 隱私合規性 | 不收集 PII | 透過 MAC 雜湊符合 GDPR/CCPA |
| 主要應用場景 | 網路規劃與優化 | 訪客行為與商業智慧 |
| 關鍵輸出指標 | 訊號強度 (dBm), SNR | 停留時間、客流量、區域轉換率 |
實作指南:策略性部署
部署這些技術需要採取分階段的方法,平衡技術限制與業務目標。試圖在未針對存在分析設計的網路上部署該技術,是專案失敗最常見的單一原因。re。
階段 1:透過熱圖進行基礎設施評估。 在實施存在感分析之前,必須先驗證底層網路。進行全面的被動熱圖調查,以建立基準 RF 效能。識別訊號覆蓋盲區、同頻干擾區域以及高多路徑干擾區域(這在設有金屬貨架的零售環境中很常見)。此調查數據將直接為階段 2 所需的 AP 密度與部署位置決策提供依據。
階段 2:針對三邊測量進行網路重新設計。 根據熱圖數據,以存在感分析為考量重新設計 AP 的部署位置。將 AP 移至場域的周邊,而不是走廊中央——這能將三邊測量計算向外拉,並顯著提高空間精確度。確保每個目標區域都至少有三個 AP 覆蓋,且訊號強度達到 -72 dBm 或更高。在高干擾環境(如倉庫、具有金屬結構的體育場)中,可使用 BLE (Bluetooth Low Energy) 信標來輔助 WiFi 三邊測量,將空間解析度提升至 1-2 公尺。
階段 3:平台整合。 將分析引擎與您現有的硬體整合。Purple 的硬體相容平台透過標準 API 連接到包括 Cisco、Aruba、Ruckus 和 Meraki 在內的主要廠商——提取匿名化的存在感數據,而無需專有的覆蓋感測器或完整的硬體更換週期。
階段 4:區域配置與校準。 在分析平台內定義邏輯區域,以對應到實體業務區域(例如:「結帳區」、「大廳」、「女裝區」、「入口漏斗」)。將這些區域與熱圖階段中識別的實體 AP 覆蓋模式對齊。在正式上線前,進行校準測試以驗證區域邊界是否精確。
企業環境的最佳實踐
持續校準是不可妥協的。 RF 環境是動態變化的。零售業的庫存量、活動中的臨時結構,甚至人體都會吸收 RF 訊號。定期每季安排被動熱圖調查,以確保存在感分析引擎在精確的基準數據上運作。零售環境中季節性的賣場陳設調整,可能會在一夜之間使數個月的校準數據失效。
主動應對 MAC 隨機化。 現代作業系統(iOS 14+、Android 10+)會輪替 MAC 地址以防止被動追蹤。先進的分析平台必須採用啟發式演算法(分析訊號模式和探測時間)來拼接碎片的連線階段,以確保在 MAC 輪替的情況下仍能精確計算停留時間。然而,最有效的緩解措施是透過 Captive Portal 鼓勵裝置進行關聯。正如在 How a wi fi assistant Enables Passwordless Access in 2026 中所討論的,現代驗證方法可在登入時將匿名的 MAC 地址無縫轉換為已知的 CRM 個人檔案,從而提供確定性而非機率性的追蹤。
實施角色型數據存取。 存在感分析數據即使在裝置層級進行了匿名化,也可能透露敏感的營運模式。實施與 IEEE 802.1X 驗證標準一致的角色型存取控制 (RBAC),以確保只有授權人員才能存取原始分析數據,同時將彙整的儀表板提供給營運團隊。
將區域定義與業務 KPI 對齊。 區域配置的細緻度應直接反映您的業務問題。如果您需要衡量特定端架陳列的轉換影響,請在該細緻度層級定義一個區域。如果您只需要了解部門之間的大致人流量,較粗略的區域可以減少計算開銷並簡化報表。
疑難排解與風險緩解
故障模式:定位數據不精確(裝置跳躍)
症狀: 在分析儀表板中,裝置似乎在區域之間傳送,其移動路徑在物理上是不可能的。
根本原因: AP 密度不足或多路徑干擾——訊號從金屬表面反射,產生虛假的訊號讀數,導致三邊測量引擎混淆。
緩解措施: 重新進行熱圖調查,重點關注 SNR(信噪比)而非僅僅是 RSSI。某個區域可能顯示出足夠的訊號強度,但由於反射訊號而導致 SNR 較差。考慮在高干擾區域部署 BLE 信標,以更可靠的短距離訊號來增強 WiFi 定位數據。
故障模式:入口處停留時間異常偏高
症狀: 分析儀表板顯示場域入口附近的訪客計數和停留時間異常偏高,使整體客流量指標虛高。
根本原因: 入口附近的 AP 正在擷取來自場域邊界外街道或停車場裝置的探測請求。
緩解措施: 調整分析平台中的 RSSI 閾值。排除 RSSI 弱於 -80 dBm 的裝置數據,以過濾掉外部流量。此外,定義一個專門的「入口緩衝」區域,並將其排除在轉換率計算之外。
故障模式:MAC 隨機化導致連線階段碎片化
症狀: 不重複訪客計數顯著高於預期,且平均停留時間異常短暫。
根本原因: iOS 和 Android 的 MAC 隨機化正在將單個訪客的連線階段碎片化為多個虛擬裝置。
緩解措施: 部署 Captive Portal 以鼓勵裝置進行關聯。啟用分析平台的連線階段拼接演算法,該演算法利用訊號模式的連續性和時間啟發式方法來重構碎片的連線階段。對於顧客 WiFi 使用率高的 零售 環境,這通常可以解決 70-80% 的碎片化問題。
投資報酬率與業務影響
從基本網路建置到智慧化營運的轉變 收集從根本上改變了 IT 部門在組織內的價值定位。
零售營運代表了最明確的 ROI 案例。藉由將區域停留時間與銷售點(POS)數據進行關聯,IT 可以直接證明網路基礎設施如何對店面佈局優化和提高轉換率做出貢獻。一家擁有 50 家分店的零售商,如果透過 Presence 數據分析引導的佈局調整,使端架停留時間提高 5%,就能產生直接歸因於網路投資的可衡量營收增長。如需特定產業的部署指南,請參閱我們的 Retail 部門解決方案。
旅宿業部署可提供雙重 ROI。熱圖分析可確保整個物業內語音通話(Voice-over-WiFi)的 802.11r 快速 BSS 切換順暢無阻,直接減少顧客投訴。同時,Presence 數據分析可識別利用率低的設施(如 SPA、餐廳、商務中心),從而能透過 Captive Portal 進行精準的場域內行銷。如需更廣泛的顧客體驗策略,請參閱 How To Improve Guest Satisfaction: The Ultimate Playbook 。
公共部門與智慧城市部署正越來越多地利用 Presence 數據分析進行人群管理、交通樞紐優化和資源分配。正如我們在 Purple Appoints Iain Fox as VP Growth – Public Sector to Drive Digital Inclusion and Smart City Innovation 公告中所強調的,強大的數據分析是智慧城市倡議的基石,能為基礎設施投資和服務部署提供數據驅動的決策支援。
醫療保健環境可受益於 Presence 數據分析以優化患者分流,減少急診室和門診診所的瓶頸。結合 Purple 的 Healthcare 平台功能,去識別化的停留數據可以直接為人力配置模型和檢傷分類協定提供資訊,而無需處理任何患者的 PII。
透過將熱圖分析視為基礎診斷,並將 Presence 數據分析視為商業智慧層,IT 領導者可以將其無線網路從成本中心轉變為策略資產,直接為整個組織的商業和營運決策提供支援。
महत्वाच्या व्याख्या
RSSI (Received Signal Strength Indicator)
प्राप्त झालेल्या रेडिओ सिग्नलच्या पॉवर लेव्हलचे मोजमाप, जे सहसा dBm (डेसिबल्स रिलेटिव्ह टू वन मिलिवॉट) मध्ये व्यक्त केले जाते. याची मूल्ये साधारणपणे 0 dBm (सर्वात मजबूत) ते -100 dBm (सर्वात कमकुवत) पर्यंत असतात, ज्यामध्ये -65 dBm किंवा त्याहून अधिक मूल्य एंटरप्राइझ उपयोजनांसाठी उत्कृष्ट मानले जाते.
हीटमॅपिंग (कव्हरेज गुणवत्ता निश्चित करणे) आणि प्रेझेन्स ॲनालिटिक्स (ट्रायलेटरेशनसाठी अंतर मोजणे) या दोन्हीसाठी मूलभूत मेट्रिक. IT टीम्सना सर्वे टूल्स, AP मॅनेजमेंट कन्सोल आणि ॲनालिटिक्स प्लॅटफॉर्ममध्ये RSSI आढळते.
Trilateration
ओव्हरलॅपिंग वर्तुळांच्या भूमितीचा वापर करून, तीन किंवा अधिक ज्ञात संदर्भ बिंदूंपासून (ॲक्सेस पॉइंट्स) अंतर मोजून एखाद्या बिंदूचे स्थान निश्चित करण्याची प्रक्रिया. ही ट्रायअँगुलेशनपेक्षा वेगळी आहे, ज्यामध्ये अंतराऐवजी कोनांचा वापर केला जातो.
फ्लोअर प्लॅनवर डिव्हाइसचे X/Y कोऑर्डिनेट्स मोजण्यासाठी प्रेझेन्स ॲनालिटिक्स इंजिनद्वारे वापरले जाणारे मुख्य अल्गोरिदम. अचूक स्थान अंदाज मिळवण्यासाठी विश्वसनीय RSSI रीडिंग्जसह किमान तीन APs आवश्यक आहेत.
Probe Request
उपलब्ध नेटवर्क्स शोधण्यासाठी वायरलेस क्लायंट डिव्हाइसद्वारे पाठवलेली 802.11 मॅनेजमेंट फ्रेम. प्रोब रिक्वेस्ट सर्व चॅनेलवर ब्रॉडकास्ट केल्या जातात आणि त्यामध्ये डिव्हाइसचा MAC ॲड्रेस आणि काही प्रकरणांमध्ये पूर्वी कनेक्ट केलेल्या नेटवर्क्सचे SSIDs समाविष्ट असतात.
पॅसिव्ह प्रेझेन्स ॲनालिटिक्ससाठी प्राथमिक डेटा स्रोत. डिव्हाइसेस कोणत्याही नेटवर्कशी कनेक्ट नसतानाही प्रोब रिक्वेस्ट पाठवतात, ज्यामुळे ॲनालिटिक्स प्लॅटफॉर्मना असोसिएट न झालेल्या व्हिजिटर्सचा मागोवा घेणे शक्य होते.
MAC Randomisation
आधुनिक ऑपरेटिंग सिस्टीम्स (iOS 14+, Android 10+) मध्ये लागू केलेले एक प्रायव्हसी फीचर, जिथे डिव्हाइस नेटवर्क्स स्कॅन करताना त्याच्या कायमस्वरूपी हार्डवेअर (OUI) ॲड्रेसऐवजी तात्पुरता, रँडमली जनरेट केलेला MAC ॲड्रेस वापरते.
पॅसिव्ह प्रेझेन्स ॲनालिटिक्ससमोरील सर्वात मोठे तांत्रिक आव्हान. यामुळे वैयक्तिक व्हिजिटर सेशन्स एकाधिक स्वतंत्र डिव्हाइसेस म्हणून दिसतात, ज्यामुळे युनिक व्हिजिटर्सची संख्या वाढून दिसते आणि ड्वेल टाईम कमी होतो. Captive Portal ऑथेंटिकेशनद्वारे हे कमी केले जाते.
Multipath Interference
अशी घटना जिथे रेडिओ सिग्नल दोन किंवा अधिक प्रोपॅगेशन पाथ्सद्वारे (सहसा पृष्ठभागावरून परावर्तित झाल्यामुळे) रिसिव्हिंग अँटेनापर्यंत पोहोचतो. परावर्तित सिग्नल वेगवेगळ्या फेज डिलेसह पोहोचतात, ज्यामुळे कंस्ट्रक्टिव्ह किंवा डिस्ट्रक्टिव्ह इंटरफेरन्स निर्माण होतो आणि RSSI रीडिंग्ज बिघडतात.
प्रेझेन्स ॲनालिटिक्समध्ये चुकीच्या लोकेशन डेटाचे मुख्य कारण, विशेषतः मेटल शेल्व्हिंग असलेल्या रिटेल वातावरणात किंवा रॅकिंग सिस्टीम असलेल्या वेअरहाऊसमध्ये. हीटमॅपिंग सर्वे दरम्यान विसंगत SNR रीडिंग्जद्वारे हे ओळखले जाते.
Passive Survey
एक हीटमॅपिंग तंत्र जिथे सर्वे टूल कोणत्याही विशिष्ट नेटवर्कशी कनेक्ट न करता सर्व चॅनेलवरील सर्व RF ट्रॅफिक ऐकते. हे शेजारील नेटवर्क्स आणि रोग डिव्हाइसेससह सर्व APs कडून डेटा कॅप्चर करते.
प्रेझेन्स ॲनालिटिक्स उपयोजित करण्यापूर्वी को-चॅनेल इंटरफेरन्स, रोग APs आणि संपूर्ण RF वातावरण ओळखण्यासाठी आवश्यक. ॲक्टिव्ह सर्वेच्या तुलनेत अधिक व्यापक दृश्य प्रदान करते, जे केवळ लक्ष्यित नेटवर्कमधील डेटा कॅप्चर करते.
Dwell Time
ट्रॅक केलेले डिव्हाइस एखाद्या परिभाषित फिजिकल झोनमध्ये जितका एकूण वेळ राहते तो कालावधी, ज्याची गणना पहिल्या प्रोब रिक्वेस्ट किंवा असोसिएशन इव्हेंटपासून ते डिव्हाइस झोन सोडण्यापूर्वीच्या शेवटच्या डिटेक्ट केलेल्या सिग्नलपर्यंत केली जाते.
प्रेझेन्स ॲनालिटिक्समधून मिळवलेले एक महत्त्वाचे बिझनेस मेट्रिक. रिटेलमध्ये ग्राहकांचे एंगेजमेंट (डिस्प्लेवर घालवलेला वेळ), हेल्थकेअरमध्ये वेटिंग टाईम (A&E रांगेचा कालावधी) आणि कॉन्फरन्स वातावरणात सेशन अटेंडन्स मोजण्यासाठी वापरले जाते.
Spatial Resolution
प्रेझेन्स ॲनालिटिक्स सिस्टीम एखाद्या डिव्हाइसचे फिजिकल लोकेशन किती अचूकतेने ठरवू शकते याचे प्रमाण, जे सहसा मीटरमधील त्रिज्येमध्ये व्यक्त केले जाते (उदा. 3 मीटरच्या आत अचूक). हे AP डेन्सिटी, AP प्लेसमेंट जिओमेट्री आणि पर्यावरणीय RF वैशिष्ट्यांद्वारे निश्चित केले जाते.
प्रेझेन्स ॲनालिटिक्स इनसाइट्सची अचूकता ठरवते. उच्च स्पेशिअल रिझोल्यूशन वैयक्तिक डिस्प्ले किंवा फिक्स्चरच्या पातळीवर झोन व्याख्या सक्षम करते, तर कमी रिझोल्यूशन केवळ विभाग-पातळीवर किंवा खोली-पातळीवर विश्लेषणास समर्थन देते.
Signal-to-Noise Ratio (SNR)
दिलेल्या ठिकाणी इच्छित सिग्नल पॉवर आणि बॅकग्राउंड नॉईज पॉवर यांचे गुणोत्तर, जे dB मध्ये व्यक्त केले जाते. उच्च SNR अधिक स्वच्छ सिग्नल वातावरण दर्शवते. विश्वसनीय हाय-थ्रूपुट WiFi साठी साधारणपणे 25 dB किंवा त्याहून अधिक SNR आवश्यक असतो.
केवळ RSSI पेक्षा WiFi गुणवत्तेचा अधिक विश्वसनीय दर्शक. इंटरफेरन्समुळे एखादा परिसर मजबूत RSSI परंतु खराब SNR दाखवू शकतो, ज्यामुळे थ्रूपुट कमी होतो आणि लोकेशन डेटा अविश्वसनीय होतो. हीटमॅपिंग सर्वेमध्ये नेहमी RSSI सोबत SNR चे पुनरावलोकन करा.
सोडवलेली उदाहरणे
एक ५०,००० चौ. फूट रिटेल वेअरहाऊस चुकीच्या प्रेझेन्स ॲनालिटिक्स डेटाचा सामना करत आहे — व्हिजिटर पाथ्स विस्कळीत दिसत आहेत आणि ड्वेल टाईम्स मोठ्या प्रमाणात विस्कळीत झाले आहेत. सध्याचे नेटवर्क केवळ बेसिक स्टाफ बारकोड स्कॅनर कनेक्टिव्हिटीसाठी डिझाइन केले गेले होते, ज्यामध्ये APs मध्यभागी असलेल्या गल्ल्यांमध्ये ठेवले होते.
१. संपूर्ण फ्लोअरवर बेसलाइन RSSI आणि SNR स्थापित करण्यासाठी पॅसिव्ह हीटमॅपिंग सर्व्हे करा. मेटल शेल्व्हिंग रन्सजवळ SNR डिग्रेडेशनकडे विशेष लक्ष द्या, जे या वातावरणात मल्टिपाथ इंटरफेरन्सचे मुख्य स्त्रोत आहेत.
२. AP लेआउट पुन्हा डिझाइन करा. APs मध्य-गल्लीच्या पोझिशन्सवरून पेरिमिटर वॉल्सकडे हलवा. यामुळे डिव्हाइसेस कॅल्क्युलेशनच्या कडांकडे 'खेचले' जातील याची खात्री करून ट्रायलेटरेशन भूमितीमध्ये लक्षणीय सुधारणा होते, ज्यामुळे फँटम लोकेशन रीडिंग्स निर्माण करणारी अँगुलर अस्पष्टता कमी होते.
३. प्रत्येक चौरस मीटर किमान तीन APs द्वारे -७२ dBm किंवा त्याहून चांगल्या पातळीवर कव्हर केला जाईल याची खात्री करण्यासाठी AP डेन्सिटी वाढवा. उंच शेल्व्हिंग असलेल्या ५०,००० चौ. फूट जागेत, यासाठी सामान्यत: बेसिक कव्हरेज डिझाइनपेक्षा २०-३०% जास्त APs आवश्यक असतात.
४. विस्कळीत लोकेशन कॅल्क्युलेशनला कारणीभूत ठरणारे कमकुवत सिग्नल्स फिल्टर करण्यासाठी -७८ dBm ची किमान RSSI थ्रेशोल्ड लागू करण्यासाठी ॲनालिटिक्स प्लॅटफॉर्म कॉन्फिगर करा.
५. व्हिजिटर्सना कनेक्ट होण्यासाठी प्रोत्साहित करण्यासाठी मोफत Guest WiFi देणारे Captive Portal लागू करा, जे असोसिएटेड डिव्हाइसेससाठी OS-लेव्हल MAC रँडमायझेशन बायपास करेल आणि डिटरमिनिस्टिक ट्रॅकिंग डेटा प्रदान करेल.
एका मोठ्या कॉन्फरन्स सेंटरला केटरिंग डिप्लॉयमेंट आणि सेशन कॅपॅसिटी प्लॅनिंग ऑप्टिमाइझ करण्यासाठी २,००० आसनी मुख्य हॉल आणि आठ ब्रेकआउट रूम्समधील उपस्थितांच्या प्रवाहाचा मागोवा घ्यायचा आहे. त्यांच्याकडे मुख्य हॉलमध्ये Cisco APs आणि ब्रेकआउट रूम्समध्ये Aruba APs असलेले लेगसी मल्टि-व्हेंडर WiFi वातावरण आहे.
१. हार्डवेअर-अॅग्नोस्टिक ॲनालिटिक्स प्लॅटफॉर्म — उदाहरणार्थ, Purple चे प्लॅटफॉर्म — तैनात करा जे Cisco आणि Aruba दोन्ही कंट्रोलर्सकडून त्यांच्या संबंधित APIs द्वारे एकाच वेळी स्टँडर्ड syslog आणि RTLS डेटा गोळा करू शकते, आणि डेटाला युनिफाइड ॲनालिटिक्स स्ट्रीममध्ये नॉर्मलाइज करू शकते.
२. विशेषतः ब्रेकआउट रूम्समधील पार्टिशन वॉल्सवर लक्ष केंद्रित करून हीटमॅपिंग सर्व्हे करा. पातळ पार्टिशन वॉल्समधून WiFi सिग्नल्स सहजपणे आरपार जातात, ज्यामुळे लक्षणीय झोन ब्लीड होतो, जिथे रूम A मधील डिव्हाइस रूम B मध्ये असल्याचे दिसते.
३. प्रत्येक विशिष्ट हॉल आणि ब्रेकआउट रूमशी संबंधित ॲनालिटिक्स प्लॅटफॉर्ममध्ये अचूक पॉलिगॉन झोन परिभाषित करा. पार्टिशन वॉल्समध्ये ब्लीड रोखण्यासाठी RSSI कट-ऑफ थ्रेशोल्ड (सामान्यतः -७० dBm) सेट करा.
४. रिअल-टाइम डिप्लॉयमेंट अलर्टसाठी केटरिंग टीमच्या ऑपरेशनल डॅशबोर्डसह परिणामी झोन ऑक्यूपेंसी API समाकलित करा — उदाहरणार्थ, जेव्हा ब्रेकआउट रूम ८०% क्षमतेवर पोहोचते तेव्हा नोटिफिकेशन ट्रिगर करणे.
५. भविष्यातील इव्हेंट प्लॅनिंगसाठी प्रेडिक्टिव मॉडेल्स तयार करण्यासाठी सेशन शेड्यूल्ससह झोन ऑक्यूपेंसी डेटाचा परस्परसंबंध जोडा.
सराव प्रश्न
Q1. तुमच्या रिटेल ऑपरेशन्स डायरेक्टरला एका विशिष्ट आयल (aisle) मधील नवीन एंड-कैप डिस्प्लेचा कन्व्हर्जन रेट मोजायचा आहे. IT टीम खात्री देते की संपूर्ण स्टोअरमध्ये मजबूत WiFi कव्हरेज आहे — सर्व डिव्हाइसेस विश्वसनीयपणे कनेक्ट होतात आणि थ्रूपुट उत्कृष्ट आहे. हे नेटवर्क या विशिष्ट डिस्प्लेसाठी अचूक प्रेझेन्स ॲनालिटिक्स (presence analytics) प्रदान करण्यासाठी तयार आहे का?
टीप: 'strong coverage' (वापरण्यायोग्य सिग्नल प्रदान करणारे एक AP) आणि अचूक झोन-स्तरीय स्थान डेटासाठी आवश्यक असणाऱ्या त्रिकोणीकरण (trilateration) आवश्यकतांमधील फरक विचारात घ्या.
नमुना उत्तर पहा
असे असणे आवश्यक नाही. मजबूत कव्हरेज आणि विश्वसनीय कनेक्टिव्हिटी केवळ हेच सिद्ध करतात की डिव्हाइसेस नेटवर्कशी जोडले जाऊ शकतात. विशिष्ट एंड-कैप डिस्प्लेवरील ड्वेल टाइम (dwell time) अचूकपणे ट्रॅक करण्यासाठी, ॲनालिटिक्स इंजिनला त्या विशिष्ट झोनमध्ये डिव्हाइसच्या स्थानाचे त्रिकोणीकरण (trilaterate) करणे आवश्यक आहे — ज्यासाठी डिव्हाइस किमान तीन APs ना एकाच वेळी -75 dBm किंवा त्यापेक्षा चांगल्या क्षमतेने ऐकू येणे आवश्यक आहे. कव्हरेजसाठी डिझाइन केलेले स्टोअर त्या आयलमध्ये केवळ एक किंवा दोन APs द्वारे हे साध्य करू शकते. तयारीची पुष्टी करण्यापूर्वी, एंड-कैप झोन तीन-AP त्रिकोणीकरण मर्यादा पूर्ण करतो की नाही हे तपासण्यासाठी विशेषतः हीटमॅपिंग सर्व्हे चालवा. जर ते करत नसेल, तर प्रेझेन्स ॲनालिटिक्स डेटा विश्वसनीय होण्यापूर्वी अतिरिक्त AP तैनात करणे किंवा त्यांची जागा बदलणे आवश्यक आहे.
Q2. एक हॉस्पिटलचे A&E विभाग रुग्णांच्या प्रतीक्षा वेळेचा मागोवा घेण्यासाठी प्रेझेन्स ॲनालिटिक्स तैनात करत आहे. ऑपरेशनच्या एका आठवड्यानंतर, डेटा दर्शवतो की सरासरी ड्वेल टाइम ८ मिनिटे आहे — जो ४५ मिनिटांच्या ज्ञात सरासरीपेक्षा खूपच कमी आहे — आणि युनिक व्हिजिटरची संख्या वास्तविक रुग्णांच्या संख्येपेक्षा ४ पट जास्त आहे. याचे सर्वात संभाव्य कारण काय आहे आणि त्याचे निराकरण कसे करावे?
टीप: जेव्हा डिव्हाइसेस नेटवर्कशी कनेक्ट नसतात, तेव्हा आधुनिक स्मार्टफोन ऑपरेटिंग सिस्टम्स MAC ॲड्रेसचे काय करतात याचा विचार करा.
नमुना उत्तर पहा
याचे सर्वात संभाव्य कारण म्हणजे MAC Randomisation. iOS 14+ आणि Android 10+ डिव्हाइसेस प्रोब रिक्वेस्ट पाठवताना त्यांचे MAC ॲड्रेस बदलतात, ज्यामुळे एकाच रुग्णाचे डिव्हाइस त्यांच्या भेटीदरम्यान अनेक भिन्न डिव्हाइसेस म्हणून दिसते. हे ४५ मिनिटांच्या सत्राला अनेक ८ मिनिटांच्या सत्रांमध्ये विभागते, ज्यामुळे युनिक व्हिजिटरची संख्या वाढते आणि ड्वेल टाइम कमी होतो. यासाठी शिफारस केलेले निराकरण म्हणजे हेल्थकेअर गेस्ट WiFi नेटवर्कसाठी Captive Portal लागू करणे. एकदा रुग्ण किंवा अभ्यागत प्रमाणीकृत (authenticate) झाले की, ॲनालिटिक्स प्लॅटफॉर्म सातत्याने जोडलेल्या डिव्हाइसच्या MAC ॲड्रेसचा मागोवा घेतो, ज्यामुळे OS-स्तरीय रँडमायझेशन बायपास होते. जे रुग्ण कनेक्ट करत नाहीत त्यांच्यासाठी, प्लॅटफॉर्मचे सेशन-स्टिचिंग अल्गोरिदम सक्षम करा, जे खंडित सत्रांची पुनर्रचना करण्यासाठी सिग्नल पॅटर्न सातत्य आणि टाइमिंग ह्युरिस्टिक्स वापरते. हे सहसा उच्च WiFi वापर असलेल्या वातावरणात ७०-८०% विखंडन सोडवते.
Q3. नियोजित नेटवर्क अपग्रेड दरम्यान, तुमचा इन्फ्रास्ट्रक्चर व्हेंडर एका मोठ्या स्टेडियम कॉन्कोर्समध्ये थ्रूपुट सुधारण्यासाठी आणि को-चॅनल इंटरफेरन्स कमी करण्यासाठी ६० ओम्नी-डायरेक्शनल 802.11ax APs च्या जागी ४० हाय-गेन डायरेक्शनल APs वापरण्याचा प्रस्ताव देतो. प्रकल्पाला मंजुरी मिळाली आहे. तुमच्या विद्यमान प्रेझेन्स ॲनालिटिक्स तैनातीचे रक्षण करण्यासाठी कोणती अनिवार्य कारवाई आवश्यक आहे आणि ही कारवाई न केल्यास काय धोका आहे?
टीप: प्रेझेन्स ॲनालिटिक्सच्या अचूकतेचे निर्धारण करणारे दोन मुख्य घटक विचारात घ्या: APs ची संख्या आणि ते तयार करत असलेले RF प्रोपॅगेशन पॅटर्न.
नमुना उत्तर पहा
तैनातीनंतर संपूर्ण हीटमॅपिंग सर्व्हे आणि ॲनालिटिक्स रिकॅलिब्रेशन करणे अनिवार्य आहे. ही कारवाई न करण्याचा धोका मोठा आहे: एकूण AP संख्या ६० वरून ४० पर्यंत कमी केल्याने त्रिकोणीकरणासाठी उपलब्ध असलेल्या एकाच वेळच्या डेटा पॉइंट्सची संख्या कमी होते, ज्यामुळे काही झोन अचूक स्थान डेटासाठी आवश्यक असलेल्या तीन-AP मर्यादेच्या खाली जाऊ शकतात. शिवाय, ओम्नी-डायरेक्शनल अँटेनाच्या जागी डायरेक्शनल अँटेना वापरल्याने कॉन्कोर्समधील RF प्रोपॅगेशन पॅटर्न मूलभूतपणे बदलतात — कव्हरेज फूटप्रिंट्सचा आकार आणि स्वरूप बदलते, ज्यामुळे ॲनालिटिक्स प्लॅटफॉर्ममधील पूर्वी कॅलिब्रेट केलेल्या सर्व झोन सीमा अवैध ठरतात. रिकॅलिब्रेशनशिवाय, प्रेझेन्स ॲनालिटिक्स इंजिन पद्धतशीरपणे चुकीचा स्थान डेटा तयार करेल, ज्यामुळे अभ्यागतांचे स्थान शेजारच्या झोनमध्ये चुकीचे दर्शवले जाऊ शकते. अपग्रेडनंतर ॲनालिटिक्स प्लॅटफॉर्म पुन्हा सक्षम करण्यापूर्वी हीटमॅपिंग सर्व्हे पूर्ण करणे आवश्यक आहे.
Q4. एक ट्रान्सपोर्ट हब ऑपरेटर वेगवेगळ्या टर्मिनल्सवर विद्यमान Cisco, Aruba आणि Ruckus ॲक्सेस पॉइंट्सचे मिश्रण वापरून मल्टी-टर्मिनल विमानतळावर प्रेझेन्स ॲनालिटिक्स तैनात करू इच्छितो. ऑपरेशन्स टीमला सर्व टर्मिनल्सवरील प्रवासी प्रवाह दर्शवणारा एकच युनिफाइड डॅशबोर्ड हवा आहे. या तैनातीचा यशस्वितेसाठी कोणता प्लॅटफॉर्म आर्किटेक्चर निर्णय सर्वात महत्त्वाचा आहे?
टीप: मल्टी-व्हेंडर हार्डवेअर वातावरणात सिंगल-व्हेंडर ॲनालिटिक्स सोल्यूशन तैनात करण्याच्या परिणामांचा विचार करा.
नमुना उत्तर पहा
सर्वात महत्त्वाचा निर्णय म्हणजे हार्डवेअर-अज्ञेयवादी (hardware-agnostic) ॲनालिटिक्स प्लॅटफॉर्म निवडणे जे तिन्ही व्हेंडर कंट्रोलर्सकडून त्यांच्या संबंधित API (Cisco DNA Spaces, Aruba Central, Ruckus Analytics) द्वारे एकाच वेळी डेटा गोळा करण्यास सक्षम असेल. सिंगल-व्हेंडर ॲनालिटिक्स सोल्यूशन तैनात केल्यास — उदाहरणार्थ, Cisco चे मूळ ॲनालिटिक्स टूल्स — केवळ Cisco-व्यवस्थापित APs ची दृश्यमानता प्रदान करेल, ज्यामुळे Aruba आणि Ruckus टर्मिनल्स युनिफाइड डॅशबोर्डमध्ये ब्लँड स्पॉट्स म्हणून राहतील. हार्डवेअर-अज्ञेयवादी प्लॅटफॉर्म तिन्ही व्हेंडर स्ट्रीम्समधील डेटा एकाच ॲनालिटिक्स लेयरमध्ये सामान्य करतो, ज्यामुळे सर्व टर्मिनल्सवर खरोखर युनिफाइड प्रवासी प्रवाह दृश्यमानता सक्षम होते. हे हार्डवेअर रिफ्रेश सायकलच्या विरूद्ध तैनातीला भविष्यात देखील सुरक्षित करते — जर एक टर्मिनल चौथ्या व्हेंडरवर अपग्रेड झाले, तर ॲनालिटिक्स लेयर कोणत्याही व्यत्ययाशिवाय कार्य करत राहू शकते. Purple चे प्लॅटफॉर्म आर्किटेक्चर विशेषतः या मल्टी-व्हेंडर तैनाती पॅटर्नसाठी डिझाइन केले आहे.
या मालिकेमध्ये पुढे वाचा
First-party data marketing: व्यवसायांसाठी एक व्यापक मार्गदर्शक
हे मार्गदर्शक एंटरप्राइझ Guest WiFi नेटवर्कचा वापर करून एक मजबूत first-party data मार्केटिंग धोरण कसे तयार करावे हे स्पष्ट करते. यामध्ये captive portals द्वारे सुरक्षित डेटा कॅप्चर करण्यासाठी तांत्रिक आर्किटेक्चर, GDPR-compliant संमती वर्कफ्लो, CRM इंटिग्रेशन पॅटर्न आणि स्वयंचलित मोहीम उपयोजन समाविष्ट आहे. हॉस्पिटॅलिटी, रिटेल, इव्हेंट्स आणि सार्वजनिक-क्षेत्रातील ठिकाण ऑपरेटर्सना निष्क्रिय अभ्यागतांना उच्च-गुणवत्तेच्या, मालकीच्या मार्केटिंग प्रेक्षकांमध्ये रूपांतरित करण्यासाठी कृतीयोग्य मार्गदर्शन मिळेल.
ग्राहक डेटा व्यवस्थापन प्लॅटफॉर्म: व्यवसायांसाठी एक व्यापक मार्गदर्शिका
ही मार्गदर्शिका स्पष्ट करते की वेन्यू ऑपरेटर विखुरलेला अभ्यागत डेटा एकत्रित करण्यासाठी ग्राहक डेटा व्यवस्थापन प्लॅटफॉर्म कसा तैनात करू शकतात. यामध्ये तांत्रिक आर्किटेक्चर, एकत्रीकरण धोरणे आणि फर्स्ट-पार्टी डेटा प्रोफाईल तयार करण्यात Guest WiFi ची महत्त्वपूर्ण भूमिका समाविष्ट आहे.
गेस्ट WiFi आणि लोकेशन ॲनालिटिक्सच्या व्यावसायिक ROI चे मोजमाप करणे
हे मार्गदर्शक गेस्ट WiFi आणि लोकेशन ॲनालिटिक्सच्या व्यावसायिक ROI चे मोजमाप करण्यासाठी तांत्रिक आणि ऑपरेशनल फ्रेमवर्क प्रदान करते. हे किरकोळ (retail), आदरातिथ्य (hospitality) आणि सार्वजनिक ठिकाणी ड्वेल-टाइम वाढ, ऑपरेशनल कार्यक्षमता आणि फर्स्ट-पार्टी डेटा कॅप्चरद्वारे हार्डवेअर गुंतवणुकीतून मूल्याची गणना कशी करावी याचे तपशील देते. IT व्यवस्थापक, नेटवर्क आर्किटेक्ट्स, CTOs आणि वेन्यू ऑपरेशन्स डायरेक्टर्सना त्यांच्या WiFi गुंतवणुकीचे समर्थन करण्यासाठी आणि ती जास्तीत जास्त वाढवण्यासाठी ठोस मोजमाप फ्रेमवर्क, वास्तविक केस स्टडीज आणि अनुपालन (compliance) मार्गदर्शन मिळेल.