How Guest WiFi Supports Venue Analytics and Footfall Tracking
This guide provides a technical and operational framework for leveraging guest WiFi to gain deep insights into visitor behaviour within physical venues. It details how to capture and analyse data for footfall tracking and dwell time calculation, enabling IT and operations leaders to make data-driven decisions that optimize staffing, enhance venue layout, and increase business ROI.
🎧 Listen to this Guide
View Transcript
Executive Summary
For venue operators and IT leadership, guest WiFi is no longer just a facility; it is a critical source of business intelligence. Beyond providing internet access, a modern WiFi infrastructure captures a rich stream of data that reveals how visitors move through and interact with a physical space. This guide provides a technical and operational framework for understanding how to leverage guest WiFi for advanced venue analytics, specifically focusing on footfall tracking, dwell time calculation, and visitor behaviour analysis. By translating raw WiFi data into actionable insights, organisations can optimise staffing, improve venue layout, increase marketing ROI, and enhance the overall visitor experience. This reference is designed for IT managers, network architects, and operations directors who need to deploy, manage, and extract value from their WiFi intelligence platform. It covers the underlying technology, implementation best practices, compliance considerations under GDPR, and methods for measuring business impact, moving from theoretical concepts to practical deployment guidance.
Technical Deep-Dive
Understanding how WiFi analytics function requires looking at the data generated at different stages of a device's interaction with the network. The process begins even before a user authenticates, providing a foundational layer of presence and movement data.
Passive Data Collection: Probe Requests
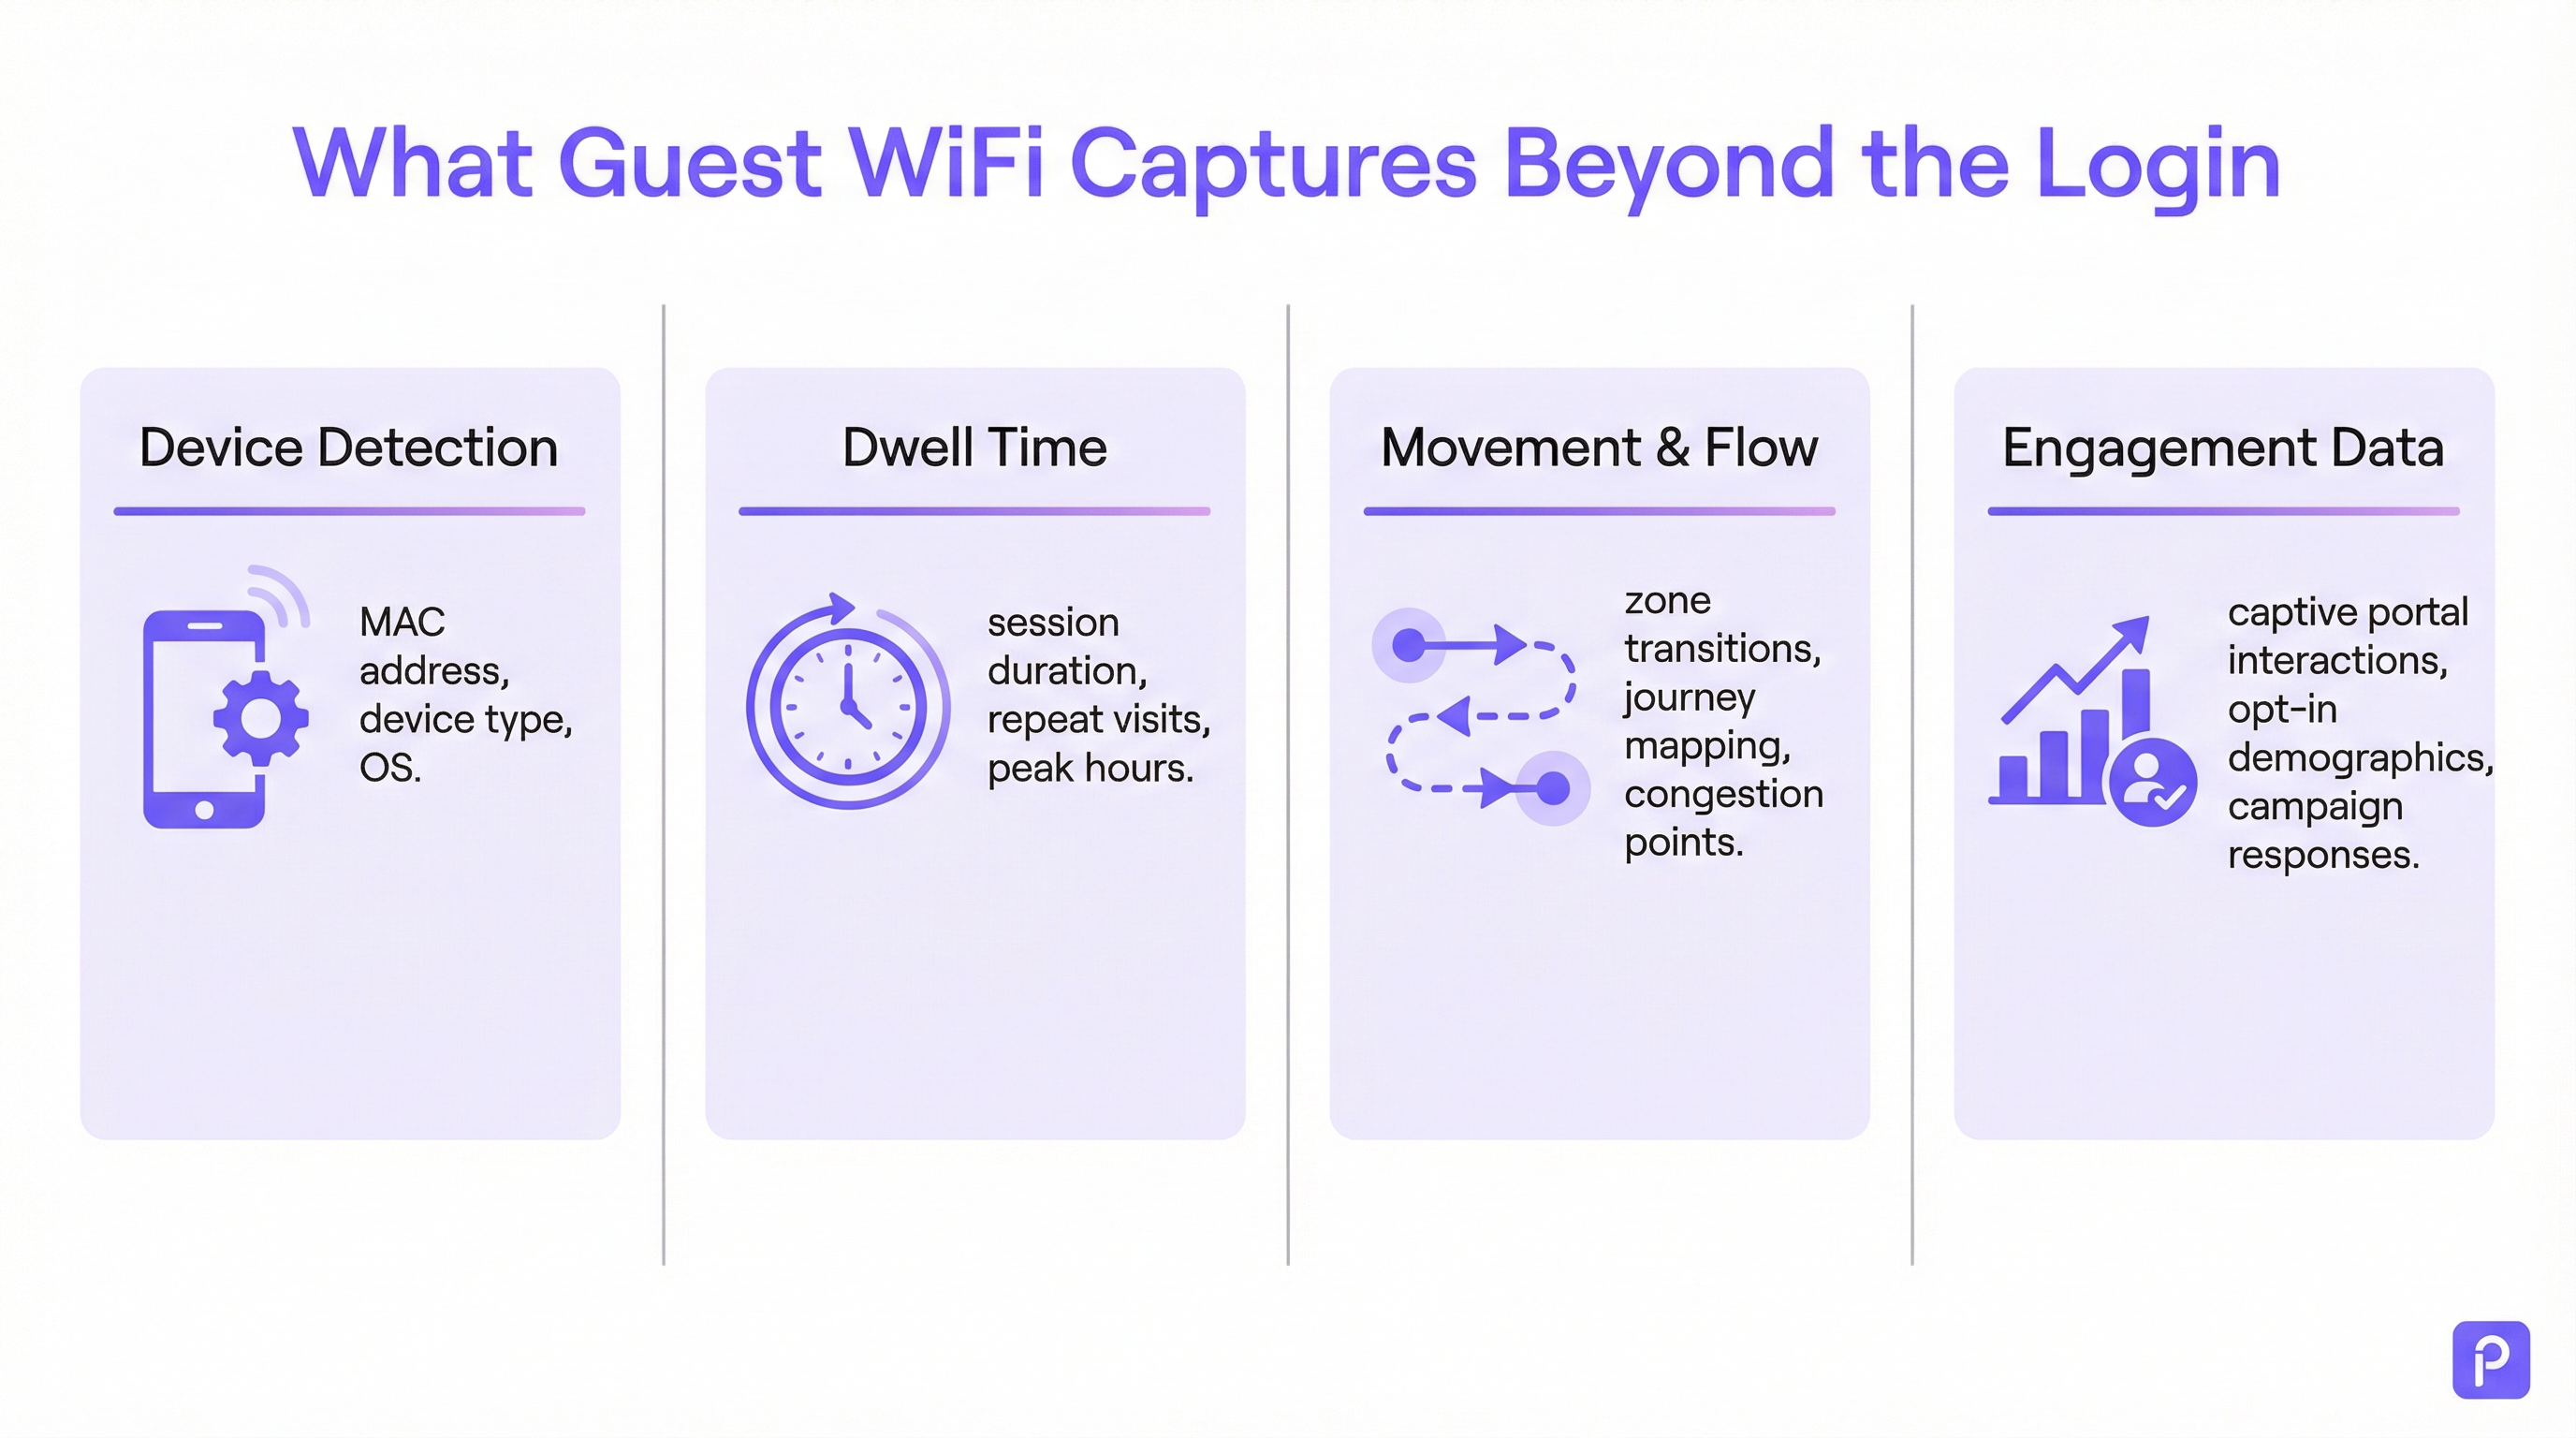
Every WiFi-enabled device (smartphone, tablet, laptop) periodically broadcasts "probe requests". These are small data packets sent out by the device to discover nearby WiFi networks. Crucially, each probe request contains the device's unique Media Access Control (MAC) address. Even if a device never connects to the network, access points (APs) within the venue can detect and log these probe requests.
- What is captured: MAC address, Received Signal Strength Indicator (RSSI), and the timestamp of the detection.
- How it's used: By triangulating the RSSI from multiple APs, the system can approximate the device's location. A continuous stream of these detections allows the platform to trace a device's path through the venue. This forms the basis of footfall analysis for all WiFi-enabled devices in range, not just those connected to the network.
- The MAC Randomisation Challenge: Since iOS 14 and Android 10, devices now frequently use a randomised or private MAC address for probe requests to protect user privacy. This can lead to a single device being counted multiple times. Enterprise-grade analytics platforms employ sophisticated algorithms to de-duplicate these randomised addresses, using other signal characteristics and temporal analysis to stitch together a probable journey for a single device. [1]
Active Data Collection: Connected Sessions
When a visitor actively connects to the guest WiFi, typically via a captive portal, a much richer dataset becomes available. The authentication process creates a formal session with a defined start and end.
- Dwell Time Calculation: The most fundamental metric derived from a connected session is dwell time. It is calculated as the time difference between the session start (authentication) and the session end (disconnection or timeout). A robust platform will go further, amalgamating multiple short sessions from the same device within a given time window into a single "visit", providing a more accurate picture of total time spent in the venue.
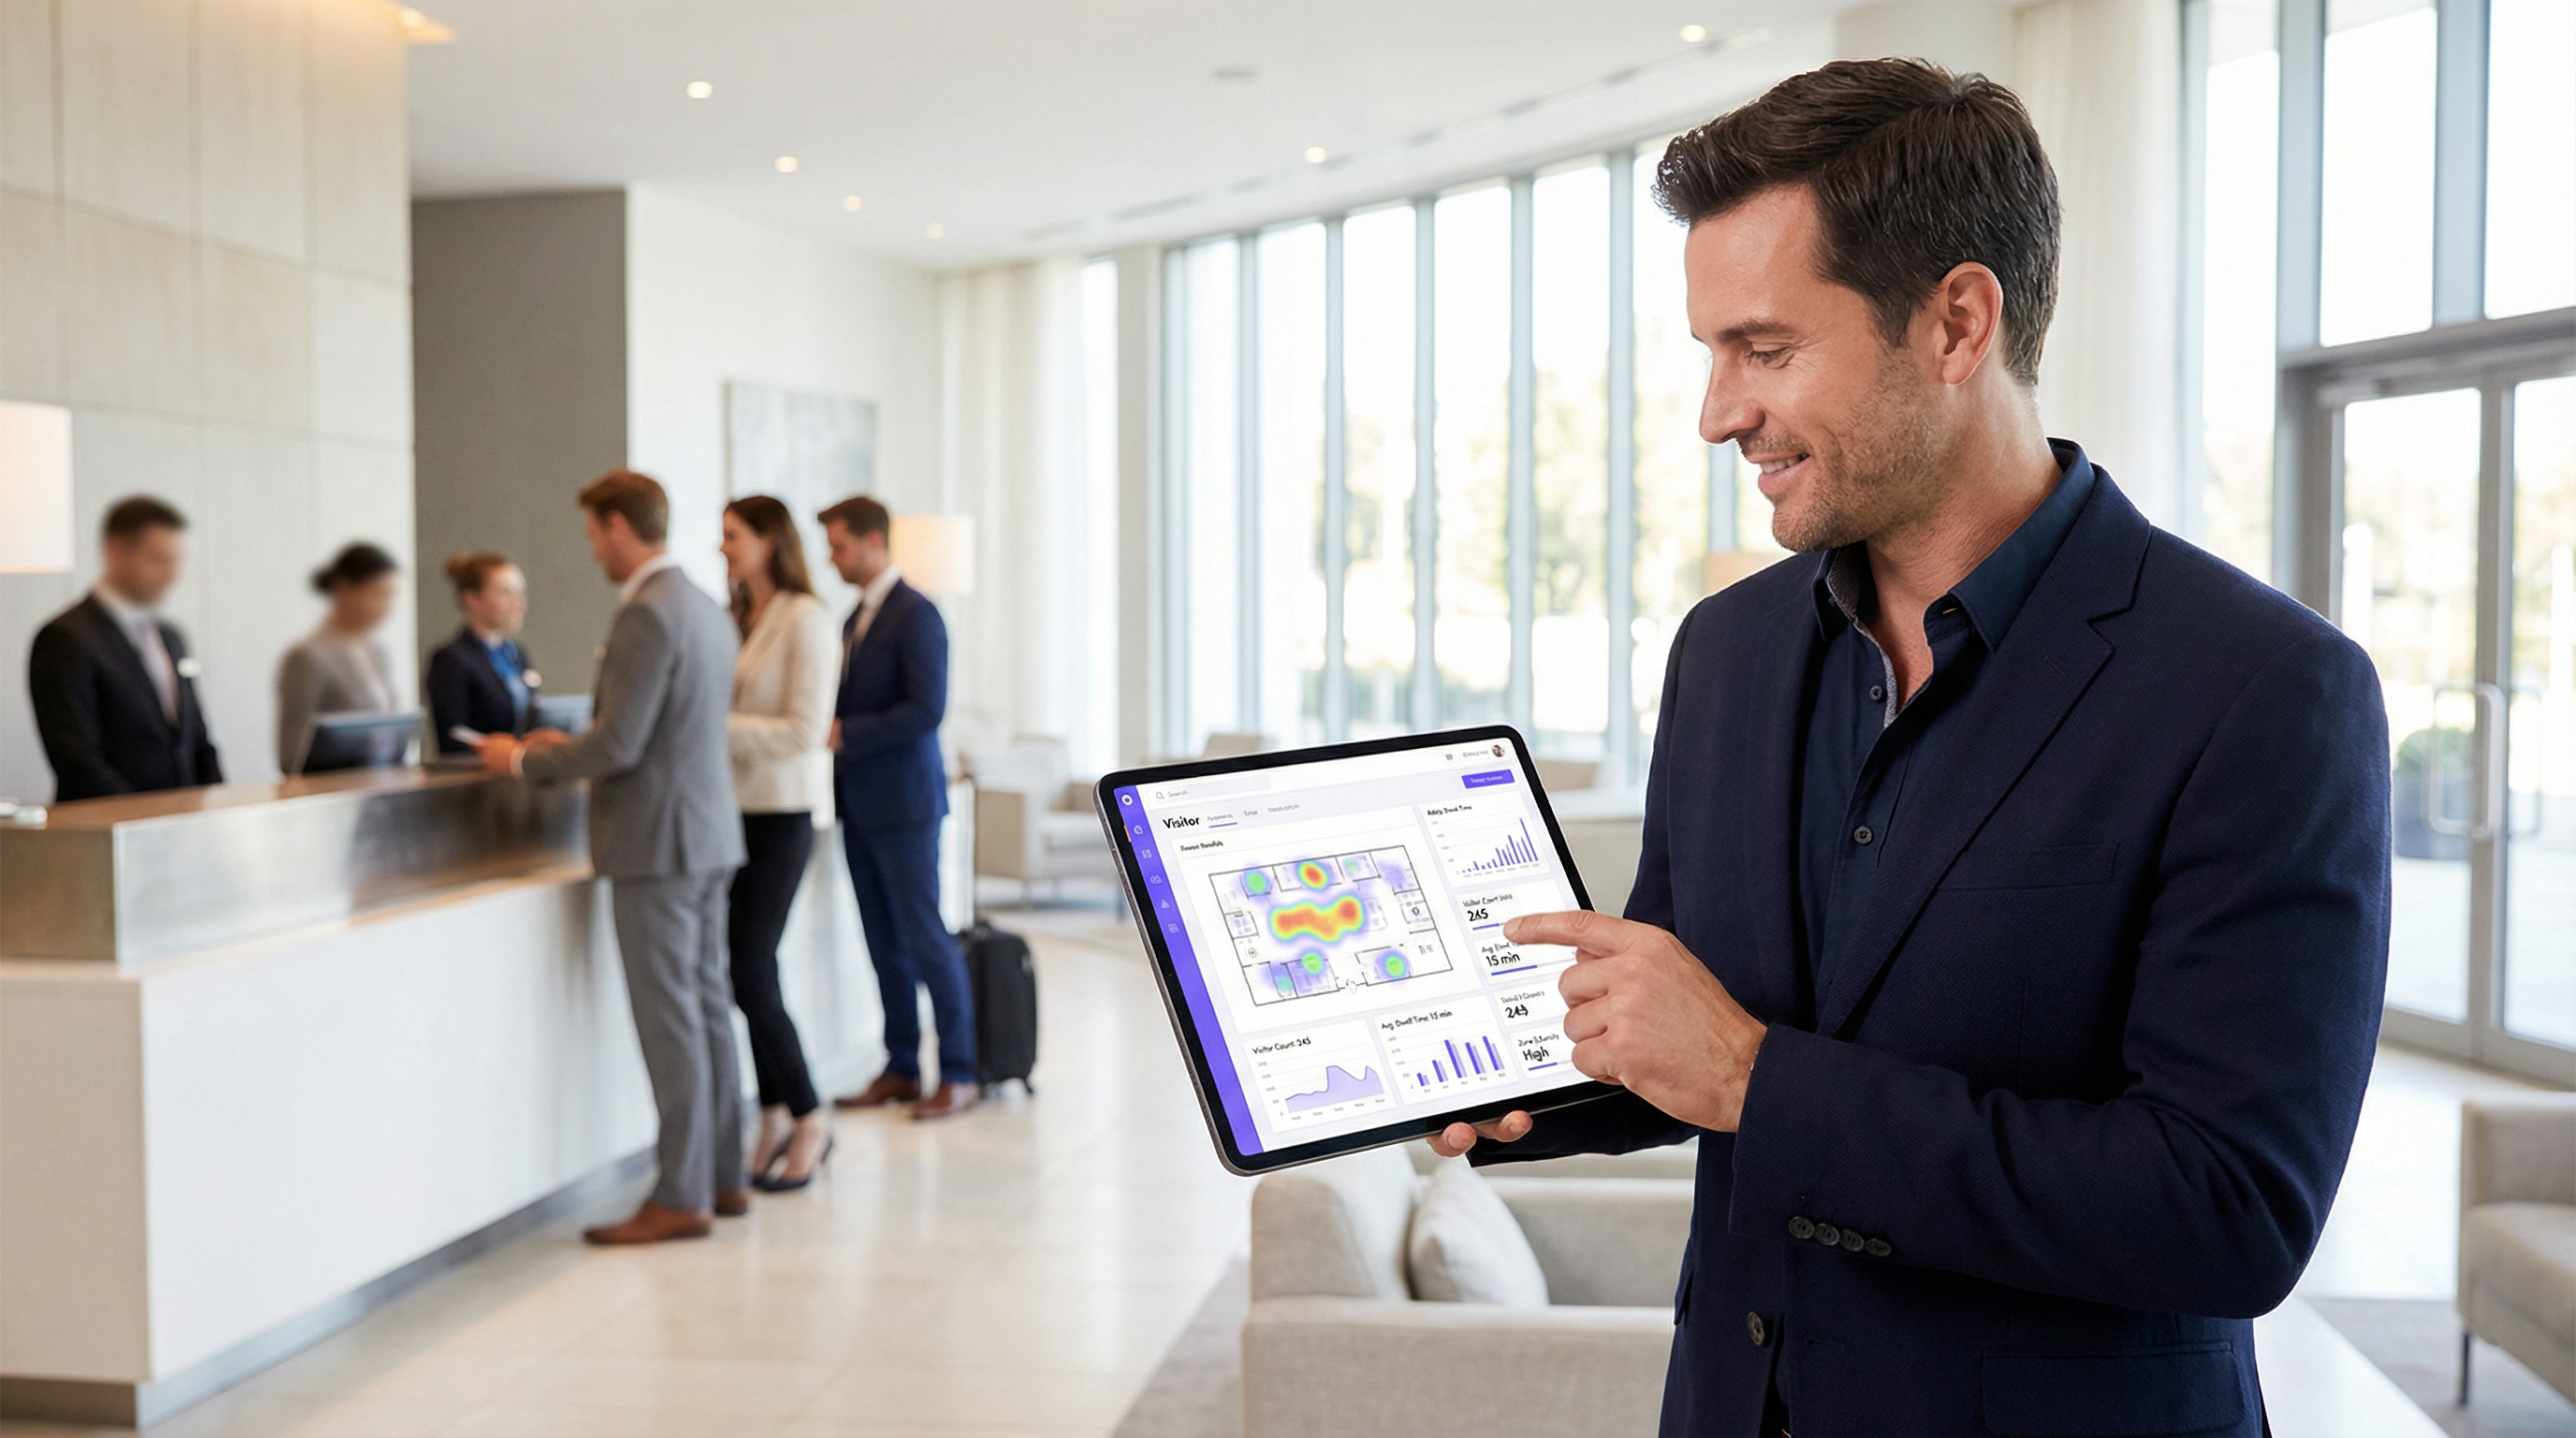
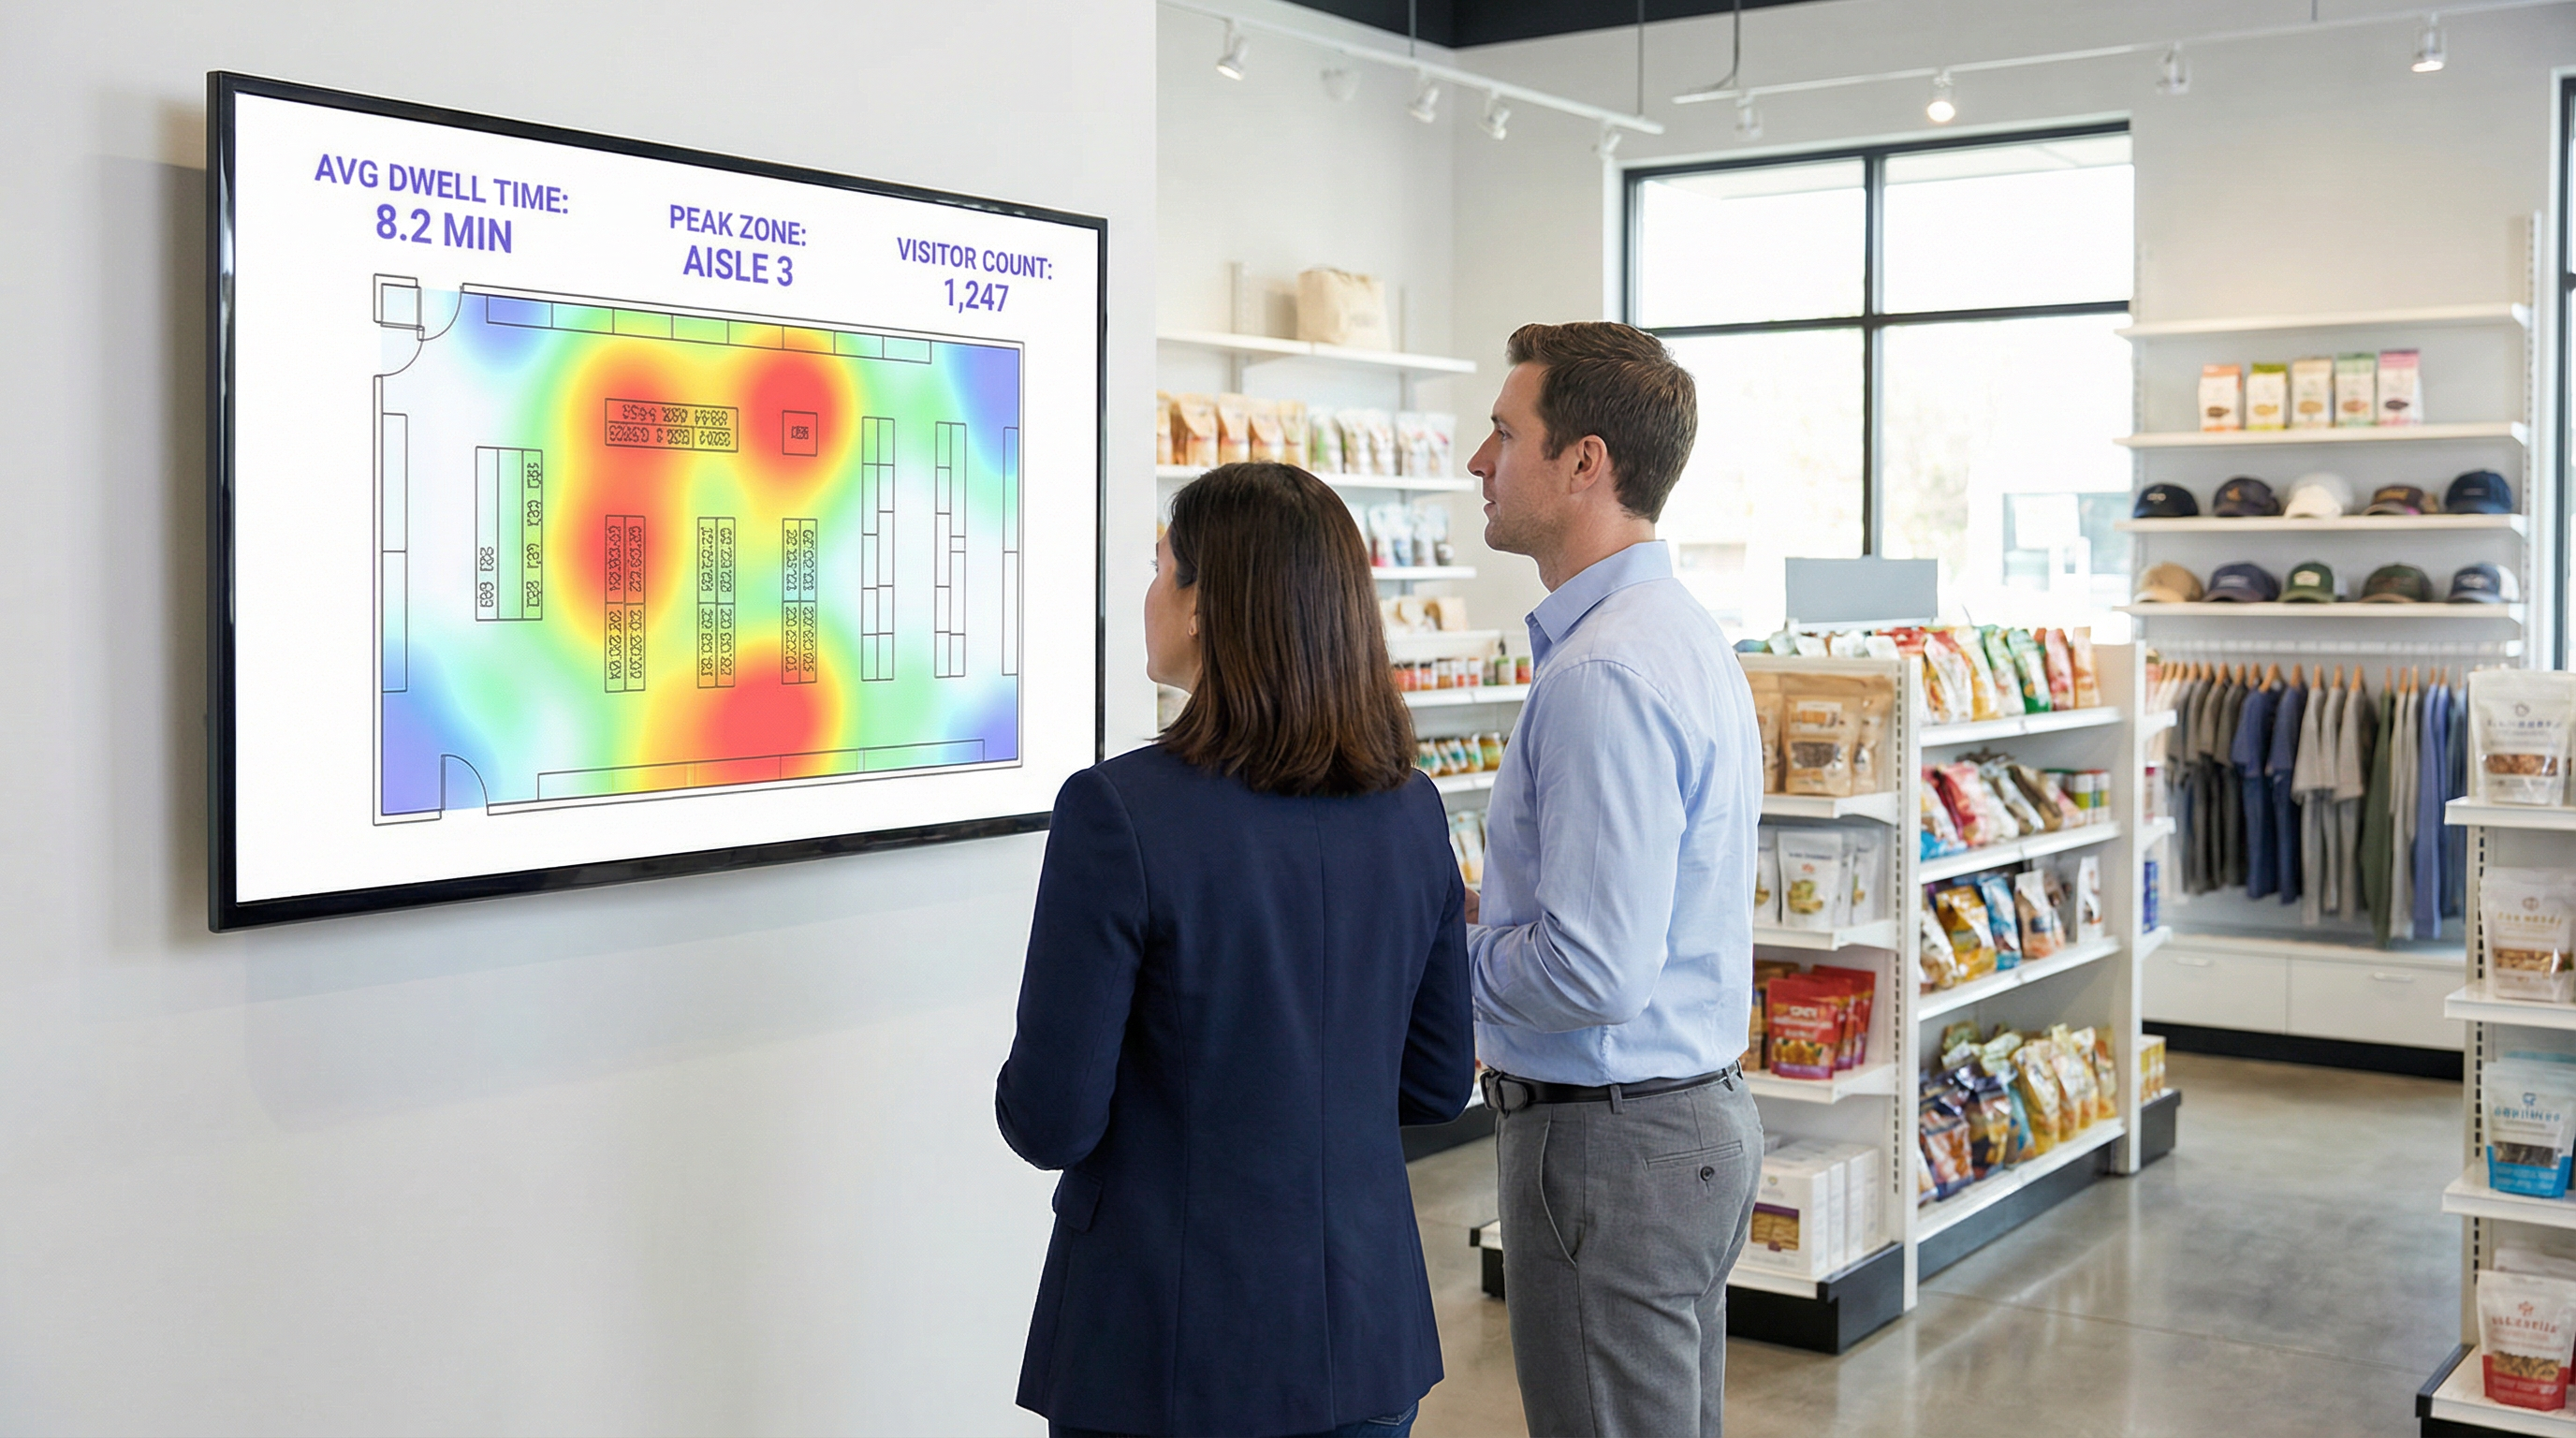
- Location & Zone Analytics: Once connected, the device's location can be tracked with greater accuracy. The platform continuously monitors the RSSI from the APs the device is communicating with. This allows for detailed zone-based analytics: how many people are in the lobby vs the café, how long they stay in each area, and the flow of traffic between zones. This is the data that powers real-time heatmaps and journey analysis.
- First-Party Data Enrichment: The captive portal is a critical strategic asset. By offering authentication via social login (e.g. Facebook, LinkedIn), email, or a simple form, the venue can, with explicit user consent, link the anonymous MAC address to a real-world identity or demographic profile. This transforms the data from anonymous footfall counts into rich, first-party customer data that can be used for personalised marketing and CRM integration, fully compliant with standards like GDPR. [2]
Implementation Guide
A successful WiFi analytics deployment is as much about physical network design and data strategy as it is about software configuration.
Step 1: AP Placement and Density Audit
Your existing AP layout may be optimised for coverage, not for analytics. For accurate location tracking, a higher density of APs is required to enable effective triangulation.
- Coverage-Only Design: APs are placed to maximise signal reach, often resulting in minimal overlap between AP coverage zones.
- Analytics-Ready Design: APs are placed to create significant overlap. A device in any given location should be detectable by at least three APs for reliable location calculation. A general best practice is to aim for one AP per 150-200 square metres in open areas.
Step 2: Configuring Data Ingestion
The analytics platform needs to receive data from your network controller or directly from the APs. This typically involves configuring the network to forward syslog or SNMP trap data containing the relevant probe request and session information to the analytics cloud endpoint. Ensure your firewall rules permit this outbound traffic.
Step 3: Defining Zones and Floor Plans
Upload your venue's floor plans into the analytics platform. Then, using the tools provided, draw polygonal "zones" over the map corresponding to distinct operational areas (e.g. 'Main Entrance', 'Aisle 3', 'Bar Area', 'Meeting Room 1'). This is the most critical configuration step for generating meaningful, context-specific reports.
Step 4: Captive Portal and Consent Workflow Design
Design your captive portal not just as a login gate, but as a data governance tool. In collaboration with your legal and marketing teams:
- Craft a Clear Privacy Notice: Explain in simple language what data is being collected (MAC address, location, session times) and for what purpose (to improve venue operations, for marketing).
- Implement Granular Consent: Provide separate, explicit checkboxes for (a) accepting terms for network access, and (b) consenting to data collection for analytics and marketing. This is a core requirement for GDPR compliance.
- Offer Value Exchange: Increase opt-in rates by offering an incentive for sharing data, such as a discount voucher or access to premium content.
Best Practices
- Filter Staff and Static Devices: Ensure you have a process to exclude the MAC addresses of staff devices and fixed equipment (like smart TVs or payment terminals) from your analytics. Most platforms allow you to upload a list of MACs to ignore, preventing your own operations from skewing visitor data.
- Integrate with Other Systems: The true power of WiFi analytics is realised when it is combined with other data sources. Integrating with Point-of-Sale (POS) systems allows you to correlate dwell time with spend. Integrating with your CRM allows you to link visit history to customer profiles. Prioritise platforms with robust, well-documented REST APIs.
- Adhere to Data Retention Policies: Establish a clear data retention policy based on legal requirements (like GDPR's principle of storage limitation) and business needs. Anonymised, aggregated data can be kept indefinitely, but personally identifiable information (PII) should be automatically purged or anonymised after a defined period (e.g. 24 months).
Troubleshooting & Risk Mitigation
- Issue: Inaccurate Visitor Counts: This is often due to MAC randomisation. Ensure your platform has a specific feature to address this. If counts still seem high, investigate whether staff or static devices are being included in the data.
- Issue: Poor Location Accuracy: This almost always points to insufficient AP density or suboptimal placement. Conduct a site survey to identify coverage gaps and areas where a device can only be 'seen' by one or two APs.
- Risk: GDPR/CCPA Compliance Failure: The biggest risk is a poorly configured consent process. Regularly audit your captive portal workflow to ensure it meets the latest standards for explicit and informed consent. Ensure your platform vendor can provide a Data Processing Addendum (DPA) that commits them to compliant data handling. [3]
- Risk: Data Security Breach: The connection between your network and the analytics cloud must be secure. Verify that data is encrypted in transit (using TLS 1.2 or higher) and at rest. Your platform should also support role-based access control (RBAC) to ensure users can only see the data relevant to their roles.
ROI & Business Impact
Measuring the return on investment from a WiFi analytics platform involves tracking improvements in key operational metrics.
- Retail: Correlate dwell time in specific departments with sales data from your POS. A 10% increase in dwell time in the electronics department that correlates with a 2% increase in sales for that category provides a clear ROI. Use footfall data to A/B test store layouts and measure the impact on visitor flow and product discovery.
- Hospitality: Optimise staffing in lobbies, bars, and restaurants based on historical and real-time occupancy data. A hotel can avoid overstaffing during quiet periods and prevent service degradation during unexpected peaks, leading to direct payroll savings and improved guest satisfaction.
- Conference Centres: Provide sponsors with verifiable data on footfall and dwell time around their booths, creating a new revenue stream. Use session data from breakout rooms to inform future event programming, focusing on topics that generate the most engagement.
[1] IEEE Standards Association. (2020). IEEE 802.11-2020 - IEEE Standard for Information Technology. https://standards.ieee.org/standard/802_11-2020.html [2] General Data Protection Regulation (GDPR). (2018). Regulation (EU) 2016/679 of the European Parliament and of the Council. https://gdpr-info.eu/ [3] Information Commissioner's Office (ICO). (2021). Guide to the General Data Protection Regulation (GDPR). https://ico.org.uk/for-organisations/guide-to-data-protection/guide-to-the-general-data-protection-regulation-gdpr/
Key Terms & Definitions
Guest WiFi Analytics
The process of capturing, analysing, and interpreting data from guest WiFi networks to understand visitor behaviour in a physical space.
IT teams use this to transform the WiFi network from a cost centre into a source of business intelligence that informs operational decisions.
WiFi Footfall Tracking
The use of WiFi signals (specifically probe requests and session data) to measure the number of people entering a venue or specific zone and the paths they take.
Operations managers use this data to understand visitor journeys, identify bottlenecks, and optimise venue layouts without needing separate people-counting hardware.
Dwell Time
The total amount of time a visitor's device is detected within a venue or a specific predefined zone during a single visit.
This is a primary KPI for engagement. In retail, longer dwell time often correlates with higher spend. In hospitality, it helps measure the utilisation of amenities like bars and lounges.
MAC Address
A unique hardware identifier assigned to a device's network interface. It is the primary identifier used to track a device, even before it connects to a network.
While essential for tracking, IT teams must be aware of MAC randomisation and ensure their analytics platform can account for it to avoid inaccurate visitor counts.
RSSI (Received Signal Strength Indicator)
A measurement of the power present in a radio signal received by an access point from a device. The stronger the signal, the closer the device is assumed to be.
This is the core data point used for location triangulation. Network architects need to ensure sufficient AP density for reliable RSSI readings from multiple points.
Captive Portal
A web page that a user must view and interact with before being granted access to a public WiFi network.
For IT and marketing, this is the strategic point for enforcing terms, gaining GDPR-compliant consent for data collection, and capturing first-party data like email addresses.
MAC Randomisation
A privacy feature in modern operating systems (iOS, Android) that periodically changes the MAC address a device uses for WiFi scanning to prevent passive tracking.
This is the single biggest technical challenge for accurate footfall counting. A key task for network architects is to select an analytics platform that has a proven mechanism for mitigating its effects.
Zone Analytics
The analysis of visitor behaviour within predefined virtual areas (zones) of a venue, such as movement between zones and dwell time per zone.
Venue operators use this to get granular insights. Instead of just knowing total visitors, they can compare the performance of 'Aisle 1' vs. 'Aisle 2' or see how many lobby visitors proceed to the restaurant.
Case Studies
A 200-room hotel wants to reduce lobby congestion during the peak check-in window (3-5 PM) and improve the guest experience.
- Deploy WiFi Analytics: Ensure AP density in the lobby, entrance, and bar areas meets the 3-AP visibility rule. Define zones for 'Check-in Queue', 'Lobby Seating', and 'Bar Entrance'. 2. Data Collection (1 Week): Collect baseline data on visitor flow and dwell times during the 3-5 PM window. 3. Analysis: The analytics reveal that dwell time in the 'Check-in Queue' zone peaks at 15 minutes, and footfall from the entrance flows directly to the queue, bypassing the lobby bar. 4. Intervention: The hotel implements a mobile check-in station in the 'Lobby Seating' area and updates the captive portal to promote a 'skip the queue' message with a link to the hotel app. 5. Measure & Iterate: Post-intervention data shows queue dwell time has dropped to 8 minutes, and footfall to the bar area from the entrance has increased by 20%.
A retail chain is redesigning its flagship store and wants to validate that the new layout improves product discovery and customer engagement.
- Baseline Analysis: Before the redesign, use WiFi analytics to map the most common customer journeys and generate a footfall heatmap. Identify which zones have the highest and lowest dwell times. 2. Post-Redesign Analysis: After the new layout is implemented, conduct the same analysis. 3. Comparative Reporting: Compare the before-and-after heatmaps and journey flows. The new layout is successful if: (a) footfall is more evenly distributed, indicating better discovery; (b) dwell time has increased in high-margin product zones; and (c) the percentage of visitors who only visit the entrance zone (bouncing) has decreased. 4. POS Integration: Correlate the increase in dwell time in a specific zone (e.g., 'Premium Denim') with sales data for that category to calculate the direct revenue impact of the layout change.
Scenario Analysis
Q1. A large conference is experiencing complaints about overcrowding in the corridors between sessions. How would you use WiFi analytics to diagnose the problem and propose a data-driven solution?
💡 Hint:Think about using time-series data for specific zones and correlating it with the event schedule.
Show Recommended Approach
First, define the corridor areas as distinct zones in the analytics platform. Then, analyse the footfall and device density metrics for these zones, specifically in the 15-minute windows before and after major keynote sessions. This will quantify the congestion peaks. The solution would be to present this data to the event organisers and recommend staggering the session end times by 10-15 minutes for adjacent large halls to smooth out the flow of attendees. The success of this change can be measured by a reduction in peak device density in the corridor zones during the next event.
Q2. A retail store's marketing team wants to prove the ROI of a new in-store digital signage campaign. How can they use guest WiFi analytics to measure the campaign's impact on footfall and dwell time?
💡 Hint:The key is to isolate the variable. You need to compare behaviour in the target zone before and during the campaign.
Show Recommended Approach
Define a zone around the new digital signage. Establish a baseline by measuring the average dwell time and the percentage of total store visitors who enter that zone for a two-week period before the campaign starts. Once the campaign is active, continue to measure the same metrics. The ROI can be demonstrated by showing a statistically significant increase in either dwell time within the zone (people are stopping to watch) or the capture rate of the zone (more people are being drawn to the area). For a more advanced analysis, integrate with POS data to see if the increased engagement correlates with a sales lift for the promoted products.
Q3. A hotel manager has noticed a 15% drop in bar revenue over the last quarter but overall visitor numbers are stable. How could they use WiFi analytics to investigate potential causes related to visitor behaviour?
💡 Hint:This requires looking at visitor journeys and flow patterns, not just isolated zone data.
Show Recommended Approach
The investigation should focus on visitor journey analysis. Define zones for the lobby, reception, lifts, and the bar. Use the platform's flow analysis tools to answer two questions: 1. What percentage of visitors who enter the lobby also enter the bar zone? Is this percentage trending down over the last quarter? 2. Of the visitors who do enter the bar, is their average dwell time decreasing? A drop in the lobby-to-bar conversion rate might suggest an issue with signage or visibility. A decrease in dwell time for those who do enter the bar might suggest a problem with service, atmosphere, or offerings. The data pinpoints whether the problem is attracting guests or retaining them.
Key Takeaways
- ✓Your guest WiFi is a powerful sensor network capable of generating deep business intelligence.
- ✓WiFi analytics captures both passive (probe requests) and active (connected sessions) data to build a complete picture of visitor behaviour.
- ✓Accurate footfall and dwell time analysis depends on strategic AP placement with sufficient density for triangulation (the '3-AP rule').
- ✓MAC randomisation is a critical technical challenge; your analytics platform must have a robust mechanism to handle it for accurate counting.
- ✓The captive portal is your gateway for gaining GDPR-compliant consent and enriching anonymous data with valuable first-party demographic information.
- ✓The highest ROI comes from integrating WiFi analytics data into core operational workflows for staffing, marketing, and space utilisation.
- ✓Compliance is non-negotiable. Your consent workflow must be explicit, and your data handling must adhere to GDPR/CCPA principles.
