
When Wi-Fi performance drops, running a channels scan is the most effective tool for identifying the cause and resolving it. It provides an X-ray of your wireless environment, revealing exactly how congested the airwaves are. With this data, you can move your network to a quieter channel for a faster, more stable connection.
This simple step frequently resolves unexplained slowdowns and connection drops.
Why a Wi-Fi Channels Scan Is Your Best Defence Against Bad Wi-Fi

Have you ever invested in super-fast internet, only to experience painfully slow Wi-Fi? Often, the bottleneck is not your provider, but congestion in your local wireless environment. Your network constantly competes for airtime with dozens of other devices, creating digital congestion that can severely degrade your connection.
Think of Wi-Fi channels as lanes on a motorway. When too many networks occupy the same lane, performance drops. This is a daily reality in modern venues, from hotels and shops to busy office buildings. A Wi-Fi channels scan acts as a traffic report, providing a clear view of which lanes are congested and which are clear.
Understanding Wireless Congestion
The two primary causes of poor performance are co-channel interference and adjacent-channel interference. Co-channel interference occurs when multiple access points (APs) broadcast on the same channel, forcing them to share transmission time.
Adjacent-channel interference is often more disruptive. This occurs when signals from nearby, overlapping channels interfere with each other, creating noise that corrupts data packets and forces retransmissions.
This is particularly problematic in the 2.4 GHz band. With only three non-overlapping channels (1, 6, and 11), a scan will likely reveal multiple neighbouring networks competing for the same spectrum.
A proper Wi-Fi scan shifts your strategy from reactive troubleshooting to proactive network management. Instead of guessing why performance is poor, you gain hard data to make informed decisions that directly improve connectivity.
The Business Impact of a Clean RF Environment
For any modern business, reliable wireless connectivity is essential. Slow Wi-Fi creates a ripple effect that impacts customer satisfaction and operational efficiency.
When guests in a hotel or café experience constant disconnections, it inevitably affects reviews. If staff cannot reliably use point-of-sale systems or internal applications, productivity plummets. We explore these issues further in our guide on why your Wi-Fi keeps disconnecting .
Regularly running a channels scan provides the data needed to optimise your network effectively. This data-driven approach allows you to:
- Boost Guest Satisfaction: Deliver a seamless, fast connection that enhances the visitor experience.
- Improve Staff Productivity: Ensure critical business applications run smoothly, without interruption.
- Increase Network Reliability: Minimise downtime and significantly reduce support tickets related to poor Wi-Fi.
Choosing the Right Tools for Your WiFi Scan
Once you understand the importance of a WiFi channel scan, the next step is selecting the right tool. The market offers numerous options, from free, built-in utilities to professional-grade analysers. Your choice will depend on your operating system, technical requirements, and the level of data analysis needed.
These tools generally fall into two categories: basic scanners and advanced analysers. Basic scanners provide a quick overview of nearby networks, while advanced tools offer comprehensive insights, including signal strength, noise levels, and historical performance data.
Built-in Utilities vs Dedicated Analysers
Most operating systems include a native wireless scanning feature. macOS, for example, offers Wireless Diagnostics, though it is somewhat hidden. While these built-in options are useful for quick checks, they typically lack the detailed graphs and in-depth metrics required for comprehensive troubleshooting.
This is where dedicated third-party applications excel. Tools like NetSpot , inSSIDer , and WiFi Analyzer Pro are designed specifically for network analysis. They convert complex data into clear graphs, making it easier to identify channel overlap and locate the strongest, quietest channels. For enterprise environments, a dedicated tool is essential.
The right tool translates raw data into actionable insights about your wireless environment. A robust analyser converts abstract metrics into a clear visual map, instantly highlighting interference issues that might otherwise go unnoticed.
Consider the NetSpot screenshot below. A dedicated tool visualises the signal strength of all surrounding networks on a single graph, instantly highlighting congested channels.
This visualisation makes it clear when channels in the lower 2.4 GHz range are saturated, prompting network administrators to utilise less congested frequencies.
Top Tool Recommendations by Platform
Selecting the best software often depends on your device. Features and application permissions vary significantly across Windows, macOS, and mobile operating systems.
Here is an overview of recommended tools for the most common platforms:
- For Windows: While basic information is available via the command line, it is impractical for detailed analysis. NetSpot and inSSIDer are excellent graphical tools, providing clear visualisations of channel usage and signal strength.
- For macOS: The built-in Wireless Diagnostics utility is an excellent starting point. To access it, hold the
Optionkey and click the Wi-Fi icon in the menu bar. For more advanced capabilities, NetSpot offers a robust macOS version. - For Android: The open-source nature of Android enables highly effective Wi-Fi scanning applications. WiFi Analyzer is a proven tool, offering real-time graphs of channel congestion for mobile analysis.
- For iOS: Apple's security restrictions limit application access to Wi-Fi data. While the native AirPort Utility app performs basic scans, it lacks the detailed analytics available on Android.
When selecting a tool, consider your objectives. Whether optimising a small office network or mapping a complex deployment of the best wireless access points for a large venue, your goals dictate the required level of detail.
To simplify the selection process, below is a comparison of popular options.
Comparison of Top WiFi Scanning Tools by Platform
Select the best WiFi scanning tool for your needs based on operating system, technical requirements, and key features.
Ultimately, the best tool provides actionable data. For business and enterprise scenarios, investing in a comprehensive tool like NetSpot is highly recommended. The depth of insight it offers is essential for making informed decisions and properly optimising a wireless network.
How to Perform a Wi-Fi Channels Scan on Any Device
With the right knowledge and tools, executing a Wi-Fi channel scan is straightforward. While the exact process varies by device, we will outline the approach for the most common platforms.
Before beginning, determine the most suitable tool for your operating system and objectives.
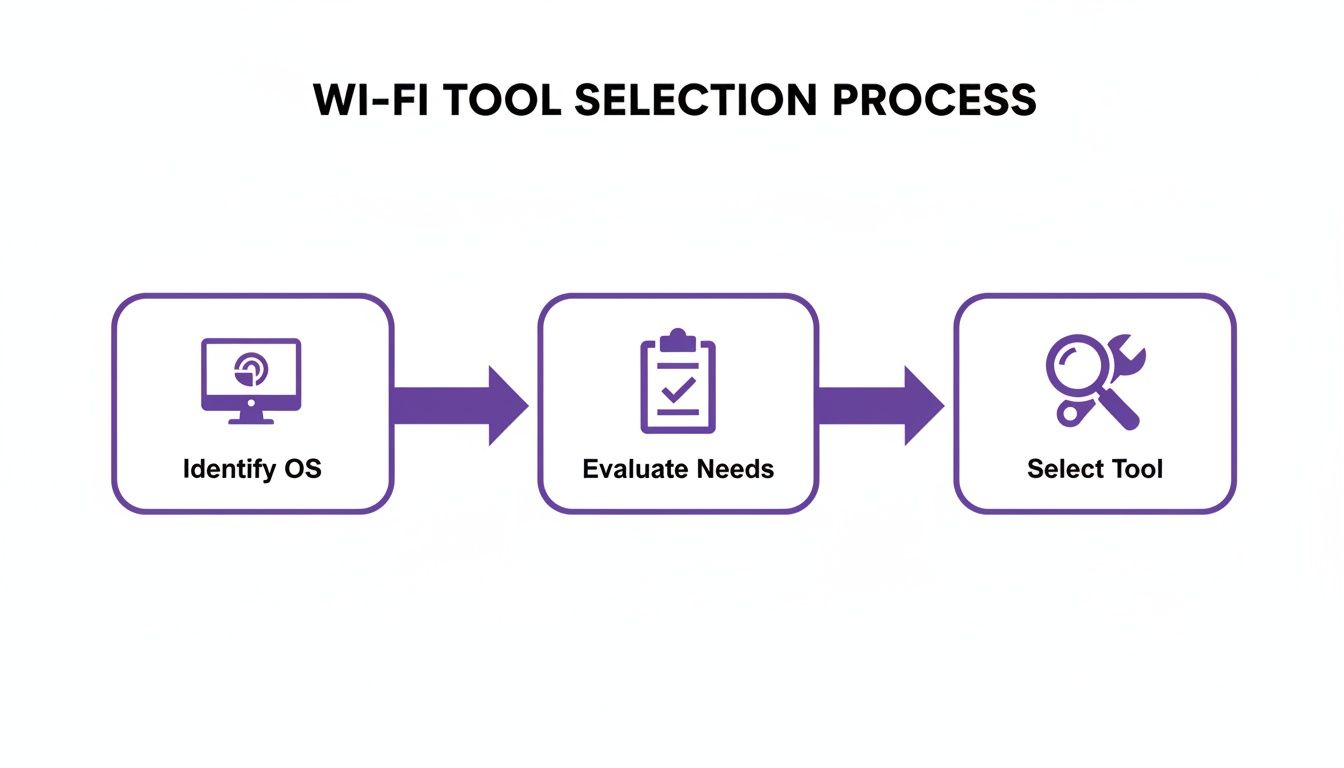
The process begins with your platform, as this determines the available tools for analysis.
Scanning on macOS with Wireless Diagnostics
Apple's macOS includes Wireless Diagnostics, a highly effective utility for detailed channel scans that provides deeper insights than the standard Wi-Fi menu.
To access it, hold the Option key and click the Wi-Fi symbol in the top menu bar to reveal a detailed dropdown. Select "Open Wireless Diagnostics". When the diagnostics window appears, navigate to the "Window" menu at the top of the screen and select "Scan".
This opens the Scan window, displaying a live list of all detectable Wi-Fi networks. It provides critical metrics including RSSI (signal strength), noise level, BSSID (the access point's unique MAC address), and the broadcasting channel.
This data allows you to identify patterns. Multiple networks occupying channel 6 in the 2.4 GHz band indicate co-channel interference. Sorting the list by channel helps quickly identify the least congested frequencies.
Using Third-Party Tools on Windows
Unlike macOS, Windows lacks a built-in graphical tool for in-depth scanning. While basic information is accessible via the command line, it is impractical for visualising the RF environment. Effective troubleshooting on Windows requires a third-party application.
Tools such as NetSpot or inSSIDer are highly recommended. These programmes display the wireless landscape graphically, typically offering a network list and a real-time graph of channel usage.
The channel graph visually maps nearby networks, displaying signal strength and channel width to easily identify congestion. For instance, strong networks overlapping on channels 3, 4, and 5 indicate adjacent-channel interference. The objective is to select a channel with minimal overlap from competing signals.
Mobile Scanning with Android Apps
Android's open architecture makes it an excellent platform for mobile analysis. Applications like WiFi Analyzer provide powerful scanning capabilities. Once installed with the necessary permissions, it offers immediate access to useful visualisations.
The Channel Graph is typically the most valuable view, displaying local networks as coloured arcs where height represents signal strength. Multiple high peaks on a single channel indicate significant congestion.
This is particularly effective for physical site surveys. Mobile scanning allows you to observe how the wireless environment changes across different areas, identifying localised interference that stationary analysis might miss.
The primary advantage of a mobile scan is evaluating the RF environment from the user's perspective, as signal quality can vary significantly between a reception area and a meeting room.
Conversely, Apple's strict security policies on iOS restrict applications from accessing the low-level Wi-Fi data required for comprehensive scans. While the AirPort Utility app offers basic scanning, detailed network troubleshooting requires an Android device, a Mac, or a Windows laptop.
Scanning in Enterprise Environments
For larger organisations, manual scanning is inefficient. Enterprise-grade equipment from vendors such as Meraki , Aruba , and Ruckus includes sophisticated, built-in RF scanning capabilities, providing a centralised overview of the entire wireless environment.
These systems utilise features such as Radio Resource Management (RRM) or Adaptive Radio Management (ARM). Access points can dedicate a radio to continuous scanning or perform periodic off-channel scans without disrupting connected clients.
This data is aggregated into a central dashboard. Network administrators can view heatmaps of channel usage across floor plans, receive automated alerts for high-interference areas, and analyse historical RF performance data.
This approach provides two significant advantages:
- Automation: The system intelligently adjusts channel plans and power levels based on real-time scan data, optimising performance automatically.
- Scale: It delivers a holistic view of the RF environment across hundreds or thousands of access points, which is impossible to replicate with individual device scans.
Utilising these built-in tools enables a shift from reactive troubleshooting to a proactive, data-driven strategy, ensuring optimal wireless network performance.
Decoding Your Scan Results to Defeat Interference
Executing a Wi-Fi channel scan is only the first step. The true value lies in translating raw data into practical changes that enhance network performance and resolve connectivity issues.
Scan results provide several metrics, but the two most critical are RSSI (Received Signal Strength Indication) and SNR (Signal-to-Noise Ratio). Understanding these is fundamental to interpreting the data.
Interpreting Signal Strength and Noise
RSSI measures how well a device receives a signal from a specific access point. It is measured in negative decibel-milliwatts (dBm), meaning numbers closer to zero indicate a stronger signal. For example, -45 dBm is an excellent signal, whereas -85 dBm renders the connection practically unusable.
However, signal strength alone is insufficient; background interference must also be considered. SNR measures the Wi-Fi signal's strength relative to ambient noise. A higher SNR indicates a cleaner, more reliable connection.
Key Takeaway: For a stable and fast Wi-Fi experience, aim for an RSSI of -67 dBm or better and an SNR of 25 dB or higher. Values below these thresholds typically result in slow speeds, dropouts, and poor user experience.
Spotting Wi-Fi Interference Visually
The most common issues identified during a channel scan are co-channel and adjacent-channel interference. A robust scanning tool generates graphs that make identifying these issues straightforward.
- Co-channel interference occurs when multiple networks attempt to use the same channel. On a graph, this appears as several overlapping peaks on a single channel number (e.g., three strong networks competing for channel 6).
- Adjacent-channel interference occurs when networks on nearby, overlapping channels interfere with one another. This is a common issue on the 2.4 GHz band, often appearing as a broad cluster of signals crowding channels 2, 3, and 4.
To resolve this congestion, select a quieter channel. The scan will highlight gaps—channels with the fewest competing networks or only weak, distant signals. For specific guidance, review our detailed article on choosing the best Wi-Fi channels on 5 GHz .
Distinguishing Non-Wi-Fi Interference
Occasionally, the source of interference is not another Wi-Fi network. Many common devices generate radio frequency (RF) noise that disrupts connectivity, particularly on the crowded 2.4 GHz band. This is known as non-Wi-Fi interference.
Common sources of non-Wi-Fi interference include:
- Microwave ovens
- Cordless phones
- Bluetooth devices
- Wireless security cameras
- Poorly shielded cables
A standard Wi-Fi scanner may not detect this interference directly, but its presence can be inferred. If a scan shows a clear channel yet users report poor performance and low SNR, non-Wi-Fi interference is highly likely. While advanced spectrum analysers can visualise this noise, standard troubleshooting relies on a process of elimination.
For example, if a café's Wi-Fi drops out whenever the kitchen microwave is used, the source of interference is clear. When analysing scan results, understanding how different technologies are designed for optimised coverage and reduced interference provides valuable insight into broader RF management strategies.
By accurately interpreting Wi-Fi scan data, you can diagnose problems effectively, make informed channel adjustments, and build a more resilient, high-performing wireless network.
Strategic Channel Planning for Optimal Performance

Having gathered raw data from the Wi-Fi channel scan, the next step is developing a robust channel plan that mitigates interference and delivers a reliable connection.
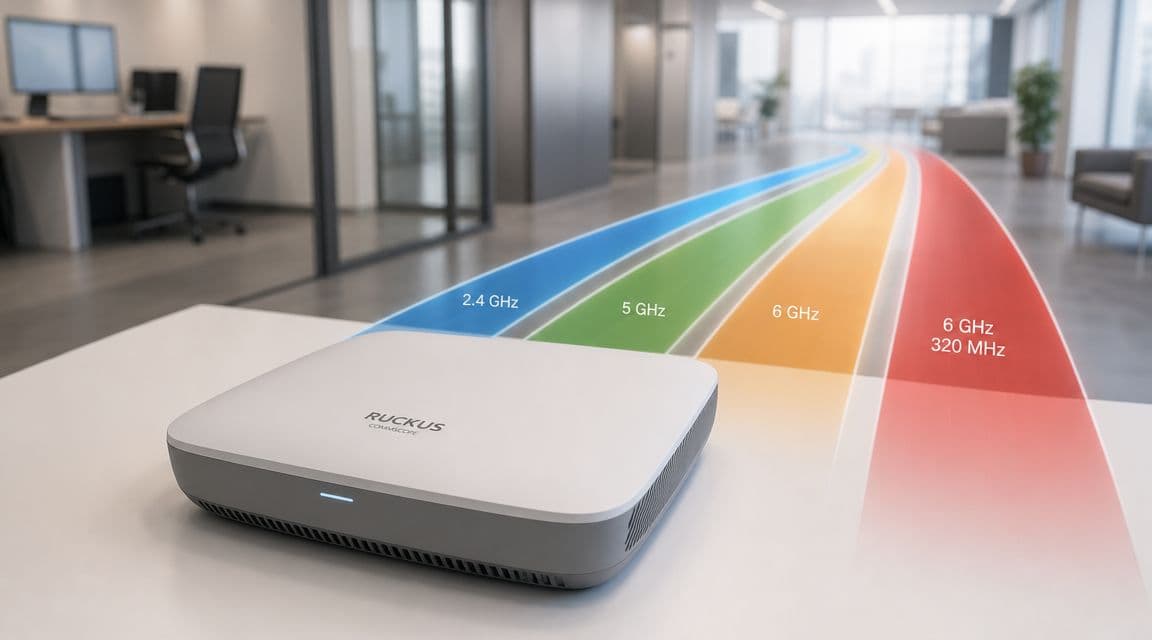
Effective planning requires understanding the characteristics of each Wi-Fi band: the congested 2.4 GHz, the broader 5 GHz, and the high-capacity 6 GHz band. A successful channel plan allocates traffic to the most appropriate frequencies based on the specific environment.
Navigating the Crowded 2.4 GHz Band
The 2.4 GHz band is highly congested, accommodating not only neighbouring Wi-Fi networks but also signals from Bluetooth devices, cordless phones, and microwaves. Scan results typically reveal significant signal overlap in this band.
Due to its channel structure, only three channels are non-overlapping: 1, 6, and 11.
Pro Tip: In professional networks, restrict usage to channels 1, 6, and 11. Utilising intermediate channels, such as 3 or 8, guarantees adjacent-channel interference, degrading performance for all nearby devices.
Scan data identifies which of these three channels has the least competition in a specific area. For buildings with multiple access points, implement a staggered plan, ensuring adjacent APs operate on different channels in a repeating pattern (e.g., 1, 6, 11, 1, 6, 11).
Leveraging the Wider 5 GHz Band
The 5 GHz band offers significantly more channels and wider data bandwidth. Crucially, all standard 5 GHz channels are non-overlapping, providing greater flexibility to avoid interference. This band is ideal for high-performance devices.
A channel scan will identify the least congested frequencies. A key strategic decision in the 5 GHz band involves Dynamic Frequency Selection (DFS) channels. These are spectrum segments typically reserved for radar systems, which Wi-Fi can utilise opportunistically when no radar is detected.
- The advantage of DFS: Utilising these channels unlocks significant clean spectrum, which is highly beneficial in dense environments such as conference centres or stadiums.
- The disadvantage of DFS: If an AP detects a radar signal, regulatory requirements mandate it immediately vacate the channel. This can cause a brief service interruption for connected clients.
For most venues, the benefit of avoiding congestion on standard channels makes enabling DFS a strategic advantage.
Embracing the 6 GHz Superhighway
The 6 GHz band (supporting Wi-Fi 6E and Wi-Fi 7) represents a significant advancement. It functions as a high-capacity motorway alongside the congested 2.4 and 5 GHz bands, offering extensive pristine spectrum free from legacy interference.
In the UK, congestion on older bands makes 6 GHz critical for future-proofing networks. Currently, 65% of industry experts view 6 GHz availability as 'important' or 'critical' to their business, driven by the proliferation of connected devices. This additional capacity supports massive 320 MHz wide channels—ideal for the high-throughput, low-latency applications required in modern venues. You can explore the full market analysis to see its implications for future connectivity.
As a newer frequency, a Wi-Fi scan will likely show the 6 GHz band as largely unoccupied. This simplifies channel planning: select a wide channel to support high-performance devices optimally.
A practical workflow for developing a channel plan includes:
- Prioritise 6 GHz: Direct compatible, high-performance devices to the 6 GHz band to ensure optimal performance.
- Optimise 5 GHz: Utilise scan data to assign APs to the least congested non-DFS and DFS channels. This band will handle the majority of network traffic.
- Use 2.4 GHz Sparingly: Reserve this band for legacy clients or low-bandwidth IoT devices, strictly adhering to channels 1, 6, and 11.
This tiered approach leverages the strengths of each band, creating a fast, resilient, and future-proof network.
Putting Scan Data to Work in Your Daily Operations
A Wi-Fi channel scan is not merely an emergency diagnostic tool; it is a foundational element of network maintenance. Integrating regular scanning into operational workflows distinguishes proactive network management from reactive troubleshooting.
The greatest value is realised when this data integrates with enterprise-grade systems. Modern network hardware from vendors such as Meraki , Aruba , and Mist actively monitors the RF environment, utilising features like Radio Resource Management (RRM) or Adaptive Radio Management (ARM).
These systems function as automated network engineers, using real-time scan data to intelligently adjust channel assignments and power levels dynamically. This automation maintains optimal RF conditions, which is essential in dynamic environments like hotels or retail centres where interference patterns fluctuate frequently.
From Clean Airwaves to Business Outcomes
A well-optimised wireless environment delivers a direct, measurable business impact. A stable network with minimal interference provides benefits extending far beyond improved browsing speeds.
- Enhanced Analytics: In retail environments, optimised Wi-Fi enables more precise footfall tracking and location analytics, providing a reliable understanding of customer behaviour.
- Improved Guest Experience: For visitors, a stable connection ensures seamless access and a positive overall impression. Reliable Wi-Fi is a critical component of customer satisfaction.
- Streamlined Operations: For staff, it ensures critical tools—such as point-of-sale systems, inventory scanners, and communication applications—function reliably without operational delays.
This is particularly critical as UK broadband infrastructure undergoes rapid modernisation. With full fibre deployment reaching 78% of UK homes, expectations for fast, reliable connectivity have increased significantly. For administrators implementing advanced security measures like passwordless authentication, a robust network backbone ensures reliable certificate-grade access, replacing older, less secure systems. You can explore more expert predictions for Wi-Fi in 2026 here .
Ultimately, regular Wi-Fi channel scanning provides the foundational data required for a resilient network. It is the first step in a data-driven approach that ensures wireless infrastructure actively supports business objectives.
By transitioning from reactive troubleshooting to embedding scanning within core operations, the network evolves into a reliable asset that enhances all digital interactions within the environment.
A robust, secure, and seamless Wi-Fi experience is a core business requirement. Purple provides an identity-based networking platform that replaces insecure passwords with zero-trust, passwordless access for guests and staff. Discover how to transform your network into a powerful tool for analytics, security, and engagement today.