

Ever wondered what those little WiFi bars on your phone really mean? They're a simple visual for a complex idea: WiFi signal strength. Getting this right is the first, most crucial step in building a wireless network that doesn't let you down.
Think of your WiFi signal like the volume of a radio. Turn it up too low, and all you get is static and dropouts. A strong, clear signal, however, delivers a perfect, uninterrupted broadcast. It's not just about being connected; it's about the quality of that connection.
Understanding WiFi Signal Strength and Why It Matters
WiFi signals are just radio waves, carrying data between your devices and your network's access points (APs). The strength of that signal dictates how quickly and reliably that data can travel. When it's weak, devices have to shout to be heard, re-transmitting data over and over, which slows everything down for everyone.
This is what causes those all-too-familiar frustrations: buffering video calls, painfully slow downloads, and connections that drop at the worst possible moment. For a business, these aren't just annoyances; they're disruptions that can cost you customers and productivity.
How We Measure WiFi Signal Strength
To get a real grip on network performance, we need to move beyond the simple "bars" on a phone. In the professional world, we use precise metrics to get an accurate picture of what's happening. The two you'll hear about most are:
dBm (decibel-milliwatts): This is the industry standard for measuring signal strength. It’s a logarithmic scale expressed in negative numbers. The key thing to remember is that the closer the number is to 0, the stronger the signal. For example, a signal of -55 dBm is much better than -80 dBm.
RSSI (Received Signal Strength Indicator): This is a more relative measurement. While it’s often what your device uses to display those signal bars, it isn't standardised across manufacturers. Two different phones in the same spot could show different RSSI values, which is why for any serious analysis, dBm is the metric that matters.
The key takeaway is simple: A lower negative number in dBm means a stronger, faster, and more reliable WiFi connection. This measurement is the foundation for diagnosing and optimising any professional wireless network.
Understanding these values is the difference between guessing and knowing. It turns the invisible world of radio waves into solid, actionable data. You no longer just know a connection is "bad"; you know exactly how bad it is and where you need to start fixing it.
What Is a Good WiFi Signal?
You don't always need a "perfect" signal, but you do need one that’s strong enough to support what your business and guests are actually doing. A connection that's fine for simple web browsing will fall apart during a high-definition video conference or when processing point-of-sale transactions.
This table translates those dBm numbers into what you can actually expect in terms of real-world performance. It’s a quick way to gauge the health of your network at a glance.
WiFi Signal Strength Quality Levels
Ultimately, aiming for a signal in the "Good" to "Excellent" range (-70 dBm or better) across your venue is the goal. This ensures that from your back office to your front entrance, every user has the fast, reliable connection they expect.
How to Properly Measure and Map Your WiFi Signal
Moving from the theoretical to the practical is where the real work of improving your wireless network begins. It’s one thing to know what a good WiFi signal strength looks like, but it’s another thing entirely to know how to measure it accurately across your entire venue. This process is less about complex radio science and more about being a detective, methodically hunting down weak spots and dead zones.
Think of it like a hotel manager walking the corridors to check for signal issues in guest rooms, or a retail operator making sure the connection in the stockroom is just as solid as it is on the shop floor. This hands-on approach turns abstract numbers like dBm into a real, tangible feel for how your network performs day-to-day. You can't fix what you can't see, and measuring your signal is the first step to making the invisible visible.
The flowchart below shows just how quickly signal strength can shift from being strong and reliable to practically unusable.
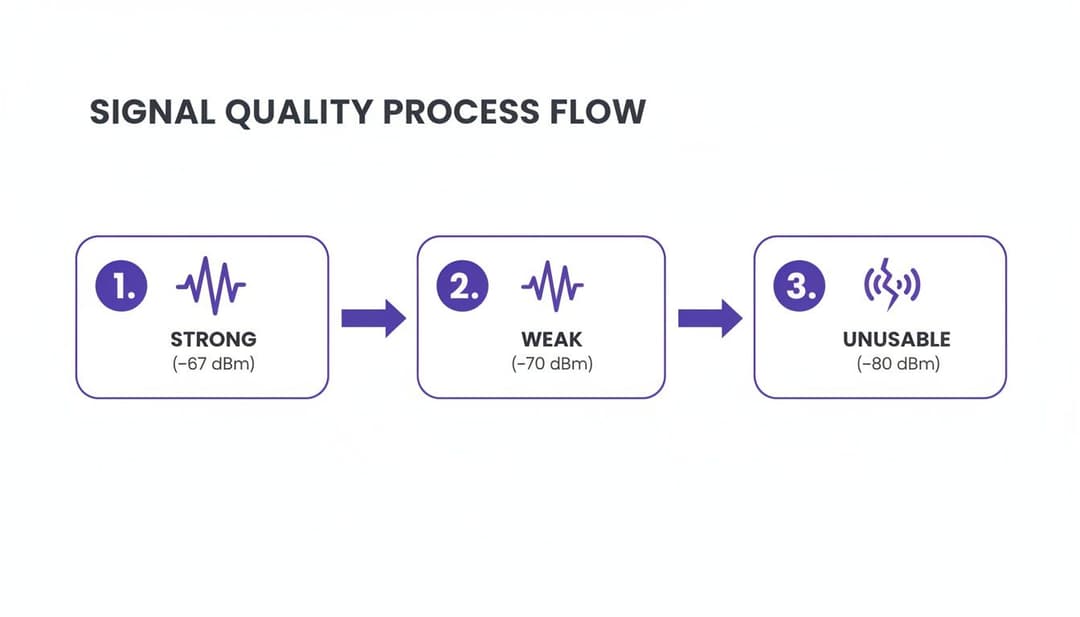
As you can see, a seemingly small drop from -67 dBm to -70 dBm is enough to push a connection from great to frustrating, which is why precise measurement is so important.
Choosing Your WiFi Measurement Tools
The good news is you don't need a degree in radio frequency engineering to get started. There’s a whole range of tools out there, from simple free apps to professional-grade hardware. The right tool for you really just depends on the size and complexity of your space.
For quick spot-checks and basic diagnostics:
- Native Device Diagnostics: Most operating systems have handy built-in tools. On a Mac, for instance, holding the Alt-Option key while you click the WiFi icon reveals a goldmine of connection details, including the RSSI and dBm value.
- Smartphone Apps: Plenty of free and paid apps for both Android and iOS can turn your phone into a surprisingly powerful signal meter. Apps like Wi-Fi Analyzer or Fing give you real-time dBm readings and can help you spot network congestion.
For comprehensive site surveys and large venues:
- Professional WiFi Analyser Software: When you need a deep dive, dedicated software on a laptop is the way to go. These tools can run active and passive surveys, measure interference, and produce detailed reports. They’re the go-to standard for network professionals designing and troubleshooting large-scale WiFi deployments.
A crucial point to remember: consistency is key. While the signal "bars" on your phone give you a rough idea, they aren't standardised between devices. For any serious measurement, always rely on dBm. It’s the consistent, accurate metric you can trust, no matter the device or manufacturer.
Creating a WiFi Heat Map
Ultimately, the goal of all this measuring is to create a visual map of your signal coverage, what’s known in the industry as a WiFi heat map. This map uses a simple colour code—usually green for strong signal and red for weak—to show you exactly where your problem areas are. It takes all the guesswork out of the equation.
A detailed heat map helps you see your network's performance in a way that raw numbers just can't match. If you want to learn more, we've got a complete guide on how to create a heat map for WiFi . This visual tool is indispensable for planning AP placement, pinpointing interference, and delivering consistent coverage everywhere. The process is pretty straightforward:
- Upload a Floor Plan: You'll start with a digital blueprint or map of your venue.
- Walk the Venue: Using a laptop or tablet with analyser software, you methodically walk the entire space, taking measurements as you go.
- Generate the Map: The software then crunches the data and overlays it onto your floor plan, creating the heat map.
With this visual guide in hand, you're no longer just guessing where the WiFi is poor. You have a clear, actionable plan to start optimising your network for peak performance.
The Most Common Causes of a Poor WiFi Signal

When your WiFi performance suddenly drops, it's rarely down to one single fault. A weak or unreliable connection is usually the result of several culprits working together. Understanding these common causes is the first step in diagnosing the problem, helping you move from frustration to a targeted fix.
Most issues fall into one of three buckets: physical barriers blocking your signal, interference from other devices creating "noise", and a poor network setup sabotaging you from the inside. By looking at each one, you can build a troubleshooter's checklist to pinpoint what’s degrading your wifi signal strength.
Physical Obstructions and Attenuation
WiFi signals are just radio waves. Like sound waves, they get weaker the further they travel and struggle to pass through solid objects. This weakening effect is called attenuation. Think of it like trying to listen to music playing in another room; a thin wooden door might only muffle the sound, but a thick concrete wall will block it almost entirely.
The same principle applies to your WiFi. Different building materials absorb and reflect radio signals to varying degrees, with dense materials being the biggest offenders.
The rule of thumb is simple: the denser the material, the more it will degrade your WiFi signal. A single concrete wall can be a signal killer, while a standard plasterboard wall might only cause a minor drop in performance.
Here are some of the most common physical barriers that get in the way:
- Concrete and Masonry: Thick concrete walls, brick, and stone are notoriously difficult for WiFi signals to penetrate. They often create dead zones on the other side.
- Metal: Large metal objects like filing cabinets, steel beams, and even some metal-tinted windows can reflect and block radio waves, creating unpredictable coverage gaps.
- Water: It might sound strange, but large bodies of water are excellent signal blockers. This includes things like aquariums in an office or even large crowds of people, since the human body is mostly water.
- Mirrors and Glass: While less of a problem than concrete, the metallic film on the back of most mirrors can reflect signals, causing them to scatter and weaken.
Signal Interference from Other Devices
Your WiFi network isn't operating in a vacuum. It has to share the airwaves with countless other devices, and many of them can cause interference. This happens when another device emits signals on the same or an adjacent frequency, effectively "drowning out" your WiFi conversation.
Interference is a common reason why your connection might suddenly slow to a crawl or drop off entirely for no obvious reason. You can learn more about the various causes by exploring our guide on why your Wi-Fi keeps disconnecting .
Some of the usual suspects for interference include:
- Microwave Ovens: Many microwaves operate on the 2.4GHz frequency, the same as a very common WiFi band. When you're heating up your lunch, they can leak radiation that severely disrupts any nearby WiFi connections.
- Cordless Phones and Baby Monitors: Older models of these household gadgets also use the 2.4GHz band and are well-known sources of constant, low-level interference.
- Bluetooth Devices: While Bluetooth is designed to coexist with WiFi, having a lot of active Bluetooth devices close to an access point can still create minor disruptions.
- Neighbouring WiFi Networks: In dense environments like office buildings or apartment blocks, dozens of other WiFi networks are all competing for the same limited channels. This creates significant congestion and noise, a problem known as co-channel interference.
Right, you've figured out why your WiFi signal is struggling. Now comes the good part: fixing it. This is your playbook for turning a weak, unreliable network into one that’s robust and ready for anything. We're not just talking about getting more bars on your device; we're talking about creating a stable wireless environment that properly supports every user in your venue.
By taking a close look at your network's design, you can make systematic improvements that genuinely enhance your WiFi signal strength. From the physical placement of hardware to the digital settings behind the scenes, every piece of the puzzle matters.
Master Your Access Point Placement
The single biggest factor affecting your WiFi coverage is where you physically put your Access Points (APs). Getting this wrong is like putting a speaker in a cupboard and expecting everyone in the room to hear the music clearly. You want to give the signal a clean, unobstructed path to the devices that need it.
To get the best performance, stick to these fundamental rules:
- Go High and Central: Mount your APs on the ceiling or high up on a wall, right in the centre of the area you want to cover. This helps the signal radiate downwards and outwards, easily bypassing common ground-level obstacles like furniture and people.
- Maintain a Clear Line of Sight: Wherever you can, make sure there's a direct line of sight between the AP and the main user areas. Steer clear of placing APs in cupboards, behind large metal objects, or above thick concrete structures.
- Think in 3D: WiFi signals travel in all directions, so don't just think horizontally. Consider the floors above and below. A single, well-placed AP can often serve multiple areas if you plan it right.
Getting AP placement right is foundational. It means you don't have to crank up the power settings—which can create its own interference problems—and ensures you're getting the most from your hardware investment.
Optimise Your WiFi Channels
Think of your WiFi network as a motorway. The 2.4GHz and 5GHz bands are the two main carriageways, and each one has multiple lanes, which we call channels. If too many networks try to cram into the same lane, you get a traffic jam. We call this co-channel interference, and it’s a massive performance killer, especially in busy venues.
A critical part of any optimisation is running a channel analysis. With a simple WiFi analyser tool, you can see which channels are clogged up by neighbouring networks and strategically move your APs to the quieter, non-overlapping ones.
On the 2.4GHz band, only channels 1, 6, and 11 don't overlap with each other. Sticking to these three is an absolute must if you want to minimise interference. The 5GHz band, on the other hand, has plenty more non-overlapping channels, making it a far better choice for high-density areas. A bit of thoughtful channel planning can make a world of difference to both speed and reliability.
Use Band Steering to Prioritise the 5GHz Band
If the 2.4GHz band is your standard motorway, the 5GHz band is the express lane. It's faster, can handle more data, and is far less congested. Band steering is a clever feature on modern APs that automatically encourages dual-band devices to connect to this superior 5GHz network.
By intelligently "steering" capable devices away from the crowded 2.4GHz band, you get a double win:
- The device that gets steered enjoys a faster, more stable connection.
- The 2.4GHz band is freed up for older, legacy devices that can only use that frequency, improving performance for them, too.
This simple tweak is a powerful way to balance the load on your network and make sure devices are always using the best connection they can. If your hardware is getting a bit long in the tooth, our guide to the best home access points can help you find modern equipment with these essential features.
As enterprise WiFi becomes more critical to business, its reliance on a stable underlying infrastructure grows. The UK mobile network landscape has seen significant evolution, with 4G now reaching 96% of the UK landmass. Market leader EE provides 4G coverage to 99% of the population and has a 5G network covering 89%. For businesses, their 5G Standalone ('5G+') network is particularly relevant, reaching 66% of the UK. This robust mobile connectivity gives IT administrators reliable backhaul options, ensuring passwordless WiFi solutions maintain consistent performance. You can discover more insights about UK mobile network coverage on MyAmplifiers.com .
If you’re only fixing poor WiFi when users start complaining, you’re already behind. This reactive approach just leads to a cycle of frustration and a mountain of support tickets. The smarter strategy is to get ahead of problems before they ever surface. That means ditching simple spot-checks of WiFi signal strength and embracing a proactive, data-driven management style.
Modern analytics platforms give you the tools to do exactly that. Instead of just reacting to "the WiFi is down" alerts, you can spot the subtle dips in performance and trends in user behaviour that signal trouble on the horizon. It's the difference between constantly fighting fires and strategically managing your network.
Using Analytics to Proactively Manage WiFi Experience
Moving Beyond Basic Signal Readings
Relying solely on dBm values is like trying to diagnose a city's traffic problems by only looking at the speed limit signs. It's useful, but it doesn't tell you the whole story. What happens when one access point is providing an excellent signal but is so overwhelmed with 500 device connections that performance grinds to a halt for everyone?
This is where a complete picture of network health becomes invaluable. By monitoring more than just the signal, you gain a deep understanding of how your network is truly performing under real-world conditions.
An analytics-first approach transforms your WiFi network from a simple utility into a strategic business asset. You stop guessing and start making informed decisions based on what is actually happening in your venue.
Advanced analytics platforms are designed to collect and interpret all the different data points that paint this richer picture, allowing you to finally connect network performance with user experience and business outcomes.
Tracking KPIs That Actually Matter
To truly manage the digital experience in your venue, you need to track Key Performance Indicators (KPIs) that link network health to user behaviour. This is where platforms like Purple's WiFi analytics provide immense value, turning raw network data into actionable business intelligence.
Instead of just seeing signal levels, you can answer critical questions:
- Footfall and Dwell Time: Which areas of your venue are the busiest, and for how long? Correlating this with signal data might reveal that your highest-traffic zone has the weakest coverage—a problem you can now proactively fix.
- User Journeys: How do visitors move through your space? Seeing that guests often lose their connection when moving from the lobby to their rooms lets you pinpoint specific APs that need adjustment.
- Device Types and Counts: Are most of your users stuck on the congested 2.4GHz band? Analytics can show you this trend, prompting you to optimise band steering to push more devices over to the faster 5GHz band.
This screenshot from Purple's analytics dashboard shows how these KPIs are visualised, making complex data easy to understand at a glance.

The dashboard instantly reveals trends in new versus returning visitors, gender demographics, and total user counts over time, giving operators a snapshot of exactly who is using their network.
Making Data-Driven Network Decisions
Armed with this deeper level of insight, you can make smarter, more effective decisions that have a real impact on user satisfaction and your business operations. The data tells you exactly where to focus your efforts and budget for the maximum return.
Here are a few real-world examples of how analytics empowers proactive network management:
- Smarter AP Upgrades: Analytics might show that the APs in your conference centre are constantly hitting their device capacity limits, even though the signal strength looks fine. This hard data justifies an upgrade to higher-capacity WiFi 6/6E access points in that specific area, not everywhere.
- Evidence-Based Capacity Planning: By understanding peak usage times and high-density zones, you can plan for future network growth based on historical data, not guesswork. If footfall in your retail store's new extension is 30% higher than anticipated, you have the evidence you need to deploy additional APs.
- Optimised Resource Allocation: For multi-tenant venues like a shopping centre or office building, analytics can show which tenants are consuming the most bandwidth. This allows you to fairly allocate resources and even create tiered service levels, ensuring one high-usage tenant doesn't degrade the experience for everyone else.
By using a powerful analytics platform, you can finally connect the dots between WiFi signal strength, network capacity, and the real-world digital experience you deliver to every user. This proactive approach reduces support costs, boosts satisfaction, and turns your WiFi into a reliable asset you can build on.
Your WiFi Signal Strength Questions Answered
Even with a solid grasp of what causes poor WiFi, you're bound to run into specific questions. We hear them all the time. This section tackles the most common queries head-on, helping you clear up any confusion about how your wireless network really performs.
Does WiFi Signal Strength Directly Affect Internet Speed?
Yes, without a doubt. A weak WiFi signal is one of the biggest culprits behind slow internet speeds. It's a classic bottleneck problem happening right inside your own venue.
Think of it like trying to have a clear conversation across a loud, crowded room. Even if you're speaking perfectly clearly (your fast internet plan), the person on the other end will only catch bits and pieces if they can't hear you well (a weak signal). Your devices and access points have to constantly repeat themselves, re-sending data packets that get lost. This back-and-forth chatter massively increases latency and brings everything to a crawl.
For anything that needs a robust connection—like 4K video streaming, big file transfers, or lag-free video calls—a strong, stable signal is non-negotiable. Without it, you’ll never see the performance you’re paying your internet provider for, no matter how fast your plan is.
What Is a Good dBm Value for WiFi?
In today's connected world, anything stronger than -67 dBm is considered a great signal. At this level, you can expect every online activity, including demanding high-definition streaming and voice calls, to run without a hitch.
Here’s a quick guide to what you can realistically expect at different signal levels:
- -67 dBm to -70 dBm: This is the sweet spot for a reliable connection. You should aim for this as a minimum to ensure dependable web browsing, email, and most business tasks work flawlessly.
- -71 dBm to -80 dBm: Now you’re in the poor range. Your connection will feel shaky, with noticeable lag during video calls and the risk of dropouts. Basic web browsing might work, but the experience won't be great.
- Below -80 dBm: At this point, the connection is practically unusable. Devices will fight to stay connected, leading to constant disconnects and making it impossible to perform even the simplest online tasks.
While some devices show RSSI values, these aren't standardised across manufacturers. For accurate network planning and troubleshooting, dBm is the industry-standard metric that professionals rely on.
Can Too Many Devices Weaken the WiFi Signal?
This is a common misconception. Having too many devices on the network doesn't technically weaken the signal strength itself—a dBm reading won't change. What it does is crush the network’s performance, which to an end-user, feels exactly the same.
The real issue here is congestion and capacity, not signal. Imagine a single librarian trying to help fifty people at once. The librarian's voice (the signal) is just as strong, but their attention is so divided that nobody gets a quick answer. An access point works in a similar way; it only has so much bandwidth and processing power to go around.
When too many devices try to "talk" at the same time, the network gets gridlocked. Each device has to wait its turn to send and receive data, creating huge slowdowns and high latency for everyone. This is precisely why smart capacity planning and using modern standards like WiFi 6/6E are vital in high-density places like hotels, retail centres, and busy offices.
How Can Purple Help Manage WiFi in Large Venues?
Purple gives you a central command centre for managing the entire WiFi experience, whether it's across a huge stadium or hundreds of retail locations. We go beyond just monitoring signal strength to give you deep operational intelligence.
Instead of just getting an alert that a signal is weak, Purple’s platform shows you exactly how people are using your space. You can see which areas have high footfall but poor coverage, letting you add or move access points before users start complaining. This shifts your network management from a reactive chore to a proactive, data-driven strategy.
For multi-tenant buildings, features like individual secure networks give each business or resident their own private, isolated connection. This stops cross-tenant interference and delivers either a secure, segmented network for businesses or a reliable, home-like experience for residents. By combining detailed network insight with powerful user analytics, Purple helps operators provide a consistently brilliant WiFi service that improves the customer experience and drives business goals.
Ready to stop guessing and start making data-driven decisions about your WiFi? Purple provides the analytics and secure, passwordless access you need to optimise your network and understand your users. Learn more about Purple .