रिटेल के लिए वास्तव में मायने रखने वाले WiFi एनालिटिक्स मेट्रिक्स
यह आधिकारिक संदर्भ मार्गदर्शिका उन पाँच WiFi एनालिटिक्स मेट्रिक्स का विवरण देती है जो सीधे रिटेल राजस्व, ठहरने के समय (dwell time) और ग्राहक वफादारी से संबंधित हैं। यह IT प्रबंधकों और वेन्यू संचालन निदेशकों को नेटवर्क हार्डवेयर को कॉन्फ़िगर करने, MAC रैंडमाइज़ेशन के प्रभावों को कम करने और मार्केटिंग टीमों के साथ एक एकीकृत डेटा डैशबोर्ड पर संरेखित करने के लिए एक व्यावहारिक ढाँचा प्रदान करती है।
🎧 Listen to this Guide
View Transcript

कार्यकारी सारांश
रिटेल, हॉस्पिटैलिटी और बड़े पैमाने के वेन्यू में IT प्रबंधकों और वेन्यू संचालन निदेशकों के लिए, WiFi अब केवल एक कनेक्टिविटी यूटिलिटी नहीं है; यह भौतिक स्थानों के लिए प्राथमिक सेंसर नेटवर्क है। हालांकि, अधिकांश नेटवर्क प्रबंधन प्रणालियों द्वारा प्रदान किए गए डिफ़ॉल्ट मेट्रिक्स—जैसे कुल खपत बैंडविड्थ या पीक समवर्ती कनेक्शन—सीमित व्यावसायिक बुद्धिमत्ता प्रदान करते हैं। मापने योग्य ROI प्राप्त करने के लिए, IT और मार्केटिंग टीमों को उन मेट्रिक्स पर संरेखित होना चाहिए जो ग्राहक व्यवहार से संबंधित हैं: फुटफॉल, ठहरने का समय (dwell time), सहभागिता दर (engagement rate), दोहराई गई विज़िट कोहॉर्ट्स और राजस्व सहसंबंध।
यह मार्गदर्शिका दिखावटी मेट्रिक्स को छोड़कर उन WiFi एनालिटिक्स प्रमुख प्रदर्शन संकेतकों (KPIs) पर ध्यान केंद्रित करती है जो रिटेल के लिए वास्तव में मायने रखते हैं। यह एक्सेस पॉइंट (APs) को सटीक ज़ोन-स्तरीय डेटा कैप्चर करने, MAC एड्रेस रैंडमाइज़ेशन के प्रभाव को कम करने और WiFi एनालिटिक्स को पॉइंट ऑफ़ सेल (POS) और ग्राहक संबंध प्रबंधन (CRM) प्रणालियों के साथ एकीकृत करने के लिए एक तकनीकी ढाँचा प्रदान करती है। बुनियादी नेटवर्क निगरानी से उन्नत WiFi Analytics में संक्रमण करके, संचालन निदेशक अपने बुनियादी ढाँचे को राजस्व-उत्पादक संपत्ति में बदल सकते हैं।
इन अवधारणाओं के कार्यकारी अवलोकन के लिए साथी ऑडियो ब्रीफिंग सुनें:
तकनीकी गहन-विश्लेषण: पाँच मेट्रिक्स जो मायने रखते हैं
रिटेल वातावरण के लिए Guest WiFi प्लेटफॉर्म का मूल्यांकन करते समय, ध्यान नेटवर्क क्षमता से ग्राहक बुद्धिमत्ता की ओर स्थानांतरित होना चाहिए। निम्नलिखित पाँच मेट्रिक्स एक परिपक्व रिटेल एनालिटिक्स रणनीति की नींव बनाते हैं।
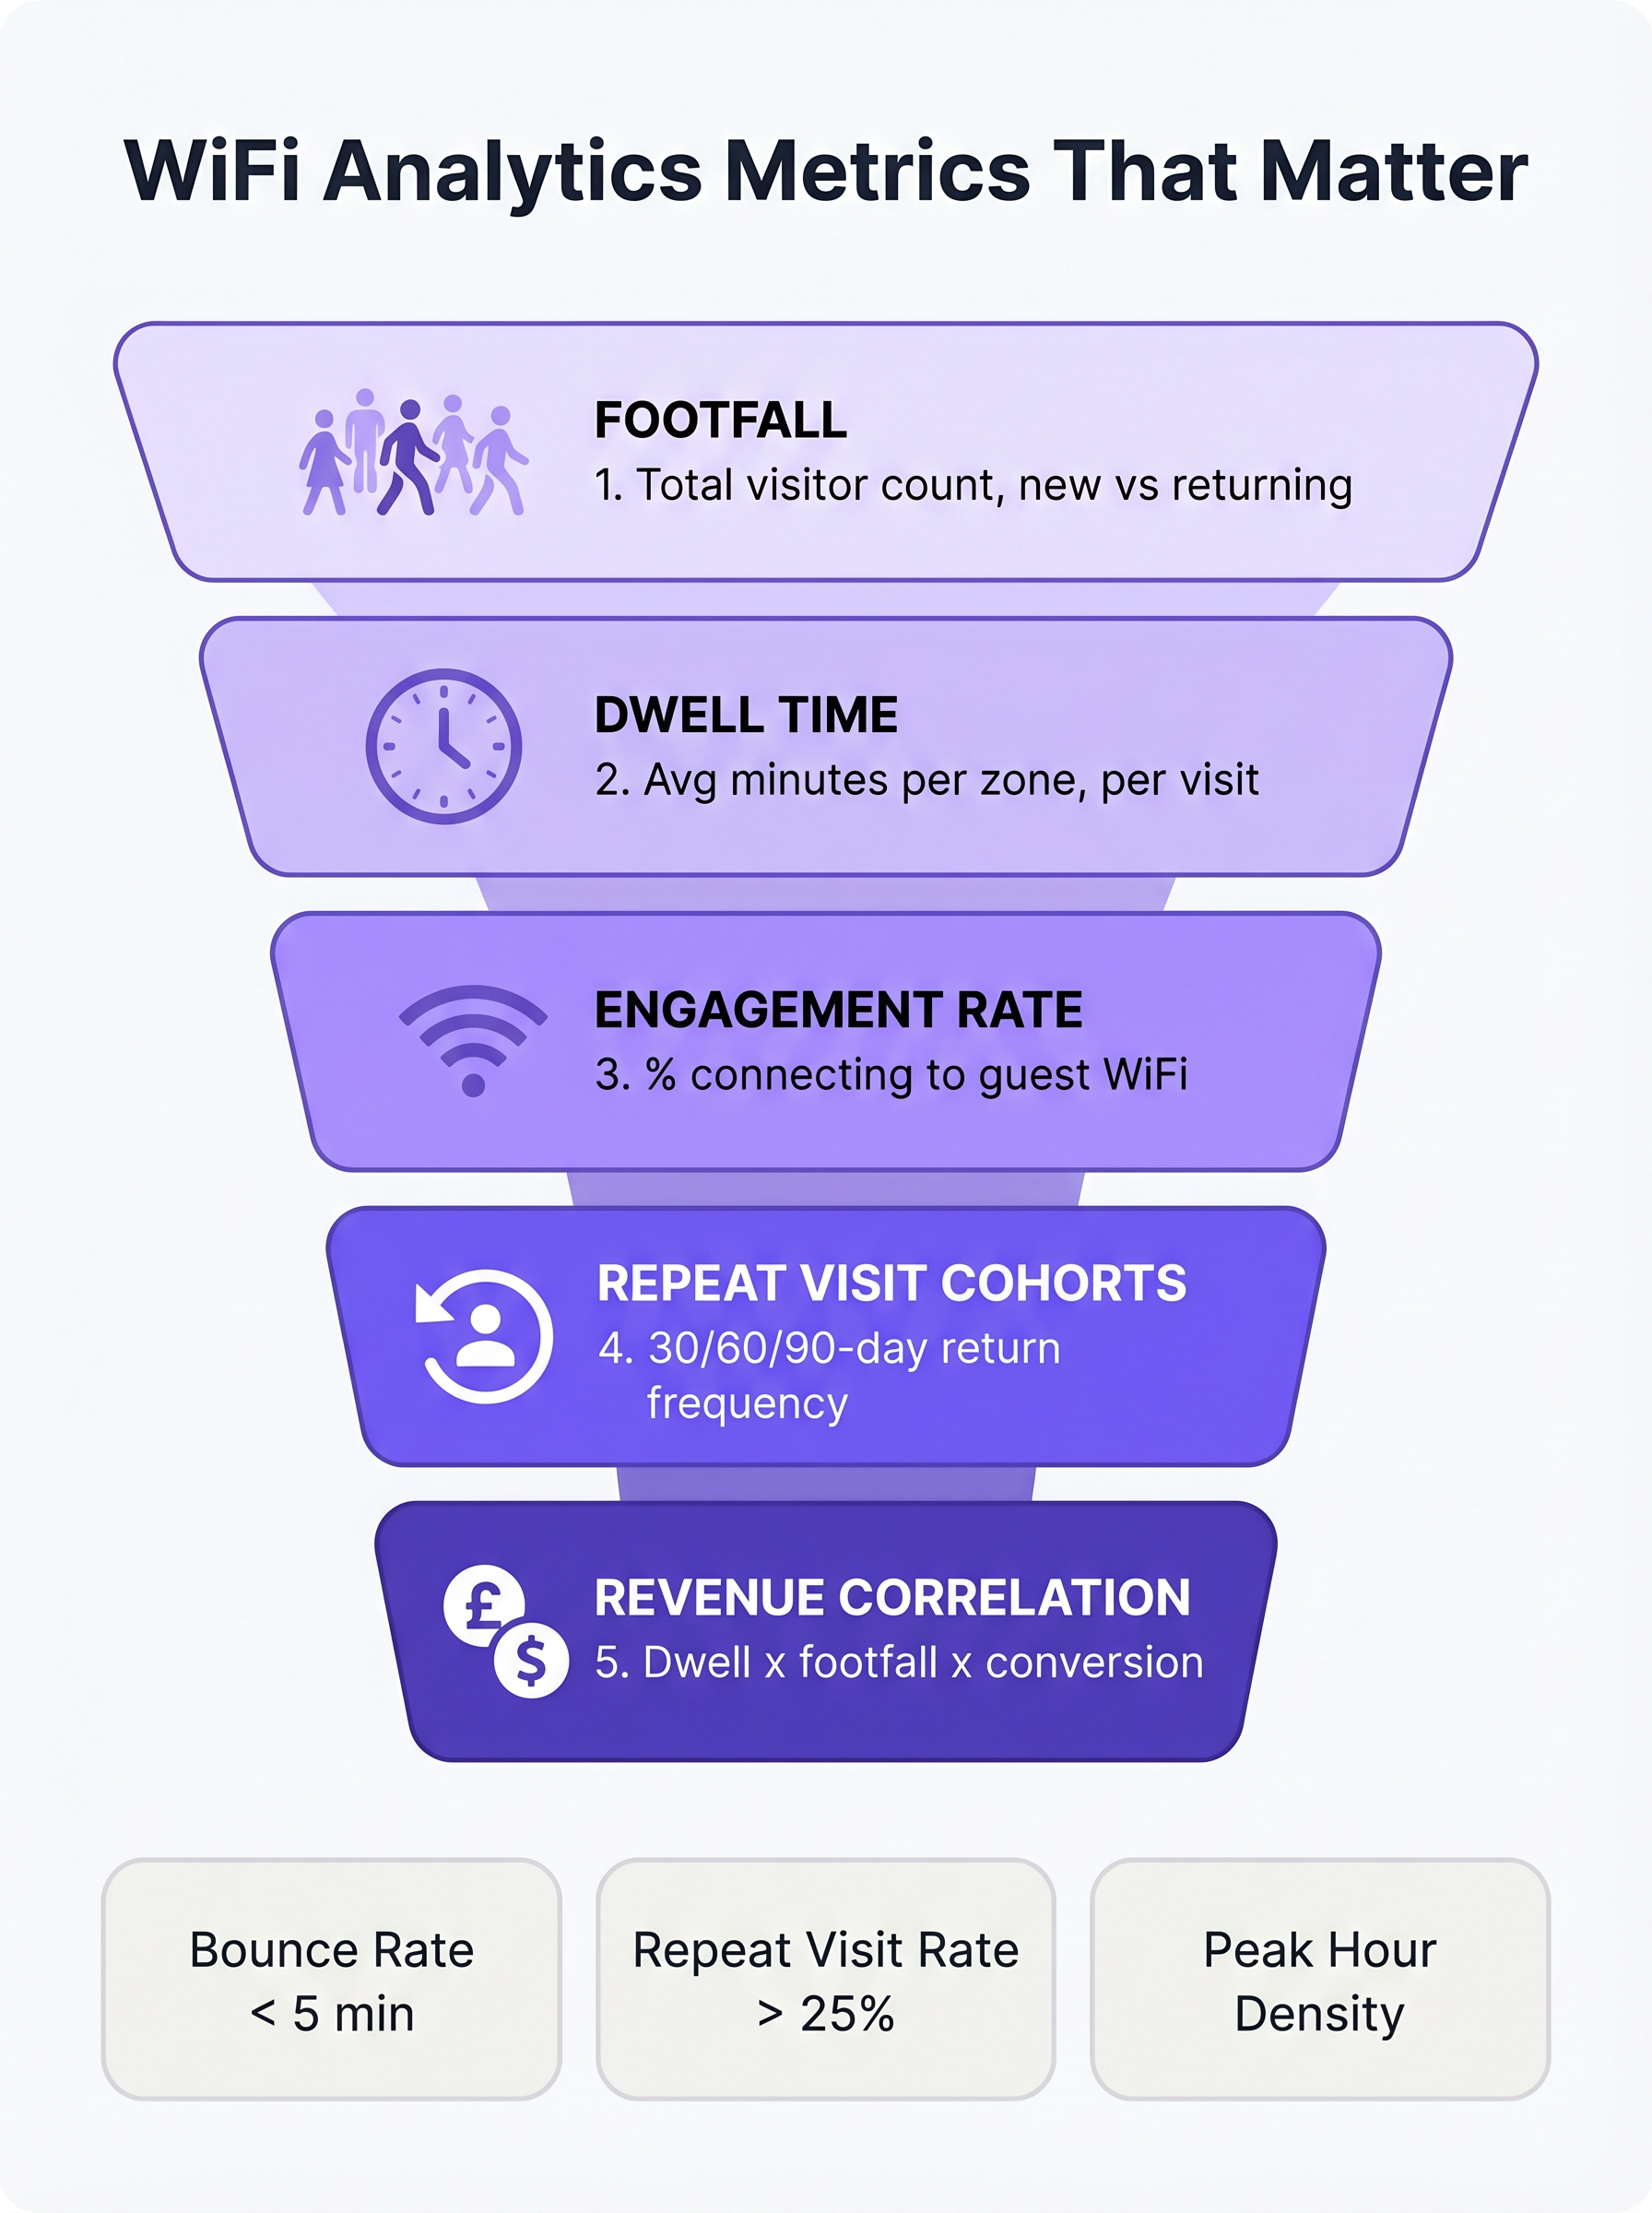
1. फुटफॉल: साधारण कनेक्शन गणना से परे
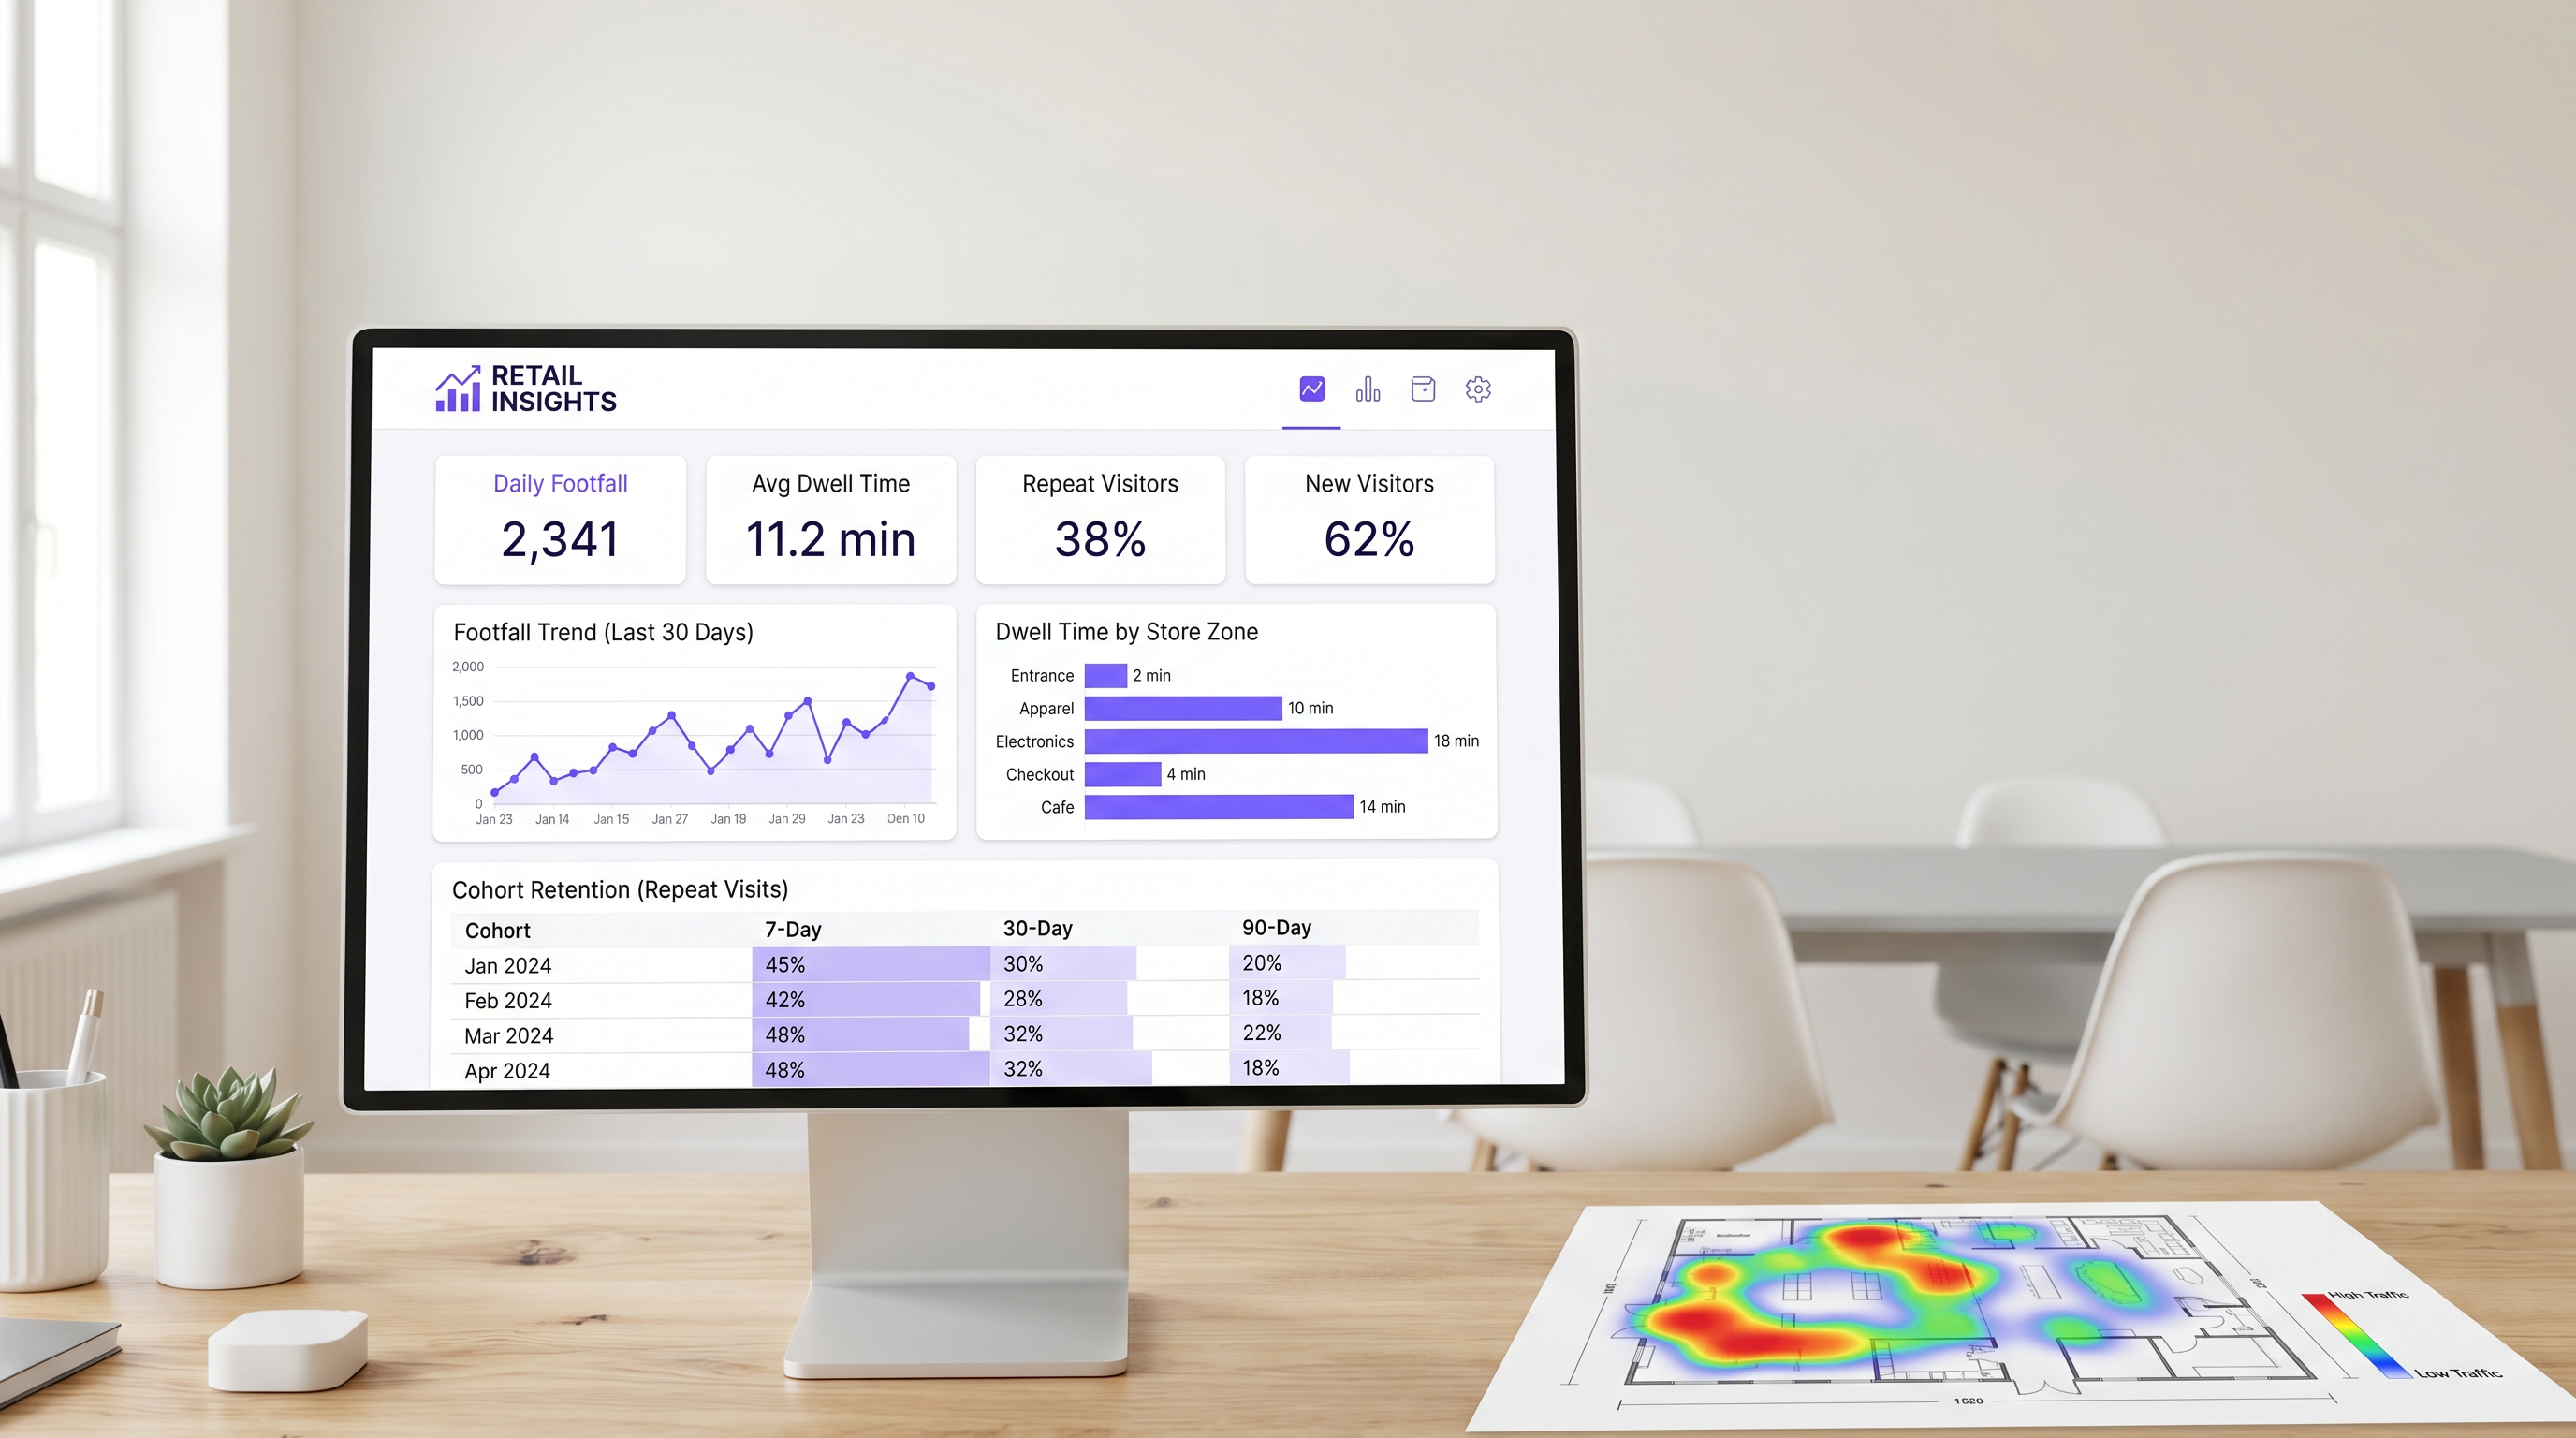
WiFi एनालिटिक्स के संदर्भ में, फुटफॉल एक विशिष्ट समय अवधि में एक वेन्यू के भीतर पता लगाए गए अद्वितीय उपकरणों की संख्या है। महत्वपूर्ण रूप से, एंटरप्राइज़ प्लेटफ़ॉर्म निष्क्रिय प्रोब डिटेक्शन का उपयोग उन उपकरणों की पहचान करने के लिए करते हैं, भले ही वे नेटवर्क पर प्रमाणित न हों। यह केवल प्रमाणित सत्रों पर निर्भर रहने की तुलना में कुल वेन्यू ट्रैफ़िक का काफी अधिक सटीक प्रतिनिधित्व प्रदान करता है।
फुटफॉल के भीतर सबसे महत्वपूर्ण उप-मेट्रिक नए और लौटने वाले आगंतुकों के बीच का अंतर है। नए आगंतुकों का उच्च अनुपात प्रभावी टॉप-ऑफ़-फ़नल मार्केटिंग या एक प्रमुख स्थान को इंगित करता है, जबकि एक मजबूत लौटने वाले आगंतुक दर ग्राहक वफादारी और प्रतिधारण को प्रदर्शित करती है।
2. ठहरने का समय (Dwell Time): बास्केट साइज़ का प्राथमिक चालक
ठहरने का समय (Dwell time) उस अवधि को मापता है जब कोई डिवाइस वेन्यू या एक विशिष्ट पहचान क्षेत्र के भीतर रहता है। रिटेल में, ठहरने का समय (dwell time) लगातार लेनदेन मूल्य के सबसे मजबूत भविष्यवक्ताओं में से एक है।
ठहरने के समय (dwell time) को प्रभावी ढंग से मापने के लिए, IT टीमों को नेटवर्क को तीन प्राथमिक आगंतुक स्थितियों के बीच अंतर करने के लिए कॉन्फ़िगर करना होगा:
- बाउंस (5 मिनट से कम): आगंतुक ने वेन्यू में प्रवेश किया लेकिन सहभागिता नहीं की।
- ब्राउज़ (5-15 मिनट): आगंतुक सक्रिय रूप से रिटेल वातावरण की खोज कर रहा है।
- सहभागी (15 मिनट से अधिक): आगंतुक अत्यधिक सहभागी है, हालांकि विशिष्ट क्षेत्रों में अत्यधिक ठहरने का समय (जैसे, चेकआउट क्षेत्र) परिचालन घर्षण का संकेत दे सकता है।
ज़ोन-स्तरीय ठहरने का समय (dwell time) विशेष रूप से मूल्यवान है। विशिष्ट क्षेत्रों (जैसे, प्रवेश द्वार, परिधान, इलेक्ट्रॉनिक्स, चेकआउट) में APs और Sensors को रणनीतिक रूप से तैनात करके, संचालन निदेशक ठीक-ठीक पता लगा सकते हैं कि ग्राहक अपना समय कहाँ बिताते हैं।
3. सहभागिता दर (Engagement Rate): डेटा कैप्चर फ़नल
सहभागिता दर (Engagement rate) पता लगाए गए उपकरणों का वह प्रतिशत है जो कैप्टिव पोर्टल के माध्यम से गेस्ट नेटवर्क पर सफलतापूर्वक प्रमाणित होते हैं। यह मेट्रिक गुमनाम डिवाइस ट्रैकिंग से पहचाने गए ग्राहक प्रोफाइलिंग में संक्रमण का प्रतिनिधित्व करती है।
एक घर्षण-रहित प्रमाणीकरण प्रवाह—सोशल लॉगिन, ईमेल कैप्चर, या OpenRoaming जैसे सहज पहचान प्रदाताओं का उपयोग करना—सहभागिता को अधिकतम करने के लिए आवश्यक है। रिटेल वातावरण में, एक अच्छी तरह से अनुकूलित कैप्टिव पोर्टल को 25% से 40% की सहभागिता दर (engagement rate) प्राप्त करनी चाहिए। लंबे प्राकृतिक ठहरने के समय (dwell times) वाले वेन्यू, जैसे Hospitality या Transport हब, आमतौर पर और भी उच्च रूपांतरण दर देखते हैं।
4. दोहराई गई विज़िट कोहॉर्ट्स: सच्ची वफादारी को मापना
कोहॉर्ट विश्लेषण आगंतुकों को उनकी पहली विज़िट की समय अवधि (जैसे, जनवरी 2025) के आधार पर समूहित करता है और बाद के अंतरालों (आमतौर पर 7, 30 और 90 दिन) में उनकी वापसी आवृत्ति को ट्रैक करता है। यह ग्राहक प्रतिधारण का एक मजबूत माप प्रदान करता है जो पूरी तरह से नेटवर्क डेटा से प्राप्त होता है, जिसमें एक अलग वफादारी एप्लिकेशन की आवश्यकता नहीं होती है।
सुविधा Retail के लिए, एक स्वस्थ 7-दिवसीय वापसी दर आमतौर पर 30% और 45% के बीच होती है। सामान्य व्यापार के लिए, यह आंकड़ा 15% से 25% के करीब है। यदि 90-दिवसीय प्रतिधारण 10% से नीचे गिरता है, तो वेन्यू को एक प्रणालीगत वफादारी चुनौती का सामना करना पड़ता है।
5. राजस्व सहसंबंध: IT और मार्केटिंग को जोड़ना
WiFi एनालिटिक्स का अंतिम लक्ष्य नेटवर्क डेटा को वित्तीय प्रदर्शन के साथ सहसंबंधित करना है। मानक APIs के माध्यम से WiFi प्लेटफॉर्म को POS प्रणालियों के साथ एकीकृत करके, संचालन टीमें रूपांतरण दरों और औसत लेनदेन मूल्यों के मुकाबले फुटफॉल और ठहरने के समय (dwell time) को मैप कर सकती हैं।
जब फुटफॉल बढ़ता है लेकिन राजस्व सपाट रहता है, तो समस्या रूपांतरण में निहित होती है। जब ठहरने का समय (dwell time) घटता है, तो राजस्व आमतौर पर हफ्तों के भीतर घट जाता है। यह समग्र मेट्रिक स्टोर प्रदर्शन के लिए एक अग्रणी संकेतक के रूप में कार्य करता है, जिससे सक्रिय परिचालन समायोजन की अनुमति मिलती है।
कार्यान्वयन मार्गदर्शिका: आर्किटेक्चर एकd परिनियोजन
एक WiFi एनालिटिक्स समाधान को परिनियोजित करने के लिए नेटवर्क डिज़ाइन दर्शन में एक मौलिक बदलाव की आवश्यकता होती है। IT टीमों को केवल कवरेज के लिए नहीं, बल्कि डेटा कैप्चर के लिए डिज़ाइन करना चाहिए।
ज़ोन डिटेक्शन के लिए एक्सेस पॉइंट प्लेसमेंट
मानक कवरेज-आधारित नेटवर्क डिज़ाइन अक्सर सिग्नल प्रसार को अधिकतम करने के लिए APs को केंद्रीय स्थानों पर रखता है। हालांकि, ज़ोन-स्तर के ठहरने के समय को सटीक रूप से मापने के लिए, APs को विशिष्ट डिटेक्शन बाउंड्री बनाने के लिए स्थित किया जाना चाहिए। यह अक्सर APs के उच्च घनत्व की आवश्यकता होती है, विशेष रूप से बड़े प्रारूप वाले खुदरा वातावरण में।
स्थापना से पहले, नेटवर्क आर्किटेक्ट्स को प्रस्तावित AP स्थानों को स्टोर की मर्चेंडाइजिंग योजना पर ओवरले करना चाहिए। यह सुनिश्चित करता है कि परिणामी डेटा व्यवसाय के परिचालन क्षेत्रों के साथ संरेखित हो।
MAC एड्रेस रैंडमाइजेशन को कम करना
आधुनिक मोबाइल ऑपरेटिंग सिस्टम (iOS 14+ और Android 10+) उपयोगकर्ता गोपनीयता की रक्षा के लिए MAC एड्रेस रैंडमाइजेशन लागू करते हैं। जब कोई डिवाइस नेटवर्क के लिए जांच करता है, तो वह अपने वास्तविक हार्डवेयर एड्रेस के बजाय एक अस्थायी, रैंडमाइज्ड MAC एड्रेस का उपयोग करता है।
सटीक फुटफॉल और कोहोर्ट डेटा बनाए रखने के लिए, एंटरप्राइज़ WiFi प्लेटफॉर्म को परिष्कृत सांख्यिकीय सामान्यीकरण तकनीकों का उपयोग करना चाहिए और प्रमाणित सत्र डेटा पर बहुत अधिक निर्भर रहना चाहिए। जब कोई उपयोगकर्ता Captive Portal के माध्यम से प्रमाणित होता है, तो प्लेटफॉर्म रैंडमाइज्ड MAC एड्रेस को एक स्थायी उपयोगकर्ता प्रोफ़ाइल से जोड़ सकता है, जिससे विज़िट में निरंतरता सुनिश्चित होती है। गोपनीयता फ्रेमवर्क पर अधिक जानकारी के लिए, CCPA vs GDPR: Guest WiFi डेटा के लिए वैश्विक गोपनीयता अनुपालन पर हमारी मार्गदर्शिका देखें।
सर्वोत्तम अभ्यास और समस्या निवारण
IT और मार्केटिंग को संरेखित करना
WiFi एनालिटिक्स परिनियोजन के लिए सबसे आम विफलता मोड IT और मार्केटिंग के बीच संरेखण की कमी है। यह सुनिश्चित करने के लिए कि प्लेटफॉर्म मापने योग्य ROI प्रदान करता है (देखें गेस्ट WiFi पर ROI मापना: CMOs के लिए एक फ्रेमवर्क ), दोनों टीमों को परिनियोजन से पहले एक एकीकृत KPI डैशबोर्ड पर सहमत होना चाहिए। IT डेटा कैप्चर की सटीकता के लिए जिम्मेदार है, जबकि मार्केटिंग अंतर्दृष्टि के आधार पर अभियानों को निष्पादित करने के लिए जिम्मेदार है।
नेटवर्क प्रदर्शन और SD-WAN
जैसे-जैसे खुदरा वातावरण क्लाउड-आधारित एनालिटिक्स और POS एकीकरण पर तेजी से निर्भर होता जा रहा है, अंतर्निहित वाइड एरिया नेटवर्क (WAN) मजबूत और लचीला होना चाहिए। एक सॉफ्टवेयर-डिफाइंड WAN (SD-WAN) आर्किटेक्चर को लागू करने से यह सुनिश्चित होता है कि महत्वपूर्ण एनालिटिक्स डेटा और प्रमाणीकरण ट्रैफ़िक को सामान्य गेस्ट इंटरनेट एक्सेस पर प्राथमिकता दी जाती है। नेटवर्क आर्किटेक्चर में गहराई से जानने के लिए, आधुनिक व्यवसायों के लिए कोर SD WAN लाभ की समीक्षा करें।
Key Terms & Definitions
Passive Probe Detection
The ability of a WiFi access point to detect devices that are searching for networks, even if those devices do not connect to the guest WiFi.
Essential for accurate footfall measurement, as it captures the 60-70% of visitors who do not actively authenticate to the network.
MAC Address Randomisation
A privacy feature in modern mobile OSs that generates a temporary hardware address when probing for networks, preventing persistent tracking of unauthenticated devices.
Forces IT teams to rely on sophisticated statistical normalisation and authenticated session data to maintain accurate cohort and repeat visit metrics.
Captive Portal
A web page that users are required to view and interact with before being granted access to a public WiFi network.
The primary data capture mechanism for marketing teams, transitioning anonymous devices into identified customer profiles.
Zone-Level Dwell Time
The measurement of how long a detected device remains within a specific, defined physical area of a venue (e.g., the checkout queue or a specific department).
Requires precise AP placement and RSSI calibration, but provides the most actionable data for store operations and merchandising teams.
Cohort Analysis
A method of grouping visitors based on the date of their first visit and tracking their subsequent return rates over 7, 30, and 90-day intervals.
Provides a network-derived measure of customer loyalty and retention without requiring a dedicated mobile application or loyalty card.
Engagement Rate
The percentage of total detected devices (footfall) that successfully authenticate and connect to the guest WiFi network.
A critical metric for evaluating the effectiveness and user experience of the captive portal.
RSSI (Received Signal Strength Indicator)
A measurement of the power present in a received radio signal.
Used by analytics platforms to estimate the distance of a device from an access point and determine which physical zone the device is located in.
OpenRoaming
A standard that allows users to seamlessly and securely connect to participating guest WiFi networks using a persistent identity profile.
Reduces authentication friction, significantly increasing the engagement rate and providing highly accurate, persistent user data.
Case Studies
A 50,000 sq ft big-box retailer is deploying a new WiFi network and wants to measure dwell time specifically in their high-margin electronics department versus their low-margin homewares department. How should the IT team approach the deployment?
The IT team must abandon a pure coverage-based design. Instead of placing APs centrally for maximum range, they should deploy directional antennas or lower-power APs specifically targeted at the electronics and homewares zones to create distinct RF boundaries. They must configure the WiFi analytics platform to define these areas as separate tracking zones. Once deployed, they should conduct a physical walk-through with a test device to calibrate the Received Signal Strength Indicator (RSSI) thresholds that define when a device transitions from one zone to another.
A stadium operations director notes that while their total detected footfall is 40,000 per match, their captive portal engagement rate is only 8%. How can the IT and marketing teams collaborate to improve this metric?
The low engagement rate suggests friction in the authentication process or a lack of perceived value. The IT team should review the captive portal architecture to ensure it supports seamless authentication methods, such as social login or profile-based authentication (e.g., OpenRoaming). Simultaneously, the marketing team should update the portal design to clearly communicate the value exchange—for example, offering in-seat ordering or exclusive replays in exchange for authentication. Furthermore, the IT team should ensure the captive portal loads rapidly, even under high concurrent user load.
Scenario Analysis
Q1. Your marketing director complains that the 'Repeat Visitor' metric on the dashboard dropped suddenly last month, despite store sales remaining stable. What is the most likely technical cause?
💡 Hint:Consider recent changes to mobile operating systems and how devices probe for networks.
Show Recommended Approach
The most likely cause is an OS update that increased the prevalence or aggression of MAC address randomisation. If the analytics platform relies heavily on passive probe data without robust statistical normalisation, randomised MACs will appear as 'New Visitors' rather than 'Returning Visitors'. The IT team should verify the platform's normalisation algorithms and work to increase the captive portal engagement rate to capture more authenticated, persistent sessions.
Q2. A retail chain wants to measure the conversion rate of their window displays. They place an AP right at the entrance. The data shows high footfall but an average dwell time of only 45 seconds. How should operations interpret this?
💡 Hint:Differentiate between venue-level dwell time and zone-level dwell time.
Show Recommended Approach
This indicates a high 'bounce rate'. Customers are entering the detection zone (the entrance) but not proceeding further into the store. The window display is successfully generating initial interest (footfall), but the immediate in-store experience is failing to convert that interest into a 'browse' state. Operations should evaluate the store layout immediately inside the entrance to remove friction or improve merchandising.
Q3. You are designing the network for a new flagship store. Marketing requires precise dwell time data for five specific departments. How does this requirement change your hardware deployment strategy compared to a standard office deployment?
💡 Hint:Think about the difference between designing for coverage versus designing for location accuracy.
Show Recommended Approach
A standard office deployment focuses on providing adequate signal coverage with the minimum number of APs. To provide precise zone-level analytics, the deployment must focus on location accuracy. This requires a higher density of APs to create overlapping detection zones, allowing the system to use RSSI triangulation to pinpoint device locations accurately. You may also need to deploy Bluetooth Low Energy (BLE) beacons or dedicated sensors to augment the WiFi data in highly granular zones.
Key Takeaways
- ✓Focus on the five metrics that matter: Footfall, Dwell Time, Engagement Rate, Repeat Visit Cohorts, and Revenue Correlation.
- ✓Passive probe detection captures 60-70% more footfall data than relying on authenticated connections alone.
- ✓Dwell time is a primary driver of basket size; customers staying over 8 minutes spend 2-3x more.
- ✓Design your AP layout to create distinct RF boundaries for accurate zone-level analytics, not just maximum coverage.
- ✓Mitigate MAC address randomisation by optimising your captive portal to increase the engagement rate and capture authenticated sessions.
- ✓Align IT and marketing on a shared KPI dashboard before deployment to ensure the platform delivers measurable ROI.
