Metriche di WiFi Analytics che contano davvero per il Retail
Questa guida di riferimento autorevole illustra le cinque metriche di WiFi analytics che correlano direttamente con i ricavi del retail, il dwell time e la fedeltà del cliente. Fornisce ai responsabili IT e ai direttori delle operazioni delle sedi un framework pratico per la configurazione dell'hardware di rete, la mitigazione degli impatti della randomizzazione MAC e l'allineamento con i team di marketing su una dashboard dati unificata.
🎧 Ascolta questa guida
Visualizza trascrizione

Riepilogo Esecutivo
Per i responsabili IT e i direttori delle operazioni delle sedi nel retail, nell'ospitalità e nelle grandi strutture, il WiFi non è più solo un'utilità di connettività; è la rete di sensori primaria per gli spazi fisici. Tuttavia, le metriche predefinite fornite dalla maggior parte dei sistemi di gestione della rete—come la larghezza di banda totale consumata o le connessioni simultanee di picco—offrono un'intelligence aziendale limitata. Per generare un ROI misurabile, i team IT e marketing devono allinearsi su metriche che correlano con il comportamento del cliente: footfall, dwell time, tasso di engagement, coorti di visite ripetute e correlazione con i ricavi.
Questa guida supera le metriche di vanità per concentrarsi sugli indicatori chiave di prestazione (KPI) di WiFi analytics che contano davvero per il retail. Fornisce un framework tecnico per la configurazione degli access point (AP) per acquisire dati precisi a livello di zona, mitigare l'impatto della randomizzazione degli indirizzi MAC e integrare WiFi analytics con i sistemi Point of Sale (POS) e Customer Relationship Management (CRM). Passando dal monitoraggio di rete di base a WiFi Analytics avanzato, i direttori delle operazioni possono trasformare la loro infrastruttura in una risorsa generatrice di entrate.
Ascolta il briefing audio di accompagnamento per una panoramica esecutiva di questi concetti:
Approfondimento Tecnico: Le Cinque Metriche Che Contano
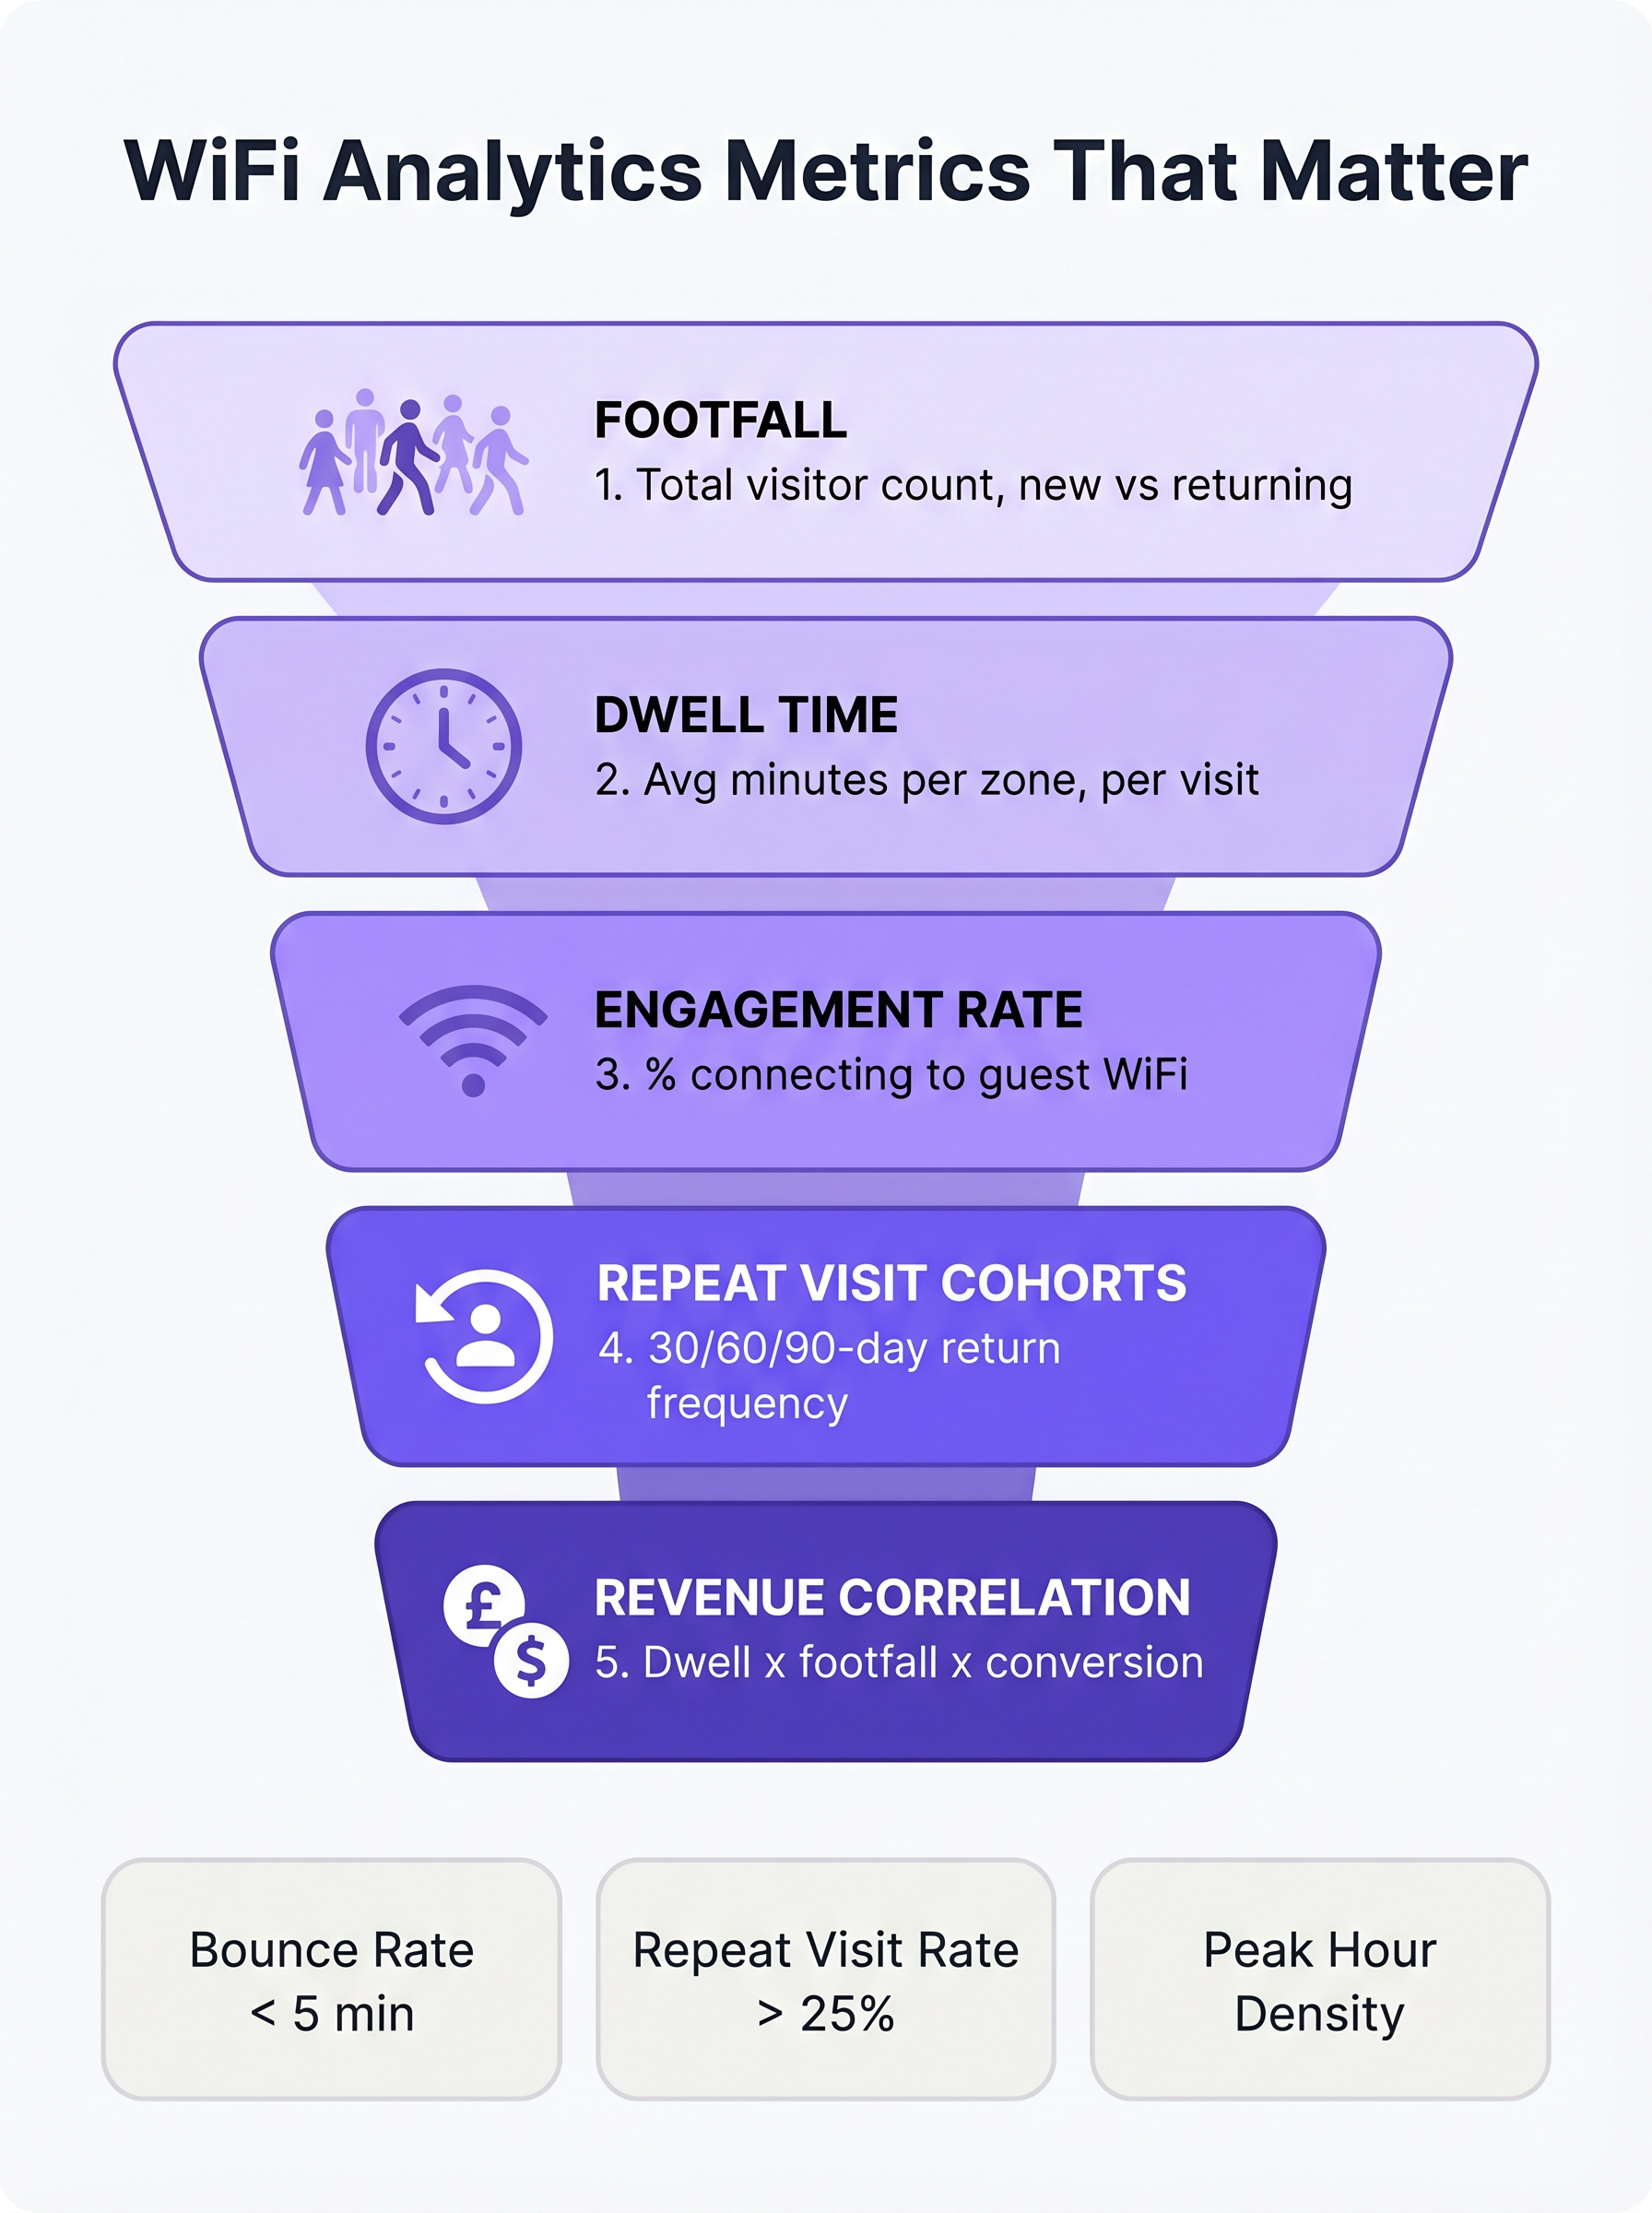
Quando si valuta una piattaforma Guest WiFi per un ambiente retail, l'attenzione deve spostarsi dalla capacità di rete all'intelligence del cliente. Le seguenti cinque metriche costituiscono le fondamenta di una strategia di analytics retail matura.
1. Footfall: Oltre i Semplici Conteggi di Connessione
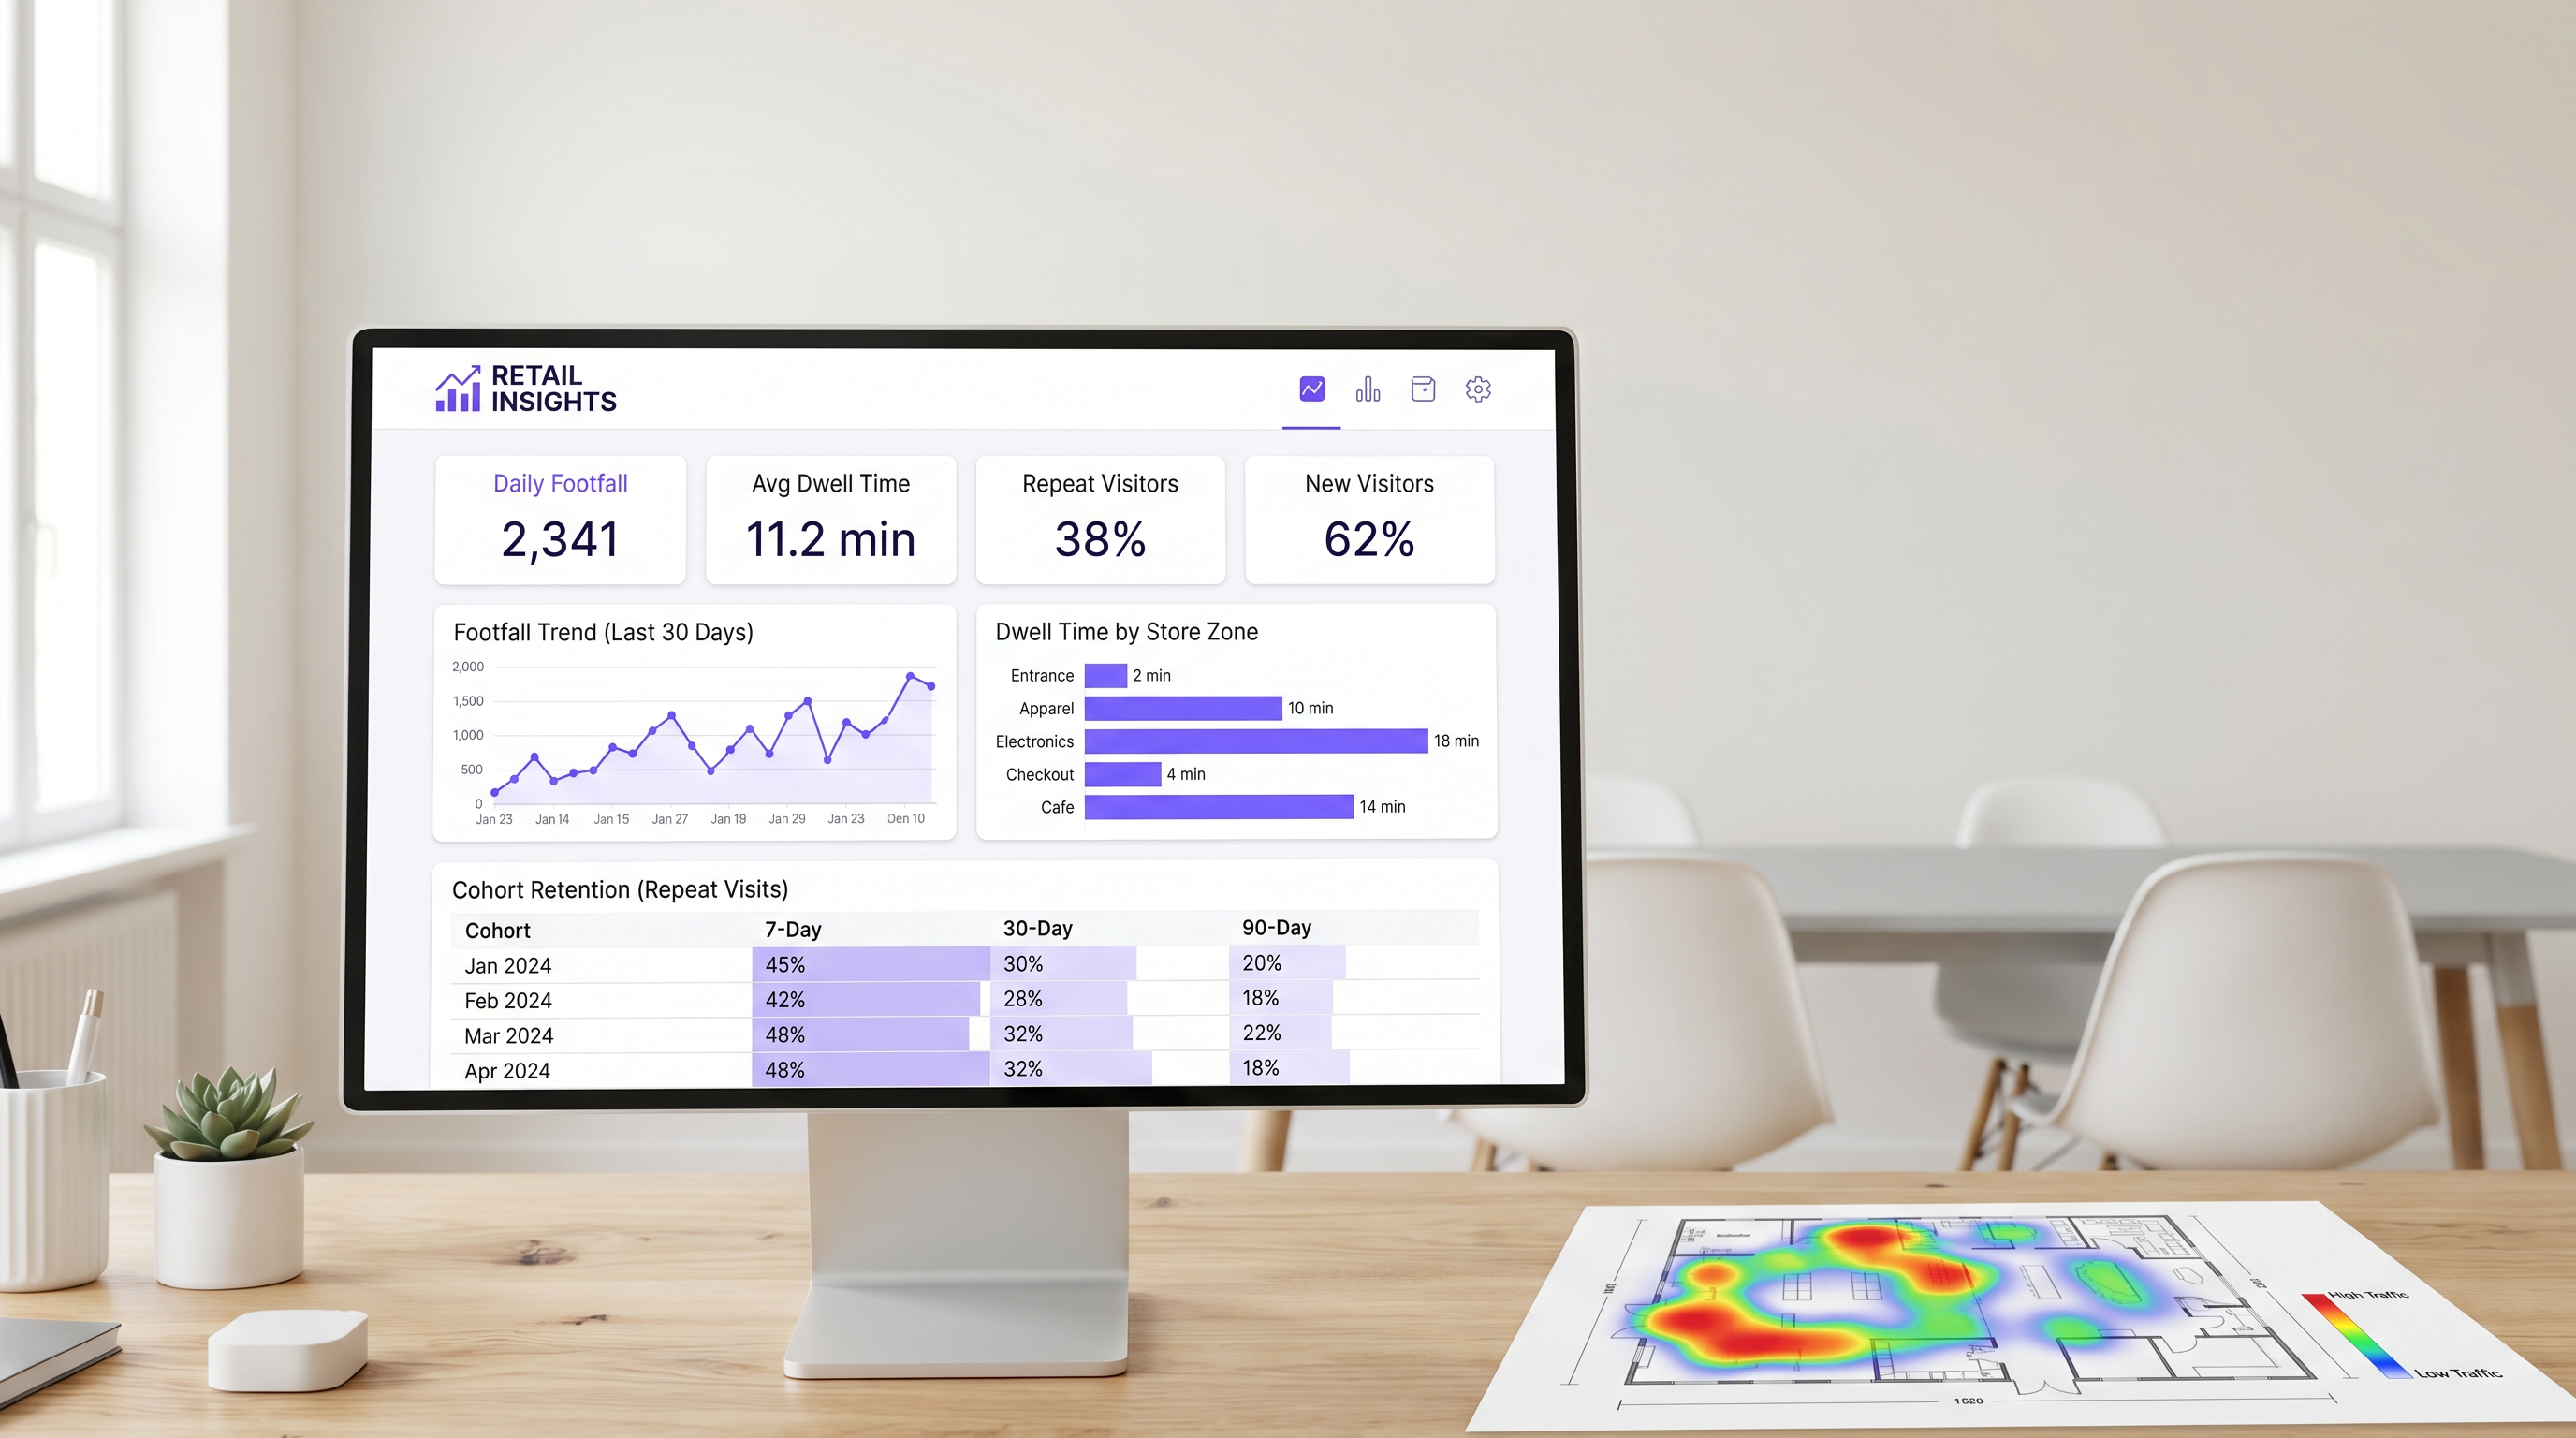
Nel contesto di WiFi analytics, il footfall è il conteggio di dispositivi unici rilevati all'interno di una sede in un periodo di tempo specifico. Fondamentalmente, le piattaforme aziendali utilizzano il rilevamento passivo delle sonde per identificare i dispositivi anche se non si autenticano alla rete. Ciò fornisce una rappresentazione significativamente più accurata del traffico totale della sede rispetto al solo affidamento sulle sessioni autenticate.
La sottometrica più critica all'interno del footfall è la distinzione tra visitatori nuovi e di ritorno. Un'alta percentuale di nuovi visitatori indica un marketing efficace nella parte superiore del funnel o una posizione privilegiata, mentre un forte tasso di visitatori di ritorno dimostra fedeltà e fidelizzazione del cliente.
2. Dwell Time: Il Principale Fattore di Dimensioni del Carrello
Il dwell time misura la durata in cui un dispositivo rimane all'interno della sede o di una specifica zona di rilevamento. Nel retail, il dwell time è costantemente uno dei più forti predittori del valore della transazione.
Per misurare efficacemente il dwell time, i team IT devono configurare la rete per differenziare tra tre stati principali del visitatore:
- Rimbalzo (Meno di 5 minuti): Il visitatore è entrato nella sede ma non ha interagito.
- Esplorazione (5-15 minuti): Il visitatore sta esplorando attivamente l'ambiente retail.
- Coinvolto (Oltre 15 minuti): Il visitatore è molto coinvolto, sebbene tempi di permanenza eccessivi in zone specifiche (es. l'area cassa) possano indicare attrito operativo.
Il dwell time a livello di zona è particolarmente prezioso. Implementando strategicamente AP e Sensors in aree distinte (es. ingresso, abbigliamento, elettronica, cassa), i direttori delle operazioni possono individuare esattamente dove i clienti trascorrono il loro tempo.
3. Tasso di Engagement: Il Funnel di Acquisizione Dati
Il tasso di engagement è la percentuale di dispositivi rilevati che si autenticano con successo alla rete guest tramite il captive portal. Questa metrica rappresenta la transizione dal tracciamento anonimo dei dispositivi alla profilazione identificata del cliente.
Un flusso di autenticazione senza attriti—che utilizzi social login, acquisizione email o provider di identità senza soluzione di continuità come OpenRoaming—è essenziale per massimizzare l'engagement. Negli ambienti retail, un captive portal ben ottimizzato dovrebbe raggiungere un tasso di engagement dal 25% al 40%. Le sedi con tempi di permanenza naturali più lunghi, come Hospitality o hub di Transport , registrano tipicamente tassi di conversione ancora più elevati.
4. Coorti di Visite Ripetute: Misurare la Vera Fedeltà
L'analisi delle coorti raggruppa i visitatori in base al periodo della loro prima visita (es. gennaio 2025) e traccia la loro frequenza di ritorno in intervalli successivi (tipicamente 7, 30 e 90 giorni). Ciò fornisce una solida misura della fidelizzazione del cliente derivata interamente dai dati di rete, senza richiedere un'applicazione di fedeltà separata.
Per il Retail di convenienza, un tasso di ritorno sano a 7 giorni è tipicamente tra il 30% e il 45%. Per la merce generica, questa cifra è più vicina al 15% - 25%. Se la fidelizzazione a 90 giorni scende al di sotto del 10%, la sede affronta una sfida sistemica di fedeltà.
5. Correlazione con i Ricavi: Collegare IT e Marketing
L'obiettivo finale di WiFi analytics è correlare i dati di rete con le prestazioni finanziarie. Integrando la piattaforma WiFi con i sistemi POS tramite API standard, i team operativi possono mappare il footfall e il dwell time rispetto ai tassi di conversione e ai valori medi delle transazioni.
Quando il footfall aumenta ma i ricavi rimangono stabili, il problema risiede nella conversione. Quando il dwell time diminuisce, i ricavi tipicamente seguono entro poche settimane. Questa metrica composita funge da indicatore principale per le prestazioni del negozio, consentendo aggiustamenti operativi proattivi.
Guida all'Implementazione: Architettura und Implementazione
L'implementazione di una soluzione di analisi WiFi richiede un cambiamento fondamentale nella filosofia di progettazione della rete. I team IT devono progettare per l'acquisizione dei dati, non solo per la copertura.
Posizionamento degli Access Point per il Rilevamento delle Zone
La progettazione di rete standard basata sulla copertura spesso posiziona gli AP in posizioni centrali per massimizzare la propagazione del segnale. Tuttavia, per misurare accuratamente il tempo di permanenza a livello di zona, gli AP devono essere posizionati per creare confini di rilevamento distinti. Ciò richiede frequentemente una maggiore densità di AP, in particolare negli ambienti di vendita al dettaglio di grandi dimensioni.
Prima dell'installazione, gli architetti di rete dovrebbero sovrapporre le posizioni AP proposte al piano di merchandising del negozio. Ciò garantisce che i dati risultanti si allineino con le zone operative dell'attività.
Mitigazione della Randomizzazione degli Indirizzi MAC
I moderni sistemi operativi mobili (iOS 14+ e Android 10+) implementano la randomizzazione degli indirizzi MAC per proteggere la privacy degli utenti. Quando un dispositivo cerca reti, utilizza un indirizzo MAC temporaneo e randomizzato anziché il suo vero indirizzo hardware.
Per mantenere dati accurati sul traffico pedonale e sulle coorti, le piattaforme WiFi aziendali devono impiegare sofisticate tecniche di normalizzazione statistica e fare molto affidamento sui dati delle sessioni autenticate. Quando un utente si autentica tramite il captive portal, la piattaforma può collegare l'indirizzo MAC randomizzato a un profilo utente persistente, garantendo la continuità tra le visite. Per maggiori informazioni sui framework di privacy, consulta la nostra guida su CCPA vs GDPR: Conformità Globale alla Privacy per i Dati WiFi degli Ospiti .
Best Practice e Risoluzione dei Problemi
Allineamento tra IT e Marketing
La modalità di fallimento più comune per le implementazioni di analisi WiFi è la mancanza di allineamento tra IT e marketing. Per garantire che la piattaforma offra un ROI misurabile (vedi Misurare il ROI sul WiFi Ospiti: Un Framework per i CMO ), entrambi i team devono concordare una dashboard KPI unificata prima dell'implementazione. L'IT è responsabile dell'accuratezza dell'acquisizione dei dati, mentre il marketing è responsabile dell'esecuzione delle campagne basate sugli insight.
Prestazioni di Rete e SD-WAN
Poiché gli ambienti di vendita al dettaglio dipendono sempre più da analisi basate su cloud e integrazioni POS, la Wide Area Network (WAN) sottostante deve essere robusta e resiliente. L'implementazione di un'architettura Software-Defined WAN (SD-WAN) garantisce che i dati analitici critici e il traffico di autenticazione siano prioritari rispetto all'accesso generale a internet per gli ospiti. Per un approfondimento sull'architettura di rete, consulta I Vantaggi Chiave della SD-WAN per le Aziende Moderne .
Termini chiave e definizioni
Passive Probe Detection
The ability of a WiFi access point to detect devices that are searching for networks, even if those devices do not connect to the guest WiFi.
Essential for accurate footfall measurement, as it captures the 60-70% of visitors who do not actively authenticate to the network.
MAC Address Randomisation
A privacy feature in modern mobile OSs that generates a temporary hardware address when probing for networks, preventing persistent tracking of unauthenticated devices.
Forces IT teams to rely on sophisticated statistical normalisation and authenticated session data to maintain accurate cohort and repeat visit metrics.
Captive Portal
A web page that users are required to view and interact with before being granted access to a public WiFi network.
The primary data capture mechanism for marketing teams, transitioning anonymous devices into identified customer profiles.
Zone-Level Dwell Time
The measurement of how long a detected device remains within a specific, defined physical area of a venue (e.g., the checkout queue or a specific department).
Requires precise AP placement and RSSI calibration, but provides the most actionable data for store operations and merchandising teams.
Cohort Analysis
A method of grouping visitors based on the date of their first visit and tracking their subsequent return rates over 7, 30, and 90-day intervals.
Provides a network-derived measure of customer loyalty and retention without requiring a dedicated mobile application or loyalty card.
Engagement Rate
The percentage of total detected devices (footfall) that successfully authenticate and connect to the guest WiFi network.
A critical metric for evaluating the effectiveness and user experience of the captive portal.
RSSI (Received Signal Strength Indicator)
A measurement of the power present in a received radio signal.
Used by analytics platforms to estimate the distance of a device from an access point and determine which physical zone the device is located in.
OpenRoaming
A standard that allows users to seamlessly and securely connect to participating guest WiFi networks using a persistent identity profile.
Reduces authentication friction, significantly increasing the engagement rate and providing highly accurate, persistent user data.
Casi di studio
A 50,000 sq ft big-box retailer is deploying a new WiFi network and wants to measure dwell time specifically in their high-margin electronics department versus their low-margin homewares department. How should the IT team approach the deployment?
The IT team must abandon a pure coverage-based design. Instead of placing APs centrally for maximum range, they should deploy directional antennas or lower-power APs specifically targeted at the electronics and homewares zones to create distinct RF boundaries. They must configure the WiFi analytics platform to define these areas as separate tracking zones. Once deployed, they should conduct a physical walk-through with a test device to calibrate the Received Signal Strength Indicator (RSSI) thresholds that define when a device transitions from one zone to another.
A stadium operations director notes that while their total detected footfall is 40,000 per match, their captive portal engagement rate is only 8%. How can the IT and marketing teams collaborate to improve this metric?
The low engagement rate suggests friction in the authentication process or a lack of perceived value. The IT team should review the captive portal architecture to ensure it supports seamless authentication methods, such as social login or profile-based authentication (e.g., OpenRoaming). Simultaneously, the marketing team should update the portal design to clearly communicate the value exchange—for example, offering in-seat ordering or exclusive replays in exchange for authentication. Furthermore, the IT team should ensure the captive portal loads rapidly, even under high concurrent user load.
Analisi degli scenari
Q1. Your marketing director complains that the 'Repeat Visitor' metric on the dashboard dropped suddenly last month, despite store sales remaining stable. What is the most likely technical cause?
💡 Suggerimento:Consider recent changes to mobile operating systems and how devices probe for networks.
Mostra l'approccio consigliato
The most likely cause is an OS update that increased the prevalence or aggression of MAC address randomisation. If the analytics platform relies heavily on passive probe data without robust statistical normalisation, randomised MACs will appear as 'New Visitors' rather than 'Returning Visitors'. The IT team should verify the platform's normalisation algorithms and work to increase the captive portal engagement rate to capture more authenticated, persistent sessions.
Q2. A retail chain wants to measure the conversion rate of their window displays. They place an AP right at the entrance. The data shows high footfall but an average dwell time of only 45 seconds. How should operations interpret this?
💡 Suggerimento:Differentiate between venue-level dwell time and zone-level dwell time.
Mostra l'approccio consigliato
This indicates a high 'bounce rate'. Customers are entering the detection zone (the entrance) but not proceeding further into the store. The window display is successfully generating initial interest (footfall), but the immediate in-store experience is failing to convert that interest into a 'browse' state. Operations should evaluate the store layout immediately inside the entrance to remove friction or improve merchandising.
Q3. You are designing the network for a new flagship store. Marketing requires precise dwell time data for five specific departments. How does this requirement change your hardware deployment strategy compared to a standard office deployment?
💡 Suggerimento:Think about the difference between designing for coverage versus designing for location accuracy.
Mostra l'approccio consigliato
A standard office deployment focuses on providing adequate signal coverage with the minimum number of APs. To provide precise zone-level analytics, the deployment must focus on location accuracy. This requires a higher density of APs to create overlapping detection zones, allowing the system to use RSSI triangulation to pinpoint device locations accurately. You may also need to deploy Bluetooth Low Energy (BLE) beacons or dedicated sensors to augment the WiFi data in highly granular zones.
Punti chiave
- ✓Focus on the five metrics that matter: Footfall, Dwell Time, Engagement Rate, Repeat Visit Cohorts, and Revenue Correlation.
- ✓Passive probe detection captures 60-70% more footfall data than relying on authenticated connections alone.
- ✓Dwell time is a primary driver of basket size; customers staying over 8 minutes spend 2-3x more.
- ✓Design your AP layout to create distinct RF boundaries for accurate zone-level analytics, not just maximum coverage.
- ✓Mitigate MAC address randomisation by optimising your captive portal to increase the engagement rate and capture authenticated sessions.
- ✓Align IT and marketing on a shared KPI dashboard before deployment to ensure the platform delivers measurable ROI.
