Métricas de analítica WiFi que realmente importan para el comercio minorista
Esta guía de referencia autorizada detalla las cinco métricas de analítica WiFi que se correlacionan directamente con los ingresos minoristas, el tiempo de permanencia y la lealtad del cliente. Proporciona a los gerentes de TI y a los directores de operaciones de locales un marco práctico para configurar el hardware de red, mitigar los impactos de la aleatorización de MAC y alinearse con los equipos de marketing en un panel de datos unificado.
🎧 Escuchar esta guía
Ver transcripción

Resumen Ejecutivo
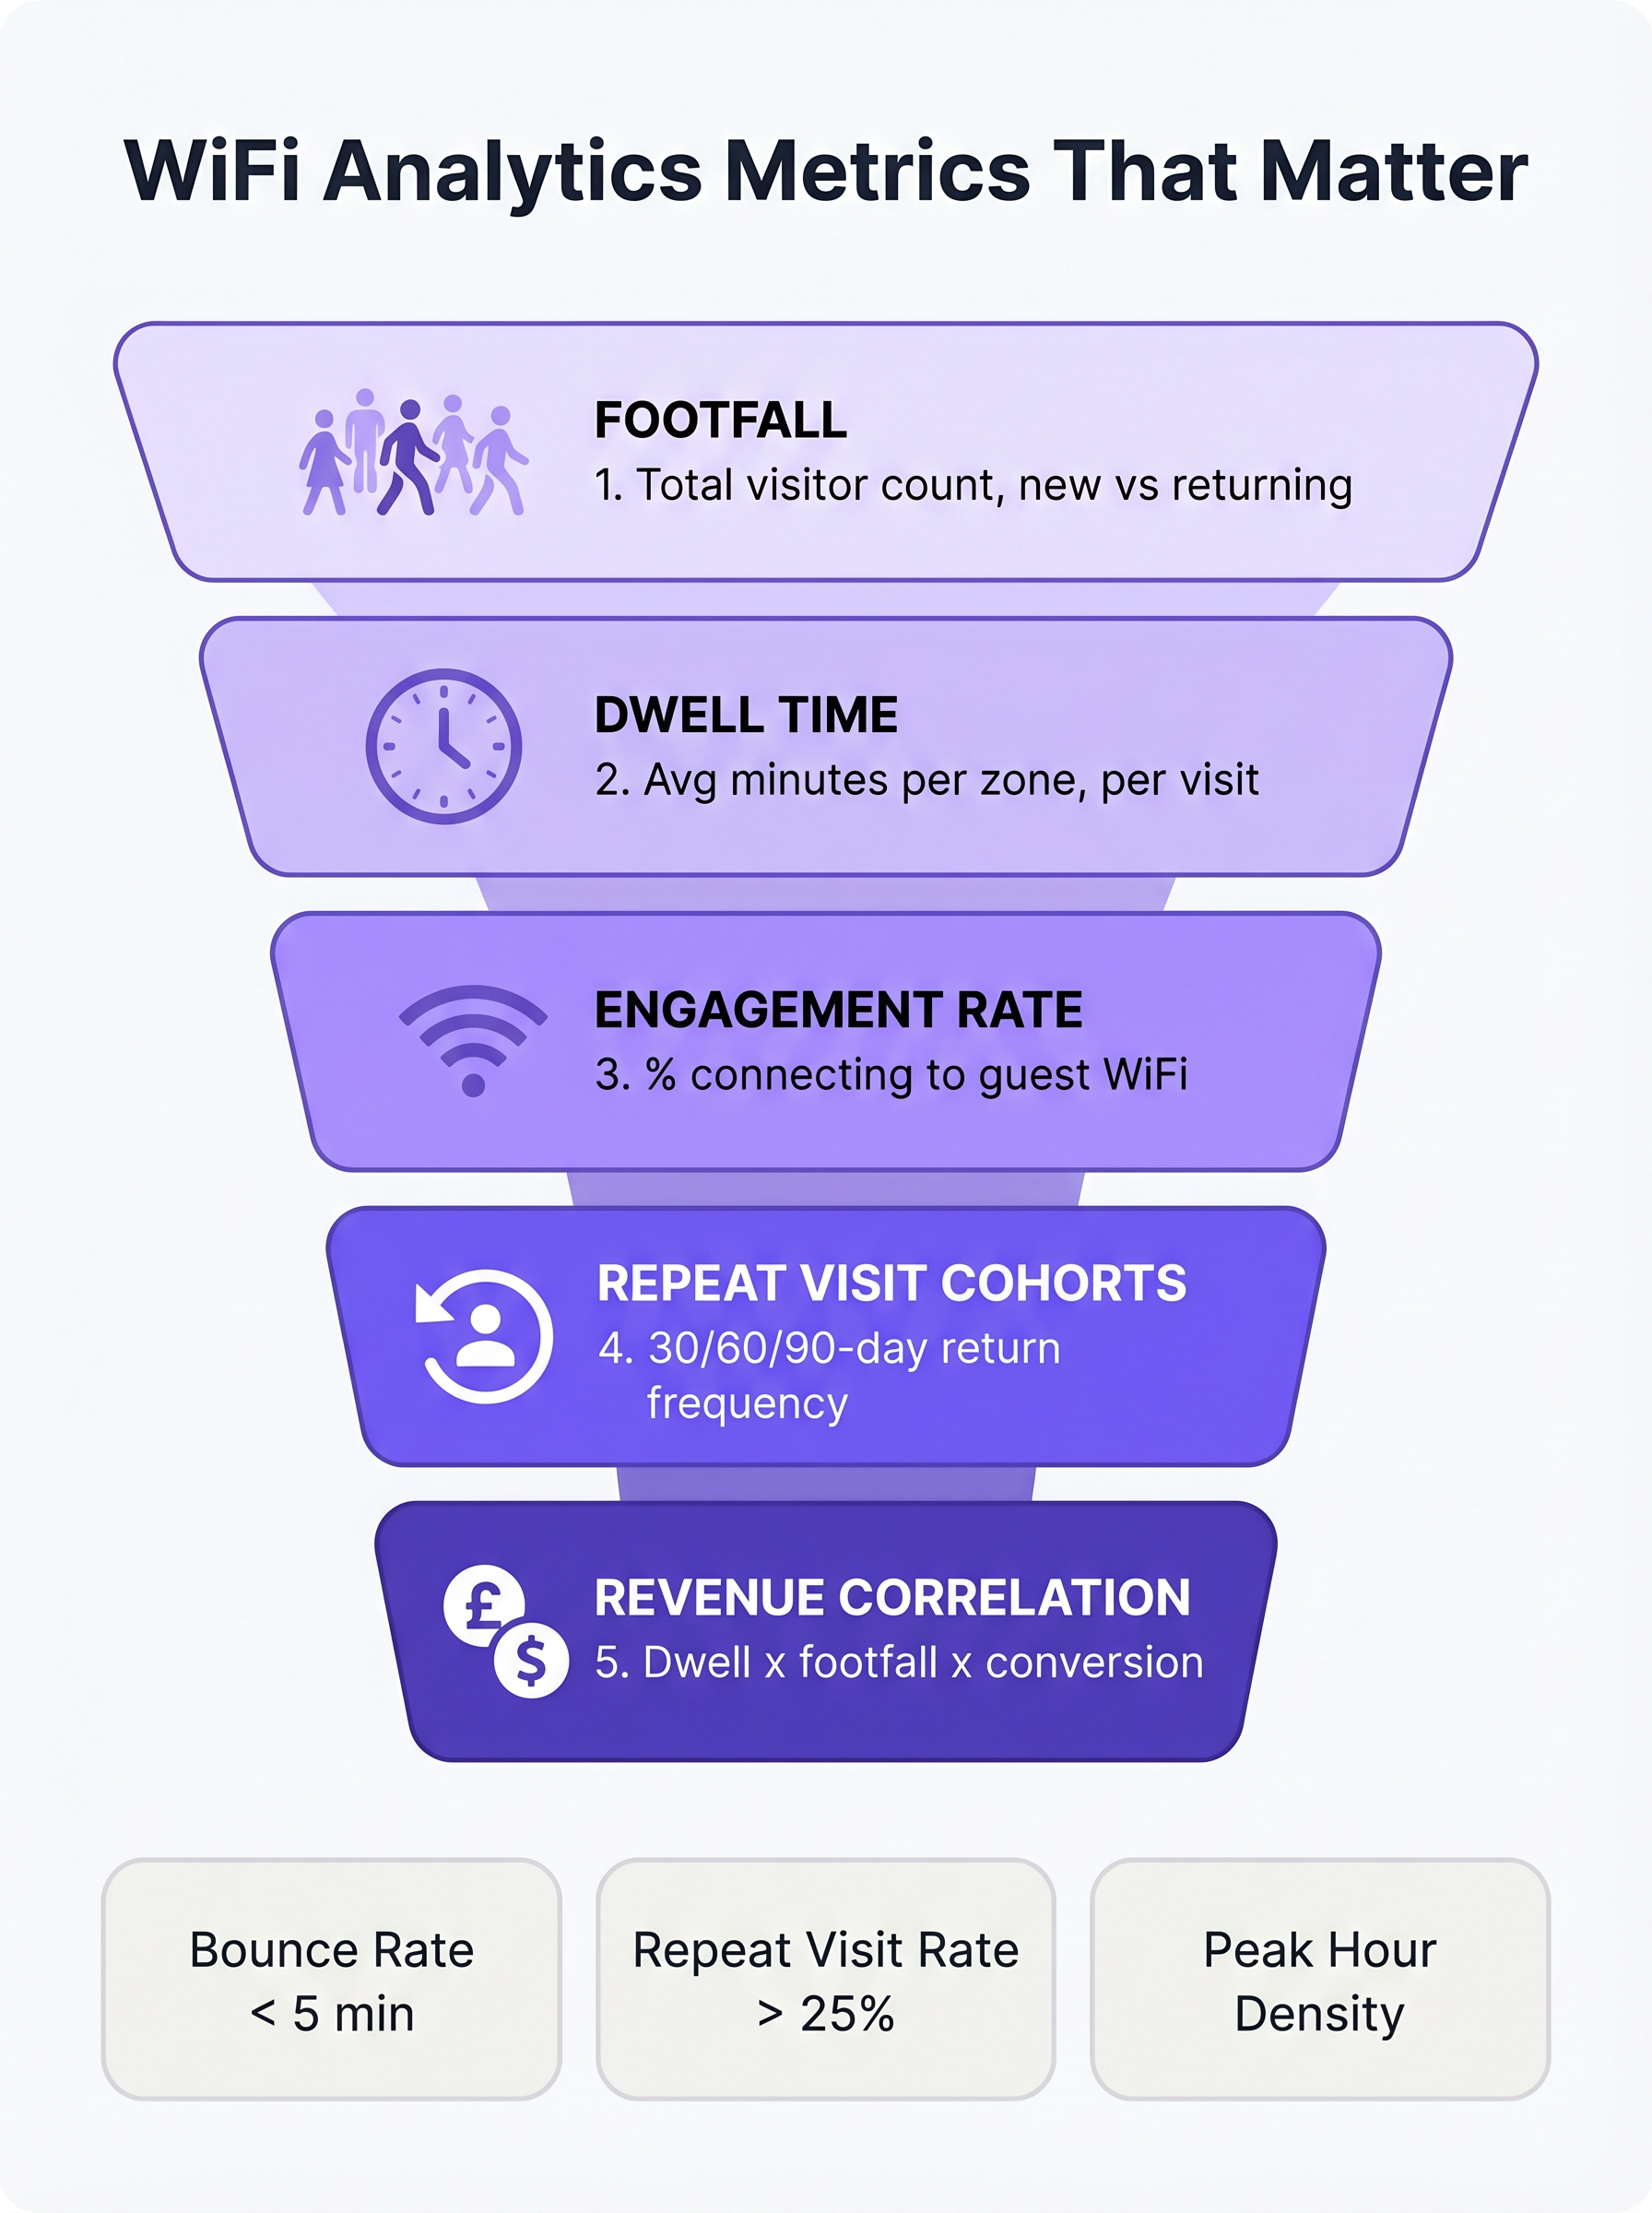
Para los gerentes de TI y los directores de operaciones de locales en el comercio minorista, la hostelería y los grandes recintos, el WiFi ya no es solo una utilidad de conectividad; es la red de sensores principal para los espacios físicos. Sin embargo, las métricas predeterminadas proporcionadas por la mayoría de los sistemas de gestión de red —como el ancho de banda total consumido o las conexiones concurrentes máximas— ofrecen una inteligencia empresarial limitada. Para impulsar un ROI medible, los equipos de TI y marketing deben alinearse en métricas que se correlacionen con el comportamiento del cliente: afluencia, tiempo de permanencia, tasa de engagement, cohortes de visitas repetidas y correlación de ingresos.
Esta guía va más allá de las métricas de vanidad para centrarse en los Indicadores Clave de Rendimiento (KPIs) de analítica WiFi que realmente importan para el comercio minorista. Proporciona un marco técnico para configurar puntos de acceso (APs) para capturar datos precisos a nivel de zona, mitigar el impacto de la aleatorización de direcciones MAC e integrar la analítica WiFi con sistemas de Punto de Venta (POS) y Gestión de Relaciones con el Cliente (CRM). Al pasar de la monitorización básica de la red a la Analítica WiFi avanzada, los directores de operaciones pueden transformar su infraestructura en un activo generador de ingresos.
Escuche el resumen de audio complementario para una visión general ejecutiva de estos conceptos:
Análisis Técnico Detallado: Las Cinco Métricas Clave
Al evaluar una plataforma de WiFi para Invitados para un entorno minorista, el enfoque debe pasar de la capacidad de la red a la inteligencia del cliente. Las siguientes cinco métricas forman la base de una estrategia de analítica minorista madura.
1. Afluencia: Más Allá de los Simples Recuentos de Conexiones
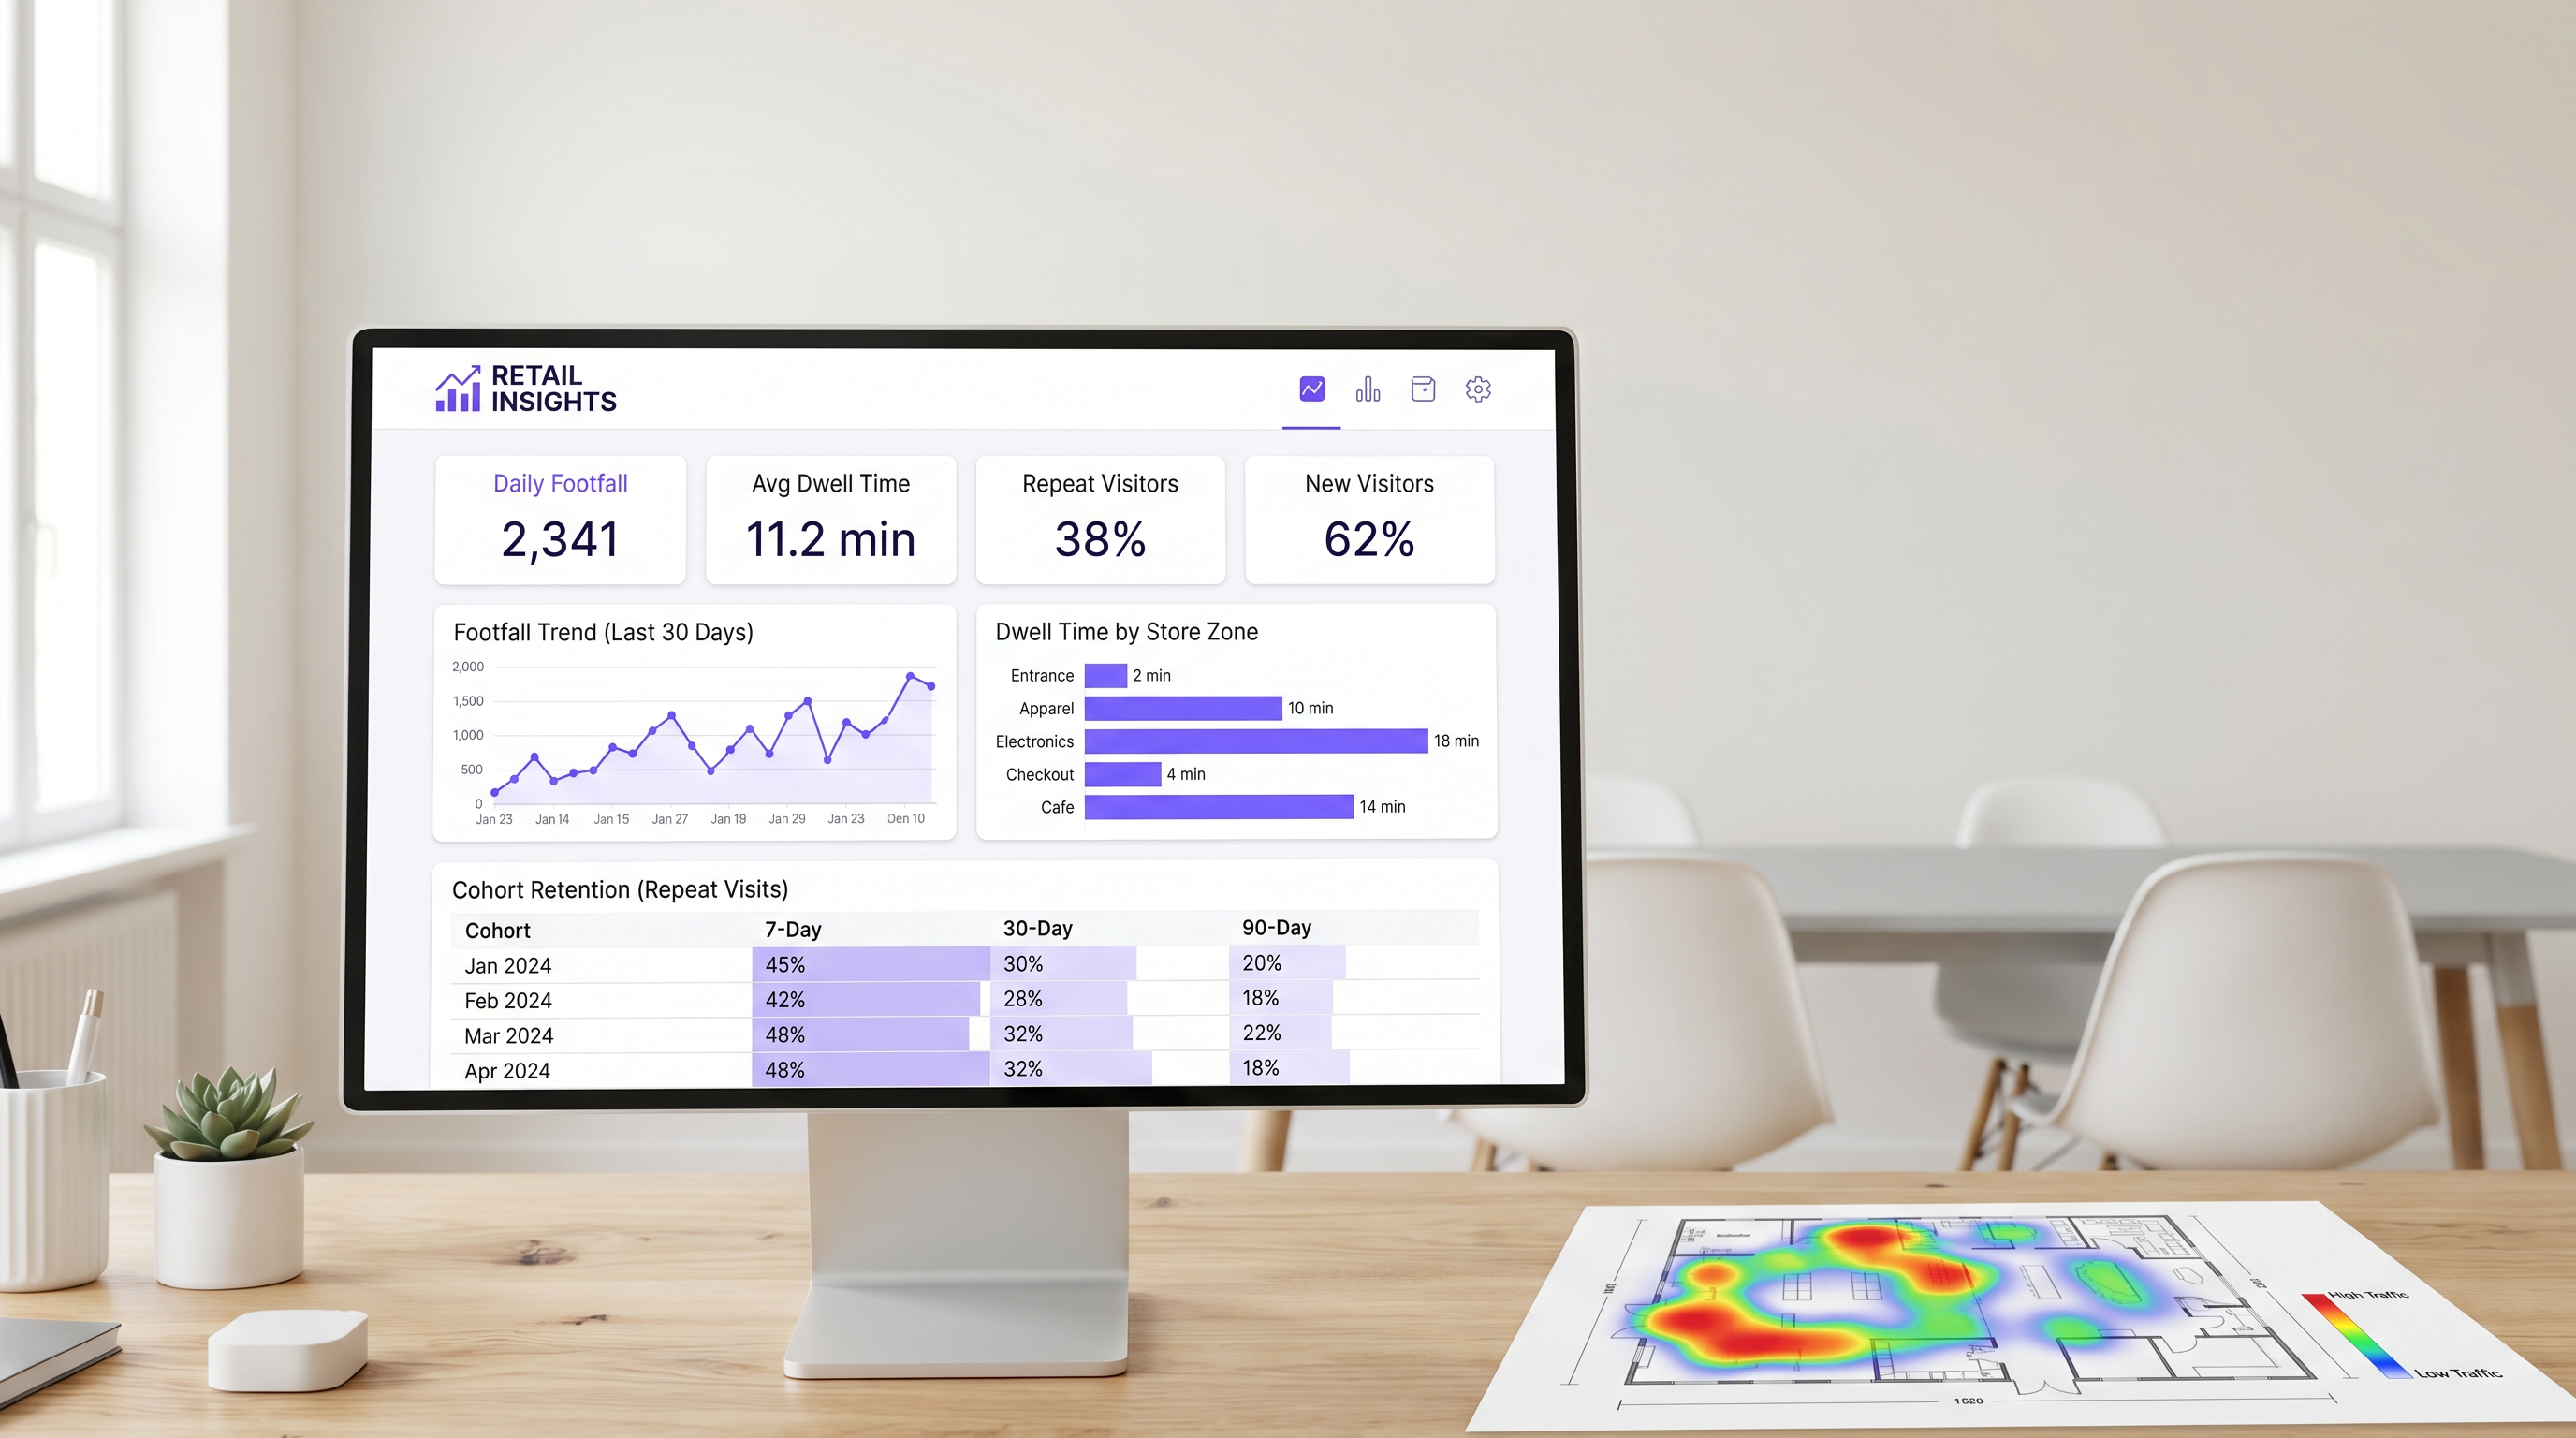
En un contexto de analítica WiFi, la afluencia es el recuento de dispositivos únicos detectados dentro de un local durante un período de tiempo específico. Fundamentalmente, las plataformas empresariales utilizan la detección pasiva de sondas para identificar dispositivos incluso si no se autentican en la red. Esto proporciona una representación significativamente más precisa del tráfico total del local que depender únicamente de sesiones autenticadas.
La submétrica más crítica dentro de la afluencia es la distinción entre visitantes nuevos y recurrentes. Una alta proporción de visitantes nuevos indica un marketing eficaz en la parte superior del embudo o una ubicación privilegiada, mientras que una sólida tasa de visitantes recurrentes demuestra la lealtad y retención del cliente.
2. Tiempo de Permanencia: El Principal Impulsor del Tamaño de la Cesta
El tiempo de permanencia mide la duración que un dispositivo permanece dentro del local o de una zona de detección específica. En el comercio minorista, el tiempo de permanencia es consistentemente uno de los predictores más fuertes del valor de la transacción.
Para medir eficazmente el tiempo de permanencia, los equipos de TI deben configurar la red para diferenciar entre tres estados principales del visitante:
- Rebote (Menos de 5 minutos): El visitante entró en el local pero no interactuó.
- Exploración (5-15 minutos): El visitante está explorando activamente el entorno minorista.
- Comprometido (Más de 15 minutos): El visitante está muy comprometido, aunque los tiempos de permanencia excesivos en zonas específicas (por ejemplo, el área de caja) pueden indicar fricción operativa.
El tiempo de permanencia a nivel de zona es particularmente valioso. Al desplegar estratégicamente APs y Sensores en distintas áreas (por ejemplo, entrada, ropa, electrónica, caja), los directores de operaciones pueden identificar exactamente dónde pasan su tiempo los clientes.
3. Tasa de Engagement: El Embudo de Captura de Datos
La tasa de engagement es el porcentaje de dispositivos detectados que se autentican con éxito en la red de invitados a través del Captive Portal. Esta métrica representa la transición del seguimiento anónimo de dispositivos a la elaboración de perfiles de clientes identificados.
Un flujo de autenticación sin fricciones —utilizando inicio de sesión social, captura de correo electrónico o proveedores de identidad sin interrupciones como OpenRoaming— es esencial para maximizar el engagement. En entornos minoristas, un Captive Portal bien optimizado debería lograr una tasa de engagement del 25% al 40%. Los locales con tiempos de permanencia naturales más largos, como los centros de Hostelería o Transporte , suelen ver tasas de conversión aún mayores.
4. Cohortes de Visitas Repetidas: Midiendo la Verdadera Lealtad
El análisis de cohortes agrupa a los visitantes en función del período de su primera visita (por ejemplo, enero de 2025) y rastrea su frecuencia de retorno en intervalos posteriores (típicamente 7, 30 y 90 días). Esto proporciona una medida robusta de la retención de clientes derivada completamente de los datos de la red, sin requerir una aplicación de lealtad separada.
Para el Comercio Minorista de conveniencia, una tasa de retorno saludable a los 7 días suele estar entre el 30% y el 45%. Para la mercancía general, esta cifra se acerca más al 15% al 25%. Si la retención a los 90 días cae por debajo del 10%, el local se enfrenta a un desafío de lealtad sistémico.
5. Correlación de Ingresos: Uniendo TI y Marketing
El objetivo final de la analítica WiFi es correlacionar los datos de la red con el rendimiento financiero. Al integrar la plataforma WiFi con los sistemas POS a través de APIs estándar, los equipos de operaciones pueden mapear la afluencia y el tiempo de permanencia con las tasas de conversión y los valores promedio de las transacciones.
Cuando la afluencia aumenta pero los ingresos se mantienen estables, el problema reside en la conversión. Cuando el tiempo de permanencia disminuye, los ingresos suelen seguir el mismo patrón en cuestión de semanas. Esta métrica compuesta sirve como un indicador principal del rendimiento de la tienda, permitiendo ajustes operativos proactivos.
Guía de Implementación: Arquitectura und Implementación
La implementación de una solución de análisis WiFi requiere un cambio fundamental en la filosofía de diseño de red. Los equipos de TI deben diseñar para la captura de datos, no solo para la cobertura.
Ubicación de Puntos de Acceso para la Detección de Zonas
El diseño de red estándar basado en cobertura a menudo ubica los AP en ubicaciones centrales para maximizar la propagación de la señal. Sin embargo, para medir con precisión el tiempo de permanencia a nivel de zona, los AP deben posicionarse para crear límites de detección distintos. Esto con frecuencia requiere una mayor densidad de AP, particularmente en entornos minoristas de gran formato.
Antes de la instalación, los arquitectos de red deben superponer las ubicaciones de AP propuestas en el plan de merchandising de la tienda. Esto asegura que los datos resultantes se alineen con las zonas operativas del negocio.
Mitigación de la Aleatorización de Direcciones MAC
Los sistemas operativos móviles modernos (iOS 14+ y Android 10+) implementan la aleatorización de direcciones MAC para proteger la privacidad del usuario. Cuando un dispositivo busca redes, utiliza una dirección MAC temporal y aleatoria en lugar de su dirección de hardware real.
Para mantener datos precisos de afluencia y cohortes, las plataformas WiFi empresariales deben emplear técnicas sofisticadas de normalización estadística y depender en gran medida de los datos de sesión autenticada. Cuando un usuario se autentica a través del captive portal, la plataforma puede vincular la dirección MAC aleatoria a un perfil de usuario persistente, asegurando la continuidad entre visitas. Para obtener más información sobre los marcos de privacidad, consulte nuestra guía sobre CCPA vs GDPR: Cumplimiento Global de la Privacidad para Datos de WiFi de Invitados .
Mejores Prácticas y Resolución de Problemas
Alineación de TI y Marketing
El modo de fallo más común para las implementaciones de análisis WiFi es la falta de alineación entre TI y marketing. Para asegurar que la plataforma ofrezca un ROI medible (consulte Medición del ROI en WiFi de Invitados: Un Marco para CMOs ), ambos equipos deben acordar un panel de KPI unificado antes de la implementación. TI es responsable de la precisión de la captura de datos, mientras que marketing es responsable de ejecutar campañas basadas en los conocimientos.
Rendimiento de la Red y SD-WAN
A medida que los entornos minoristas dependen cada vez más de los análisis basados en la nube y las integraciones de POS, la Red de Área Amplia (WAN) subyacente debe ser robusta y resiliente. La implementación de una arquitectura de Red de Área Amplia Definida por Software (SD-WAN) asegura que los datos de análisis críticos y el tráfico de autenticación se prioricen sobre el acceso general a internet de los invitados. Para una inmersión más profunda en la arquitectura de red, revise Los Beneficios Clave de SD-WAN para Empresas Modernas .
Términos clave y definiciones
Passive Probe Detection
The ability of a WiFi access point to detect devices that are searching for networks, even if those devices do not connect to the guest WiFi.
Essential for accurate footfall measurement, as it captures the 60-70% of visitors who do not actively authenticate to the network.
MAC Address Randomisation
A privacy feature in modern mobile OSs that generates a temporary hardware address when probing for networks, preventing persistent tracking of unauthenticated devices.
Forces IT teams to rely on sophisticated statistical normalisation and authenticated session data to maintain accurate cohort and repeat visit metrics.
Captive Portal
A web page that users are required to view and interact with before being granted access to a public WiFi network.
The primary data capture mechanism for marketing teams, transitioning anonymous devices into identified customer profiles.
Zone-Level Dwell Time
The measurement of how long a detected device remains within a specific, defined physical area of a venue (e.g., the checkout queue or a specific department).
Requires precise AP placement and RSSI calibration, but provides the most actionable data for store operations and merchandising teams.
Cohort Analysis
A method of grouping visitors based on the date of their first visit and tracking their subsequent return rates over 7, 30, and 90-day intervals.
Provides a network-derived measure of customer loyalty and retention without requiring a dedicated mobile application or loyalty card.
Engagement Rate
The percentage of total detected devices (footfall) that successfully authenticate and connect to the guest WiFi network.
A critical metric for evaluating the effectiveness and user experience of the captive portal.
RSSI (Received Signal Strength Indicator)
A measurement of the power present in a received radio signal.
Used by analytics platforms to estimate the distance of a device from an access point and determine which physical zone the device is located in.
OpenRoaming
A standard that allows users to seamlessly and securely connect to participating guest WiFi networks using a persistent identity profile.
Reduces authentication friction, significantly increasing the engagement rate and providing highly accurate, persistent user data.
Casos de éxito
A 50,000 sq ft big-box retailer is deploying a new WiFi network and wants to measure dwell time specifically in their high-margin electronics department versus their low-margin homewares department. How should the IT team approach the deployment?
The IT team must abandon a pure coverage-based design. Instead of placing APs centrally for maximum range, they should deploy directional antennas or lower-power APs specifically targeted at the electronics and homewares zones to create distinct RF boundaries. They must configure the WiFi analytics platform to define these areas as separate tracking zones. Once deployed, they should conduct a physical walk-through with a test device to calibrate the Received Signal Strength Indicator (RSSI) thresholds that define when a device transitions from one zone to another.
A stadium operations director notes that while their total detected footfall is 40,000 per match, their captive portal engagement rate is only 8%. How can the IT and marketing teams collaborate to improve this metric?
The low engagement rate suggests friction in the authentication process or a lack of perceived value. The IT team should review the captive portal architecture to ensure it supports seamless authentication methods, such as social login or profile-based authentication (e.g., OpenRoaming). Simultaneously, the marketing team should update the portal design to clearly communicate the value exchange—for example, offering in-seat ordering or exclusive replays in exchange for authentication. Furthermore, the IT team should ensure the captive portal loads rapidly, even under high concurrent user load.
Análisis de escenarios
Q1. Your marketing director complains that the 'Repeat Visitor' metric on the dashboard dropped suddenly last month, despite store sales remaining stable. What is the most likely technical cause?
💡 Sugerencia:Consider recent changes to mobile operating systems and how devices probe for networks.
Mostrar enfoque recomendado
The most likely cause is an OS update that increased the prevalence or aggression of MAC address randomisation. If the analytics platform relies heavily on passive probe data without robust statistical normalisation, randomised MACs will appear as 'New Visitors' rather than 'Returning Visitors'. The IT team should verify the platform's normalisation algorithms and work to increase the captive portal engagement rate to capture more authenticated, persistent sessions.
Q2. A retail chain wants to measure the conversion rate of their window displays. They place an AP right at the entrance. The data shows high footfall but an average dwell time of only 45 seconds. How should operations interpret this?
💡 Sugerencia:Differentiate between venue-level dwell time and zone-level dwell time.
Mostrar enfoque recomendado
This indicates a high 'bounce rate'. Customers are entering the detection zone (the entrance) but not proceeding further into the store. The window display is successfully generating initial interest (footfall), but the immediate in-store experience is failing to convert that interest into a 'browse' state. Operations should evaluate the store layout immediately inside the entrance to remove friction or improve merchandising.
Q3. You are designing the network for a new flagship store. Marketing requires precise dwell time data for five specific departments. How does this requirement change your hardware deployment strategy compared to a standard office deployment?
💡 Sugerencia:Think about the difference between designing for coverage versus designing for location accuracy.
Mostrar enfoque recomendado
A standard office deployment focuses on providing adequate signal coverage with the minimum number of APs. To provide precise zone-level analytics, the deployment must focus on location accuracy. This requires a higher density of APs to create overlapping detection zones, allowing the system to use RSSI triangulation to pinpoint device locations accurately. You may also need to deploy Bluetooth Low Energy (BLE) beacons or dedicated sensors to augment the WiFi data in highly granular zones.
Conclusiones clave
- ✓Focus on the five metrics that matter: Footfall, Dwell Time, Engagement Rate, Repeat Visit Cohorts, and Revenue Correlation.
- ✓Passive probe detection captures 60-70% more footfall data than relying on authenticated connections alone.
- ✓Dwell time is a primary driver of basket size; customers staying over 8 minutes spend 2-3x more.
- ✓Design your AP layout to create distinct RF boundaries for accurate zone-level analytics, not just maximum coverage.
- ✓Mitigate MAC address randomisation by optimising your captive portal to increase the engagement rate and capture authenticated sessions.
- ✓Align IT and marketing on a shared KPI dashboard before deployment to ensure the platform delivers measurable ROI.
