Métricas de WiFi Analytics que Realmente Importam para o Varejo
Este guia de referência autorizado detalha as cinco métricas de WiFi analytics que se correlacionam diretamente com a receita do varejo, o tempo de permanência e a fidelidade do cliente. Ele fornece aos gerentes de TI e diretores de operações de locais um framework prático para configurar hardware de rede, mitigar impactos da randomização de MAC e alinhar com equipes de marketing em um dashboard de dados unificado.
🎧 Ouça este Guia
Ver Transcrição

Resumo Executivo
Para gerentes de TI e diretores de operações de locais no varejo, hotelaria e grandes espaços, o WiFi não é mais apenas uma utilidade de conectividade; é a principal rede de sensores para espaços físicos. No entanto, as métricas padrão fornecidas pela maioria dos sistemas de gerenciamento de rede — como largura de banda total consumida ou pico de conexões simultâneas — oferecem inteligência de negócios limitada. Para impulsionar um ROI mensurável, as equipes de TI e marketing devem se alinhar em métricas que se correlacionam com o comportamento do cliente: fluxo de pessoas, tempo de permanência, taxa de engajamento, coortes de visitas repetidas e correlação de receita.
Este guia vai além das métricas de vaidade para focar nos Indicadores Chave de Desempenho (KPIs) de WiFi analytics que realmente importam para o varejo. Ele fornece um framework técnico para configurar pontos de acesso (APs) para capturar dados precisos em nível de zona, mitigando o impacto da randomização de endereço MAC e integrando WiFi analytics com sistemas de Ponto de Venda (POS) e Gerenciamento de Relacionamento com o Cliente (CRM). Ao fazer a transição do monitoramento básico de rede para WiFi Analytics avançado, os diretores de operações podem transformar sua infraestrutura em um ativo gerador de receita.
Ouça o briefing de áudio complementar para uma visão executiva desses conceitos:
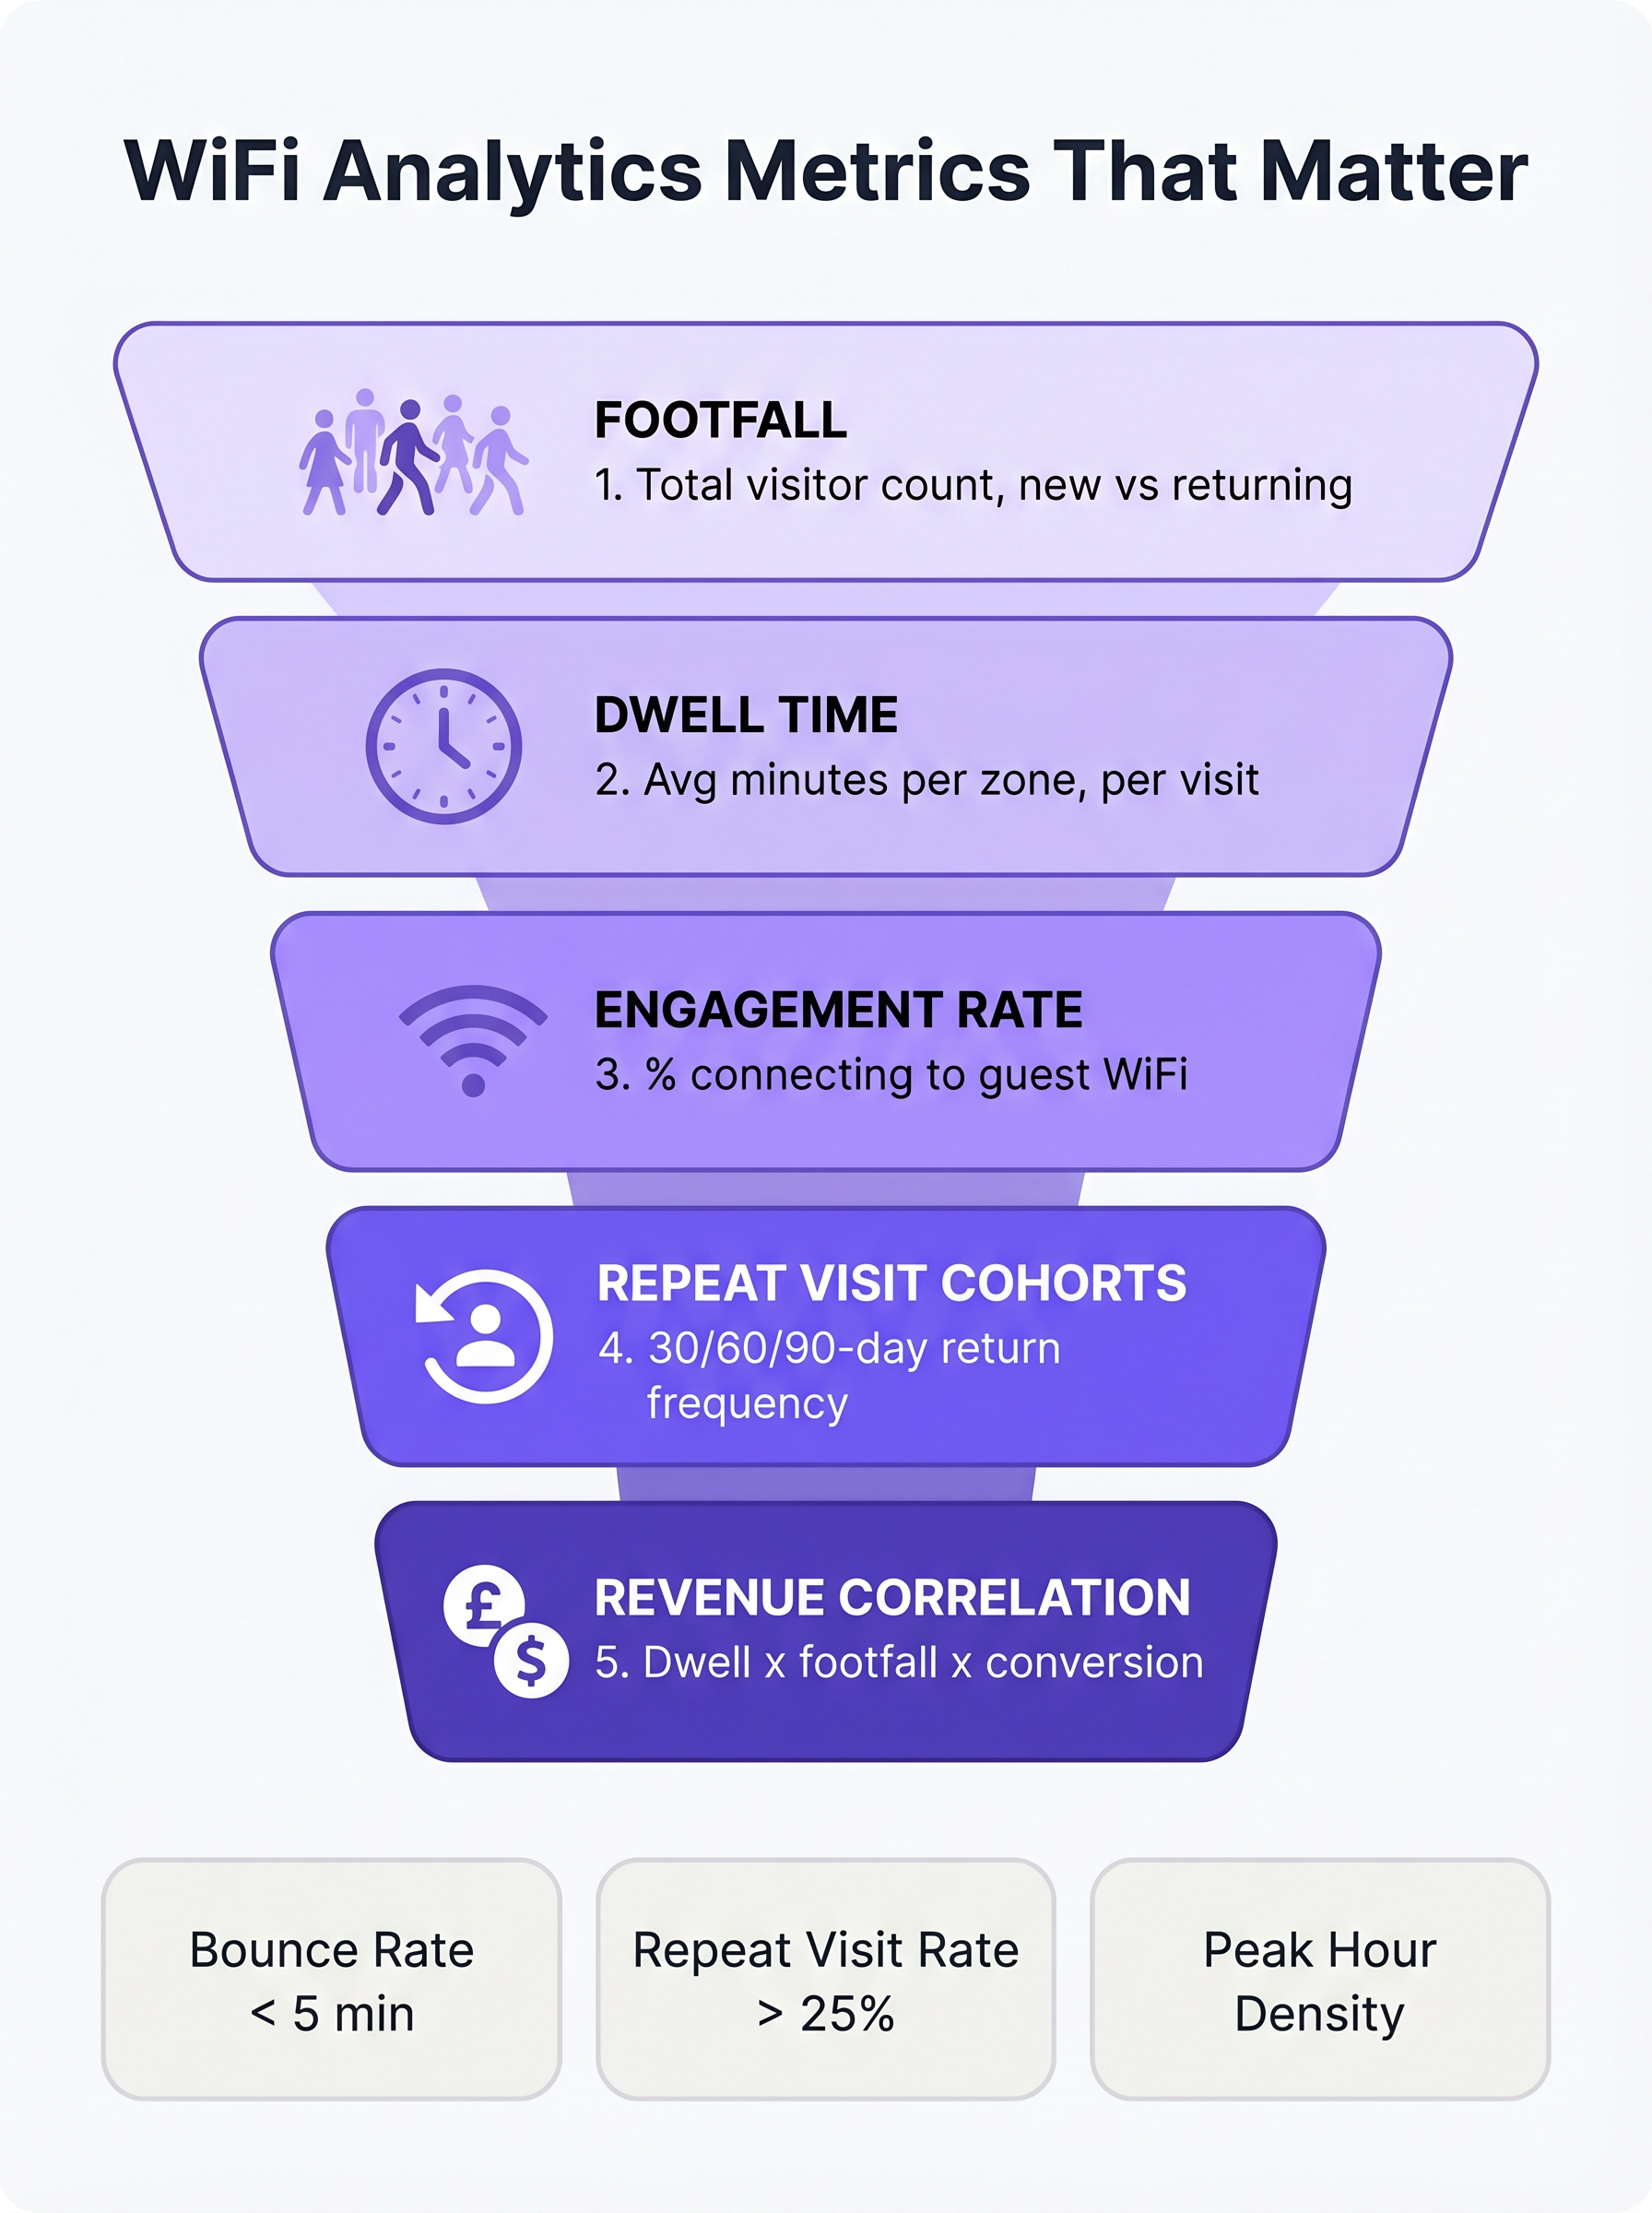
Análise Técnica Aprofundada: As Cinco Métricas que Importam
Ao avaliar uma plataforma de Guest WiFi para um ambiente de varejo, o foco deve mudar da capacidade da rede para a inteligência do cliente. As cinco métricas a seguir formam a base de uma estratégia madura de análise de varejo.
1. Fluxo de Pessoas: Além da Simples Contagem de Conexões
No contexto de WiFi analytics, o fluxo de pessoas é a contagem de dispositivos únicos detectados em um local durante um período específico. Crucialmente, plataformas empresariais utilizam detecção passiva de sondagem para identificar dispositivos mesmo que não se autentiquem na rede. Isso fornece uma representação significativamente mais precisa do tráfego total do local do que depender apenas de sessões autenticadas.
A sub-métrica mais crítica dentro do fluxo de pessoas é a distinção entre visitantes novos e recorrentes. Uma alta proporção de novos visitantes indica marketing eficaz no topo do funil ou uma localização privilegiada, enquanto uma forte taxa de visitantes recorrentes demonstra fidelidade e retenção de clientes.
2. Tempo de Permanência: O Principal Impulsionador do Tamanho da Cesta
O tempo de permanência mede a duração que um dispositivo permanece dentro do local ou de uma zona de detecção específica. No varejo, o tempo de permanência é consistentemente um dos mais fortes preditores do valor da transação.
Para medir efetivamente o tempo de permanência, as equipes de TI devem configurar a rede para diferenciar entre três estados primários de visitante:
- Rejeição (Menos de 5 minutos): O visitante entrou no local, mas não interagiu.
- Navegação (5-15 minutos): O visitante está explorando ativamente o ambiente de varejo.
- Engajado (Mais de 15 minutos): O visitante está altamente engajado, embora tempos de permanência excessivos em zonas específicas (por exemplo, a área de checkout) possam indicar atrito operacional.
O tempo de permanência em nível de zona é particularmente valioso. Ao implantar estrategicamente APs e Sensores em áreas distintas (por exemplo, entrada, vestuário, eletrônicos, checkout), os diretores de operações podem identificar exatamente onde os clientes passam seu tempo.
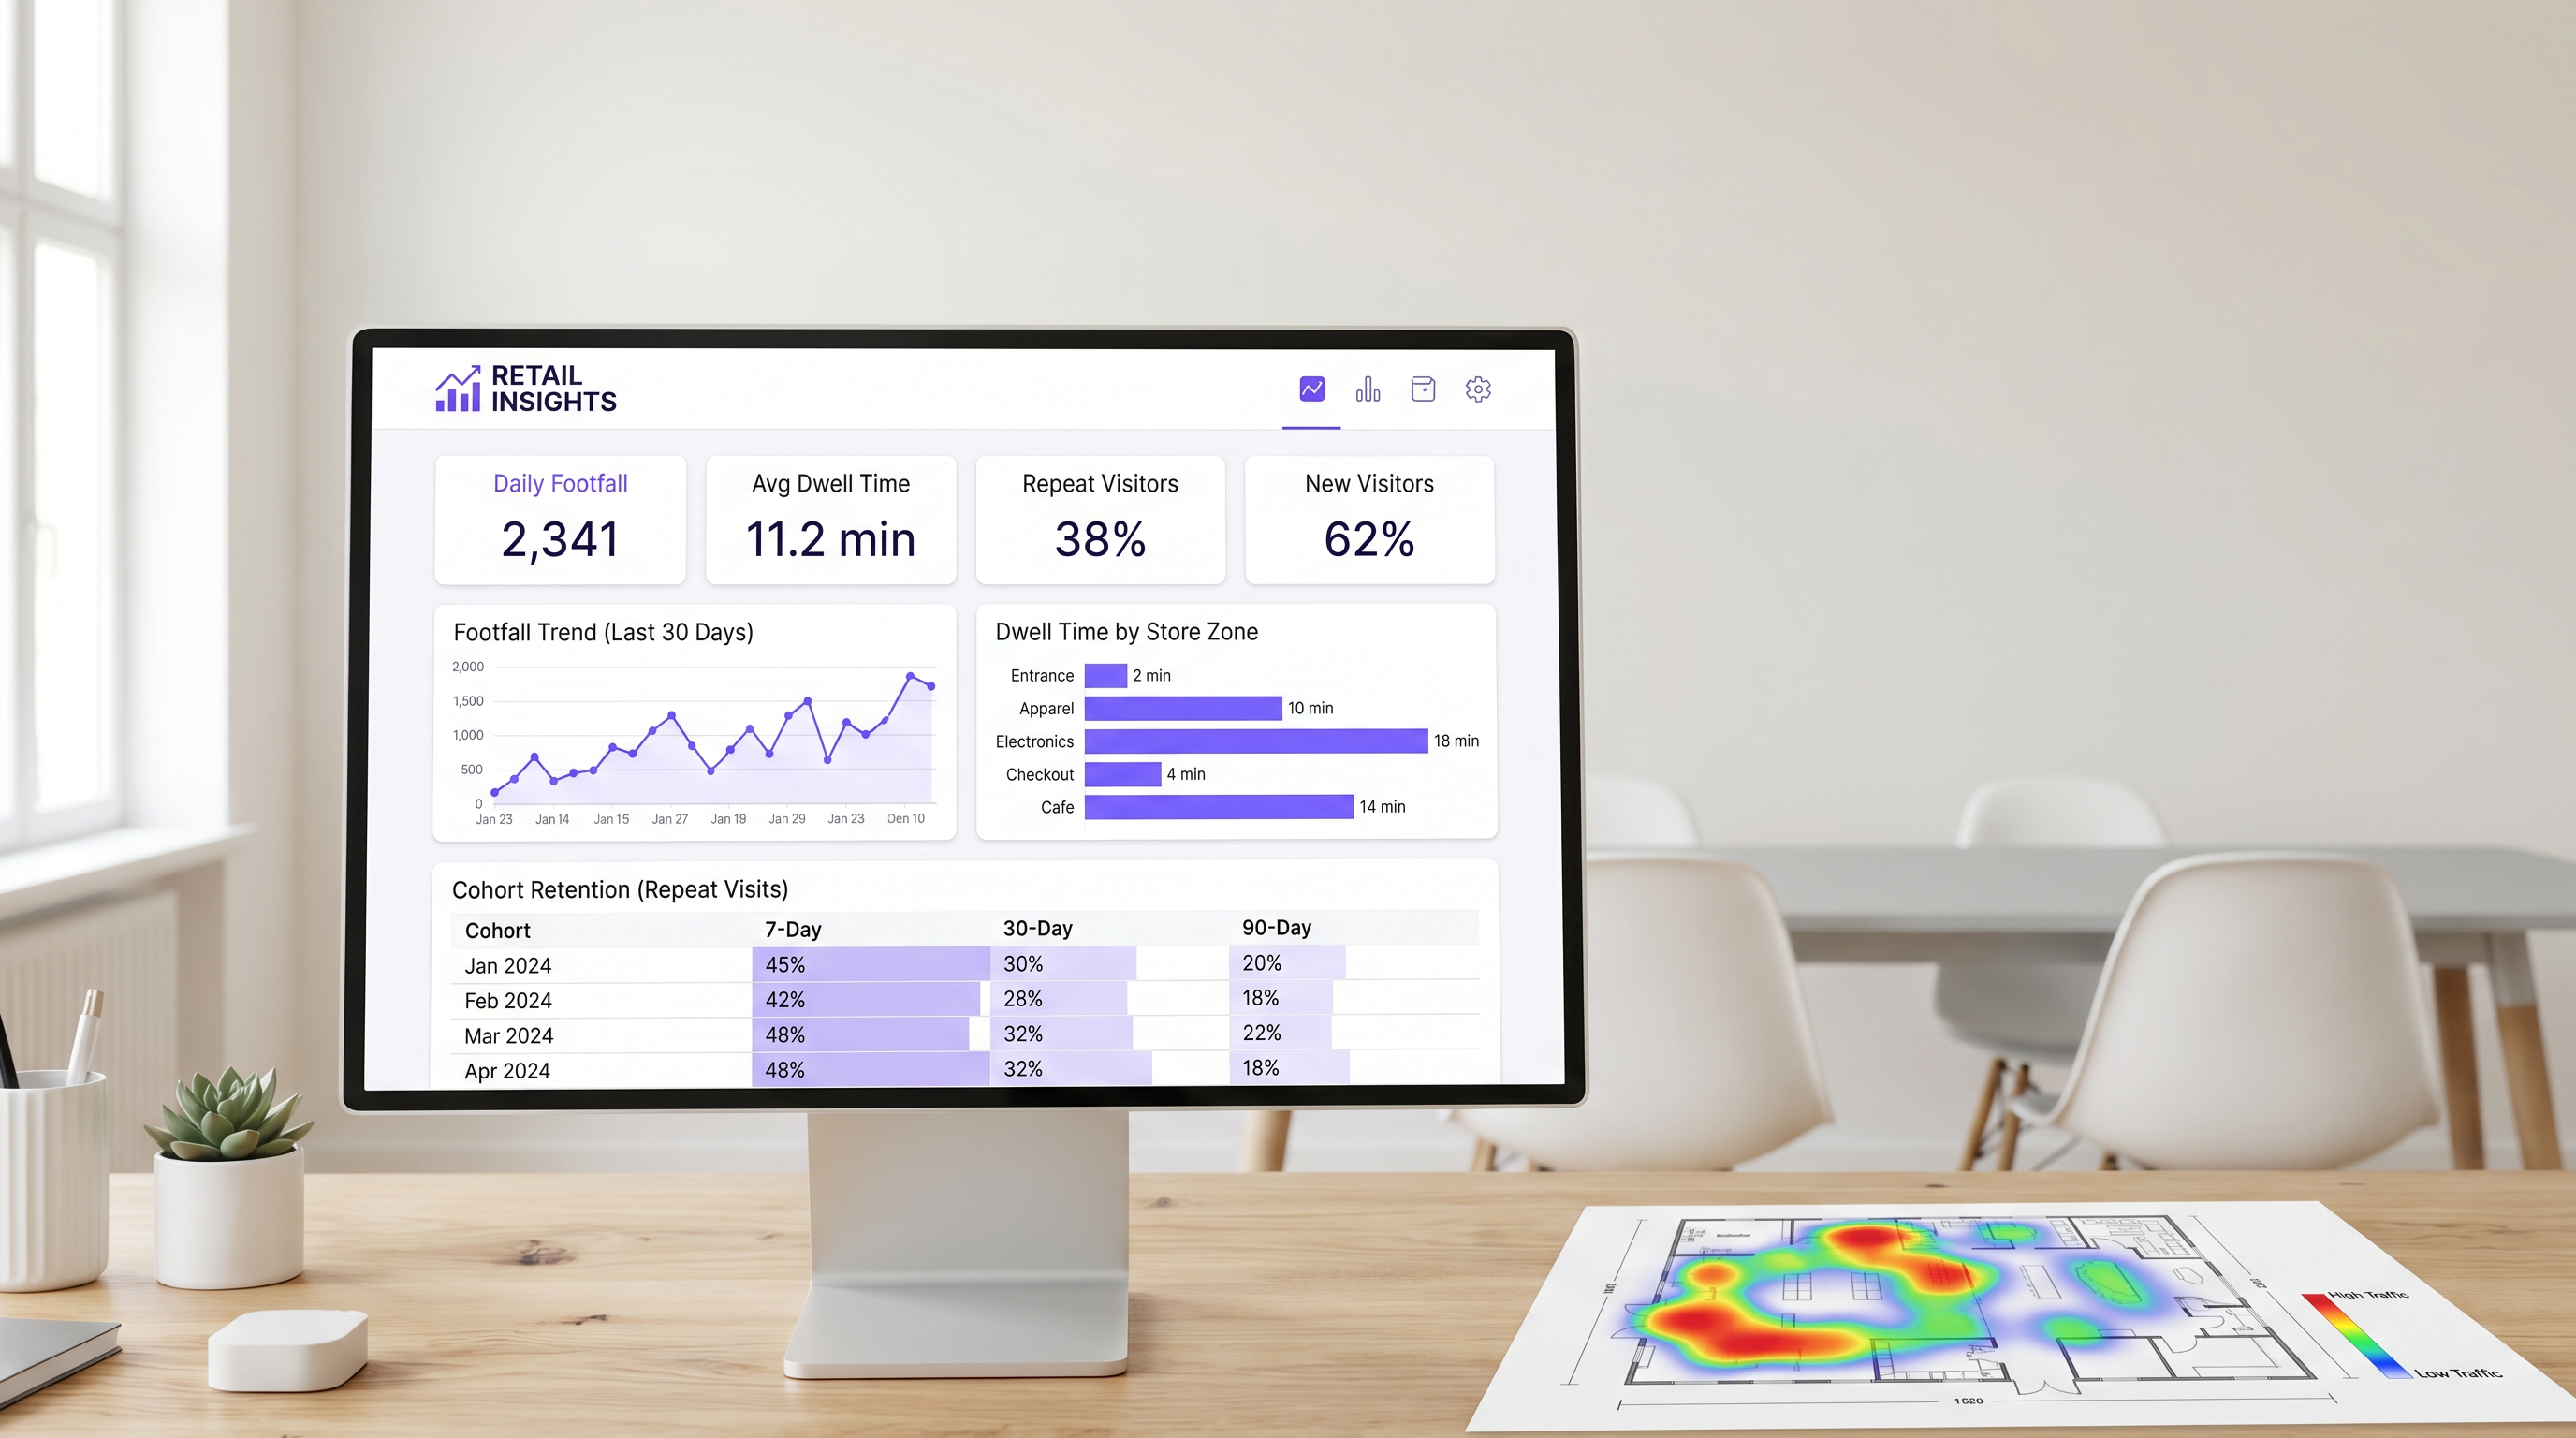
3. Taxa de Engajamento: O Funil de Captura de Dados
A taxa de engajamento é a porcentagem de dispositivos detectados que se autenticam com sucesso na rede de convidados via Captive Portal. Esta métrica representa a transição do rastreamento anônimo de dispositivos para o perfil de cliente identificado.
Um fluxo de autenticação sem atrito — utilizando login social, captura de e-mail ou provedores de identidade contínuos como OpenRoaming — é essencial para maximizar o engajamento. Em ambientes de varejo, um Captive Portal bem otimizado deve atingir uma taxa de engajamento de 25% a 40%. Locais com tempos de permanência naturais mais longos, como Hotelaria ou hubs de Transporte , geralmente veem taxas de conversão ainda maiores.
4. Coortes de Visitas Repetidas: Medindo a Verdadeira Fidelidade
A análise de coortes agrupa visitantes com base no período de sua primeira visita (por exemplo, janeiro de 2025) e rastreia sua frequência de retorno em intervalos subsequentes (geralmente 7, 30 e 90 dias). Isso fornece uma medida robusta de retenção de clientes derivada inteiramente de dados de rede, sem a necessidade de um aplicativo de fidelidade separado.
Para Varejo de conveniência, uma taxa de retorno saudável em 7 dias está tipicamente entre 30% e 45%. Para mercadorias em geral, este número está mais próximo de 15% a 25%. Se a retenção em 90 dias cair abaixo de 10%, o local enfrenta um desafio sistêmico de fidelidade.
5. Correlação de Receita: Conectando TI e Marketing
O objetivo final do WiFi analytics é correlacionar dados de rede com o desempenho financeiro. Ao integrar a plataforma WiFi com sistemas POS via APIs padrão, as equipes de operações podem mapear o fluxo de pessoas e o tempo de permanência em relação às taxas de conversão e aos valores médios de transação.
Quando o fluxo de pessoas aumenta, mas a receita permanece estável, o problema reside na conversão. Quando o tempo de permanência cai, a receita geralmente segue em poucas semanas. Esta métrica composta serve como um indicador líder para o desempenho da loja, permitindo ajustes operacionais proativos.
Guia de Implementação: Arquitetura de umd Implantação
A implantação de uma solução de análise de WiFi exige uma mudança fundamental na filosofia de design de rede. As equipes de TI devem projetar para a captura de dados, não apenas para a cobertura.
Posicionamento de Access Points para Detecção de Zona
O design de rede padrão baseado em cobertura geralmente posiciona os APs em locais centrais para maximizar a propagação do sinal. No entanto, para medir com precisão o tempo de permanência no nível da zona, os APs devem ser posicionados para criar limites de detecção distintos. Isso frequentemente exige uma densidade maior de APs, principalmente em ambientes de varejo de grande formato.
Antes da instalação, os arquitetos de rede devem sobrepor os locais propostos dos APs ao plano de merchandising da loja. Isso garante que os dados resultantes se alinhem com as zonas operacionais do negócio.
Mitigando a Randomização de Endereço MAC
Sistemas operacionais móveis modernos (iOS 14+ e Android 10+) implementam a randomização de endereço MAC para proteger a privacidade do usuário. Quando um dispositivo sonda redes, ele usa um endereço MAC temporário e randomizado em vez de seu endereço de hardware verdadeiro.
Para manter dados precisos de fluxo de pessoas e coorte, as plataformas de WiFi corporativas devem empregar técnicas sofisticadas de normalização estatística e depender fortemente de dados de sessão autenticada. Quando um usuário se autentica via captive portal, a plataforma pode vincular o endereço MAC randomizado a um perfil de usuário persistente, garantindo a continuidade entre as visitas. Para mais informações sobre estruturas de privacidade, consulte nosso guia sobre CCPA vs GDPR: Conformidade Global de Privacidade para Dados de WiFi de Convidados .
Melhores Práticas e Solução de Problemas
Alinhando TI e Marketing
O modo de falha mais comum para implantações de análise de WiFi é a falta de alinhamento entre TI e marketing. Para garantir que a plataforma entregue um ROI mensurável (veja Medindo o ROI do WiFi de Convidados: Uma Estrutura para CMOs ), ambas as equipes devem concordar com um painel de KPIs unificado antes da implantação. A TI é responsável pela precisão da captura de dados, enquanto o marketing é responsável pela execução de campanhas baseadas nos insights.
Desempenho de Rede e SD-WAN
À medida que os ambientes de varejo se tornam cada vez mais dependentes de análises baseadas em nuvem e integrações de POS, a Rede de Longa Distância (WAN) subjacente deve ser robusta e resiliente. A implementação de uma arquitetura Software-Defined WAN (SD-WAN) garante que dados críticos de análise e tráfego de autenticação sejam priorizados sobre o acesso geral à internet para convidados. Para uma análise mais aprofundada da arquitetura de rede, revise Os Principais Benefícios do SD WAN para Empresas Modernas .
Termos-Chave e Definições
Passive Probe Detection
The ability of a WiFi access point to detect devices that are searching for networks, even if those devices do not connect to the guest WiFi.
Essential for accurate footfall measurement, as it captures the 60-70% of visitors who do not actively authenticate to the network.
MAC Address Randomisation
A privacy feature in modern mobile OSs that generates a temporary hardware address when probing for networks, preventing persistent tracking of unauthenticated devices.
Forces IT teams to rely on sophisticated statistical normalisation and authenticated session data to maintain accurate cohort and repeat visit metrics.
Captive Portal
A web page that users are required to view and interact with before being granted access to a public WiFi network.
The primary data capture mechanism for marketing teams, transitioning anonymous devices into identified customer profiles.
Zone-Level Dwell Time
The measurement of how long a detected device remains within a specific, defined physical area of a venue (e.g., the checkout queue or a specific department).
Requires precise AP placement and RSSI calibration, but provides the most actionable data for store operations and merchandising teams.
Cohort Analysis
A method of grouping visitors based on the date of their first visit and tracking their subsequent return rates over 7, 30, and 90-day intervals.
Provides a network-derived measure of customer loyalty and retention without requiring a dedicated mobile application or loyalty card.
Engagement Rate
The percentage of total detected devices (footfall) that successfully authenticate and connect to the guest WiFi network.
A critical metric for evaluating the effectiveness and user experience of the captive portal.
RSSI (Received Signal Strength Indicator)
A measurement of the power present in a received radio signal.
Used by analytics platforms to estimate the distance of a device from an access point and determine which physical zone the device is located in.
OpenRoaming
A standard that allows users to seamlessly and securely connect to participating guest WiFi networks using a persistent identity profile.
Reduces authentication friction, significantly increasing the engagement rate and providing highly accurate, persistent user data.
Estudos de Caso
A 50,000 sq ft big-box retailer is deploying a new WiFi network and wants to measure dwell time specifically in their high-margin electronics department versus their low-margin homewares department. How should the IT team approach the deployment?
The IT team must abandon a pure coverage-based design. Instead of placing APs centrally for maximum range, they should deploy directional antennas or lower-power APs specifically targeted at the electronics and homewares zones to create distinct RF boundaries. They must configure the WiFi analytics platform to define these areas as separate tracking zones. Once deployed, they should conduct a physical walk-through with a test device to calibrate the Received Signal Strength Indicator (RSSI) thresholds that define when a device transitions from one zone to another.
A stadium operations director notes that while their total detected footfall is 40,000 per match, their captive portal engagement rate is only 8%. How can the IT and marketing teams collaborate to improve this metric?
The low engagement rate suggests friction in the authentication process or a lack of perceived value. The IT team should review the captive portal architecture to ensure it supports seamless authentication methods, such as social login or profile-based authentication (e.g., OpenRoaming). Simultaneously, the marketing team should update the portal design to clearly communicate the value exchange—for example, offering in-seat ordering or exclusive replays in exchange for authentication. Furthermore, the IT team should ensure the captive portal loads rapidly, even under high concurrent user load.
Análise de Cenário
Q1. Your marketing director complains that the 'Repeat Visitor' metric on the dashboard dropped suddenly last month, despite store sales remaining stable. What is the most likely technical cause?
💡 Dica:Consider recent changes to mobile operating systems and how devices probe for networks.
Mostrar Abordagem Recomendada
The most likely cause is an OS update that increased the prevalence or aggression of MAC address randomisation. If the analytics platform relies heavily on passive probe data without robust statistical normalisation, randomised MACs will appear as 'New Visitors' rather than 'Returning Visitors'. The IT team should verify the platform's normalisation algorithms and work to increase the captive portal engagement rate to capture more authenticated, persistent sessions.
Q2. A retail chain wants to measure the conversion rate of their window displays. They place an AP right at the entrance. The data shows high footfall but an average dwell time of only 45 seconds. How should operations interpret this?
💡 Dica:Differentiate between venue-level dwell time and zone-level dwell time.
Mostrar Abordagem Recomendada
This indicates a high 'bounce rate'. Customers are entering the detection zone (the entrance) but not proceeding further into the store. The window display is successfully generating initial interest (footfall), but the immediate in-store experience is failing to convert that interest into a 'browse' state. Operations should evaluate the store layout immediately inside the entrance to remove friction or improve merchandising.
Q3. You are designing the network for a new flagship store. Marketing requires precise dwell time data for five specific departments. How does this requirement change your hardware deployment strategy compared to a standard office deployment?
💡 Dica:Think about the difference between designing for coverage versus designing for location accuracy.
Mostrar Abordagem Recomendada
A standard office deployment focuses on providing adequate signal coverage with the minimum number of APs. To provide precise zone-level analytics, the deployment must focus on location accuracy. This requires a higher density of APs to create overlapping detection zones, allowing the system to use RSSI triangulation to pinpoint device locations accurately. You may also need to deploy Bluetooth Low Energy (BLE) beacons or dedicated sensors to augment the WiFi data in highly granular zones.
Principais Conclusões
- ✓Focus on the five metrics that matter: Footfall, Dwell Time, Engagement Rate, Repeat Visit Cohorts, and Revenue Correlation.
- ✓Passive probe detection captures 60-70% more footfall data than relying on authenticated connections alone.
- ✓Dwell time is a primary driver of basket size; customers staying over 8 minutes spend 2-3x more.
- ✓Design your AP layout to create distinct RF boundaries for accurate zone-level analytics, not just maximum coverage.
- ✓Mitigate MAC address randomisation by optimising your captive portal to increase the engagement rate and capture authenticated sessions.
- ✓Align IT and marketing on a shared KPI dashboard before deployment to ensure the platform delivers measurable ROI.
