WiFi Analytics-Metriken, die im Einzelhandel wirklich zählen
Dieser maßgebliche Leitfaden beschreibt die fünf WiFi Analytics-Metriken, die direkt mit Einzelhandelsumsatz, Verweildauer und Kundenbindung korrelieren. Er bietet IT-Managern und Betriebsleitern von Veranstaltungsorten einen praktischen Rahmen für die Konfiguration von Netzwerk-Hardware, die Minderung der Auswirkungen der MAC-Randomisierung und die Abstimmung mit Marketingteams auf ein einheitliches Daten-Dashboard.
🎧 Diesen Leitfaden anhören
Transkript anzeigen

Zusammenfassung für Führungskräfte
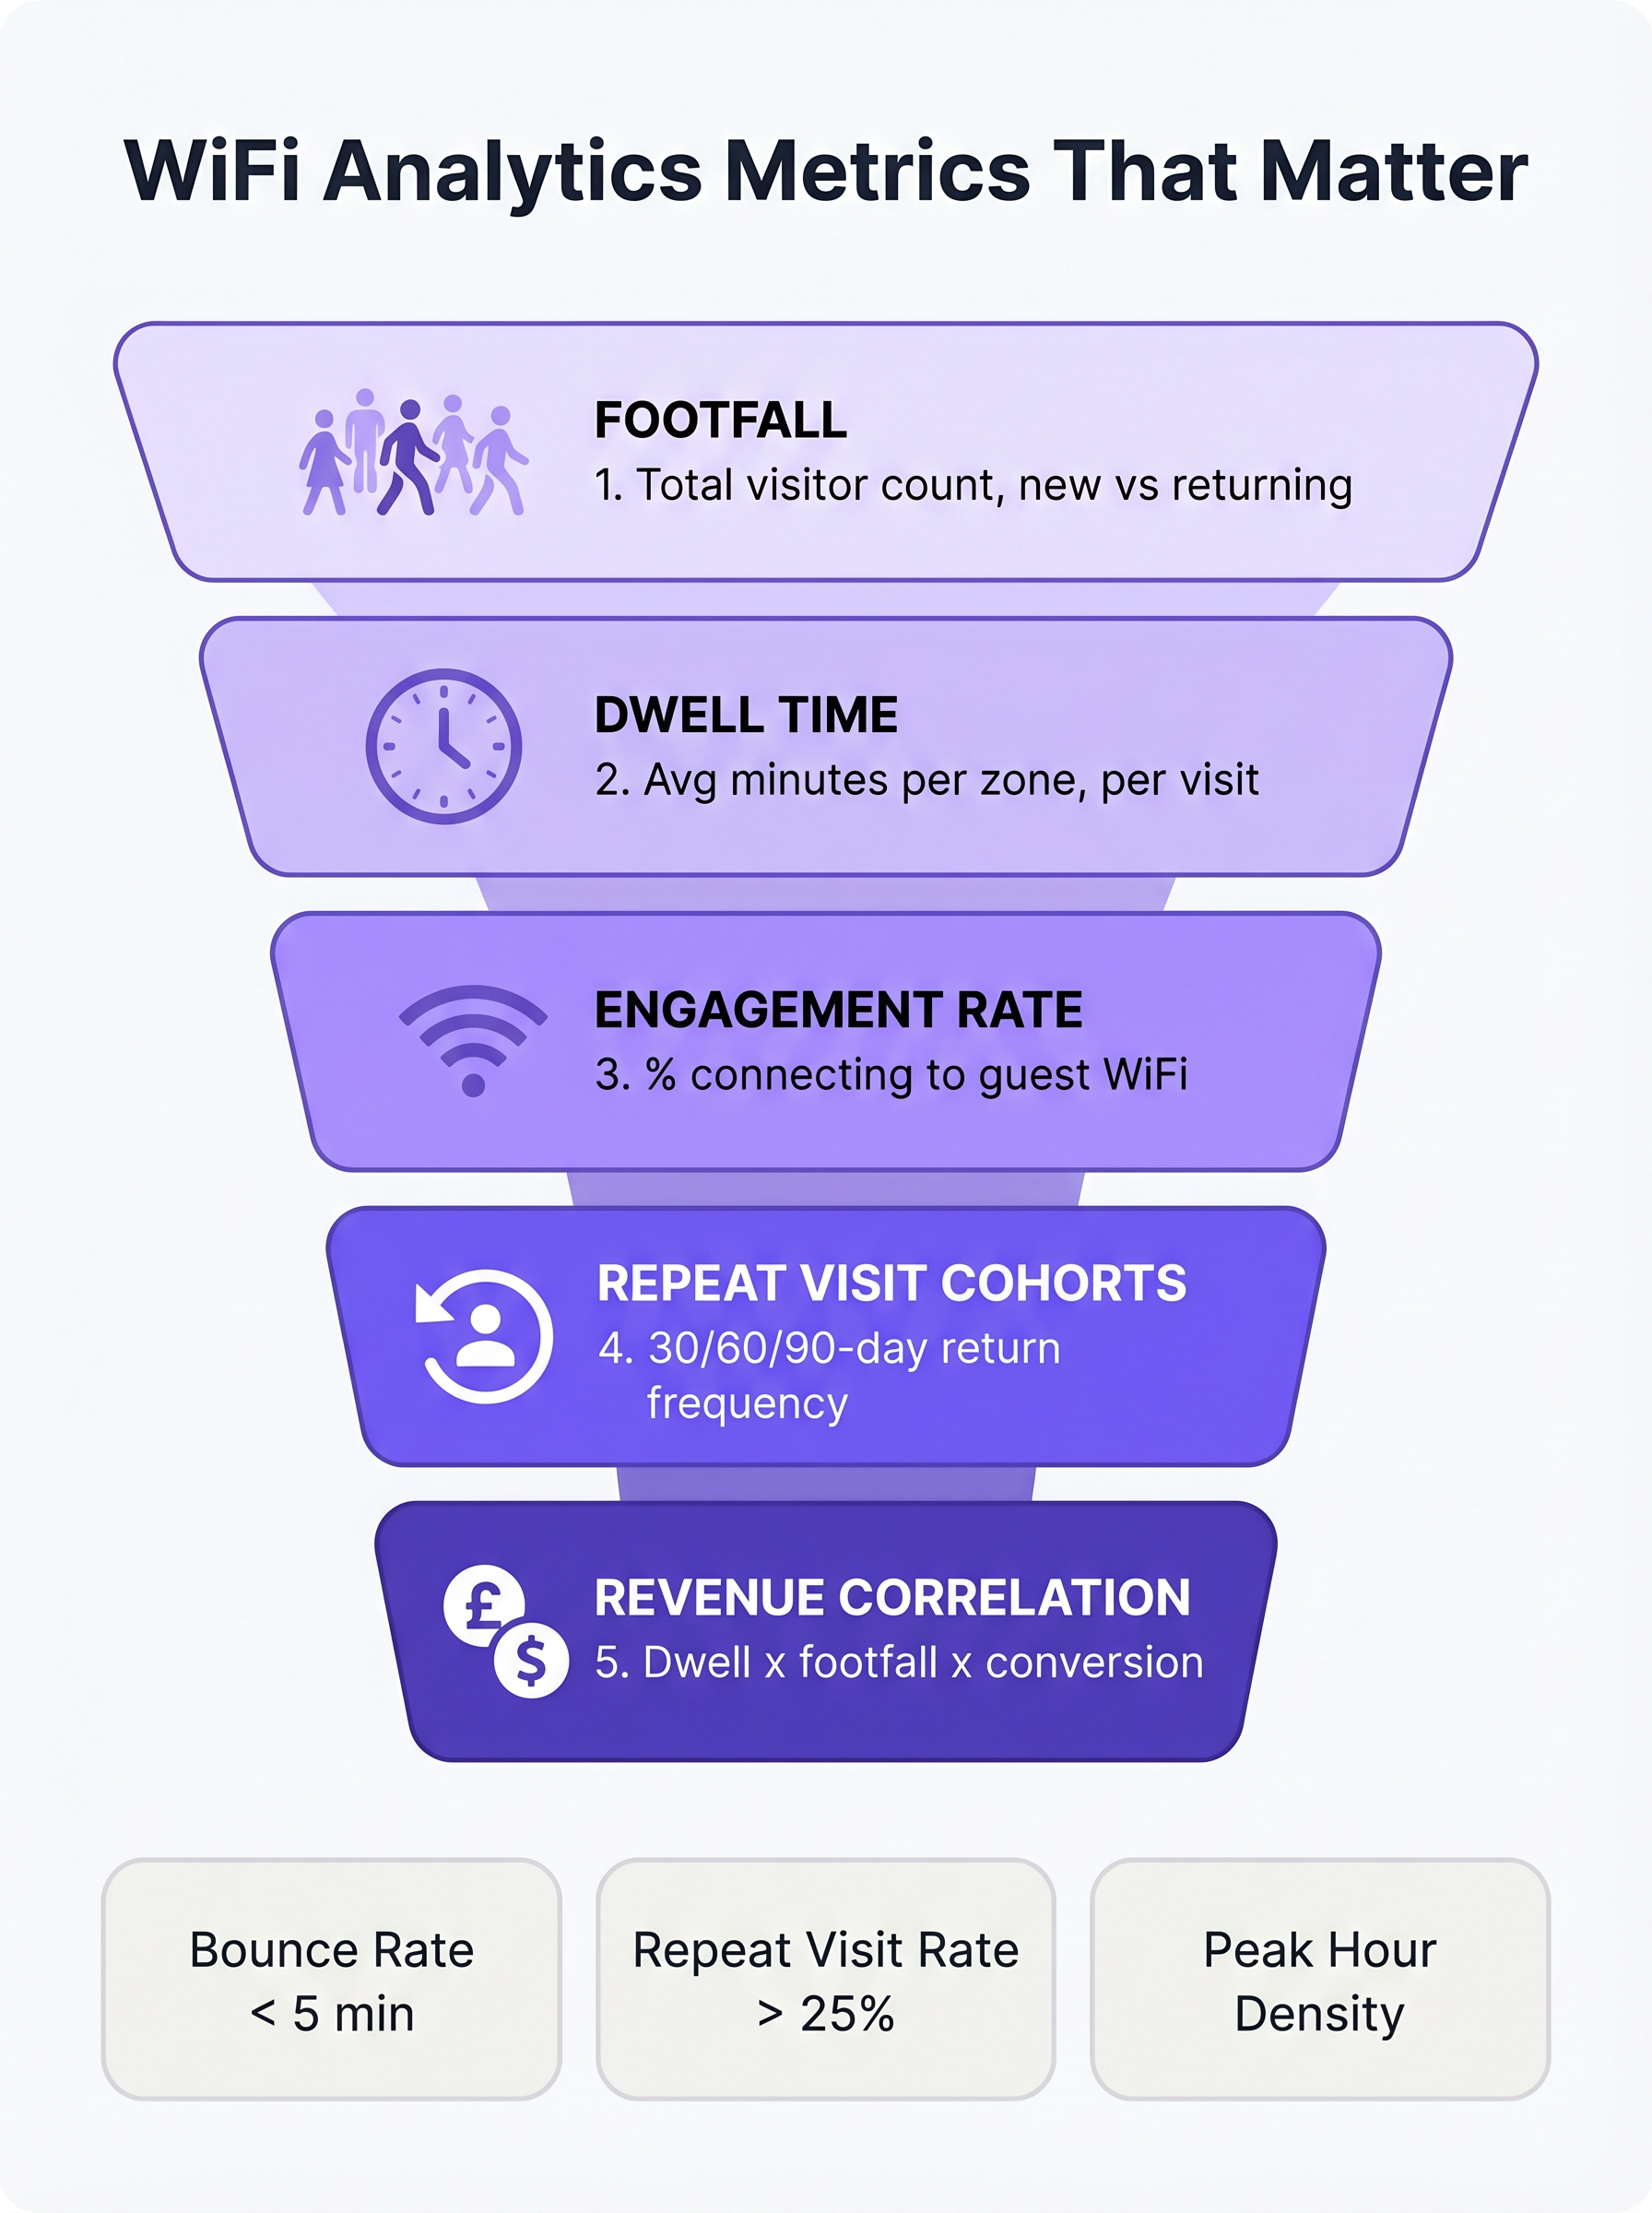
Für IT-Manager und Betriebsleiter von Veranstaltungsorten im Einzelhandel, Gastgewerbe und bei Großveranstaltungen ist WiFi nicht länger nur ein Konnektivitätsdienst; es ist das primäre Sensornetzwerk für physische Räume. Die Standardmetriken der meisten Netzwerkmanagementsysteme – wie der gesamte Bandbreitenverbrauch oder die Spitzenanzahl gleichzeitiger Verbindungen – bieten jedoch nur begrenzte Business Intelligence. Um einen messbaren ROI zu erzielen, müssen sich IT- und Marketingteams auf Metriken einigen, die mit dem Kundenverhalten korrelieren: Besucherfrequenz, Verweildauer, Engagement-Rate, Kohorten wiederkehrender Besucher und Umsatzkorrelation.
Dieser Leitfaden geht über reine Schönheitsmetriken hinaus und konzentriert sich auf die WiFi Analytics Key Performance Indicators (KPIs), die für den Einzelhandel wirklich relevant sind. Er bietet einen technischen Rahmen für die Konfiguration von Access Points (APs) zur Erfassung präziser Daten auf Zonenebene, zur Minderung der Auswirkungen der MAC-Adressen-Randomisierung und zur Integration von WiFi Analytics mit Point of Sale (POS)- und Customer Relationship Management (CRM)-Systemen. Durch den Übergang von der grundlegenden Netzwerküberwachung zu erweiterten WiFi Analytics können Betriebsleiter ihre Infrastruktur in ein umsatzgenerierendes Asset verwandeln.
Hören Sie sich das begleitende Audio-Briefing an, um einen Überblick über diese Konzepte zu erhalten:
Technischer Deep-Dive: Die fünf Metriken, die zählen
Bei der Bewertung einer Guest WiFi -Plattform für den Einzelhandel muss sich der Fokus von der Netzwerkkapazität auf die Kundenintelligenz verlagern. Die folgenden fünf Metriken bilden die Grundlage einer ausgereiften Einzelhandelsanalyse-Strategie.
1. Besucherfrequenz: Mehr als nur einfache Verbindungszählungen
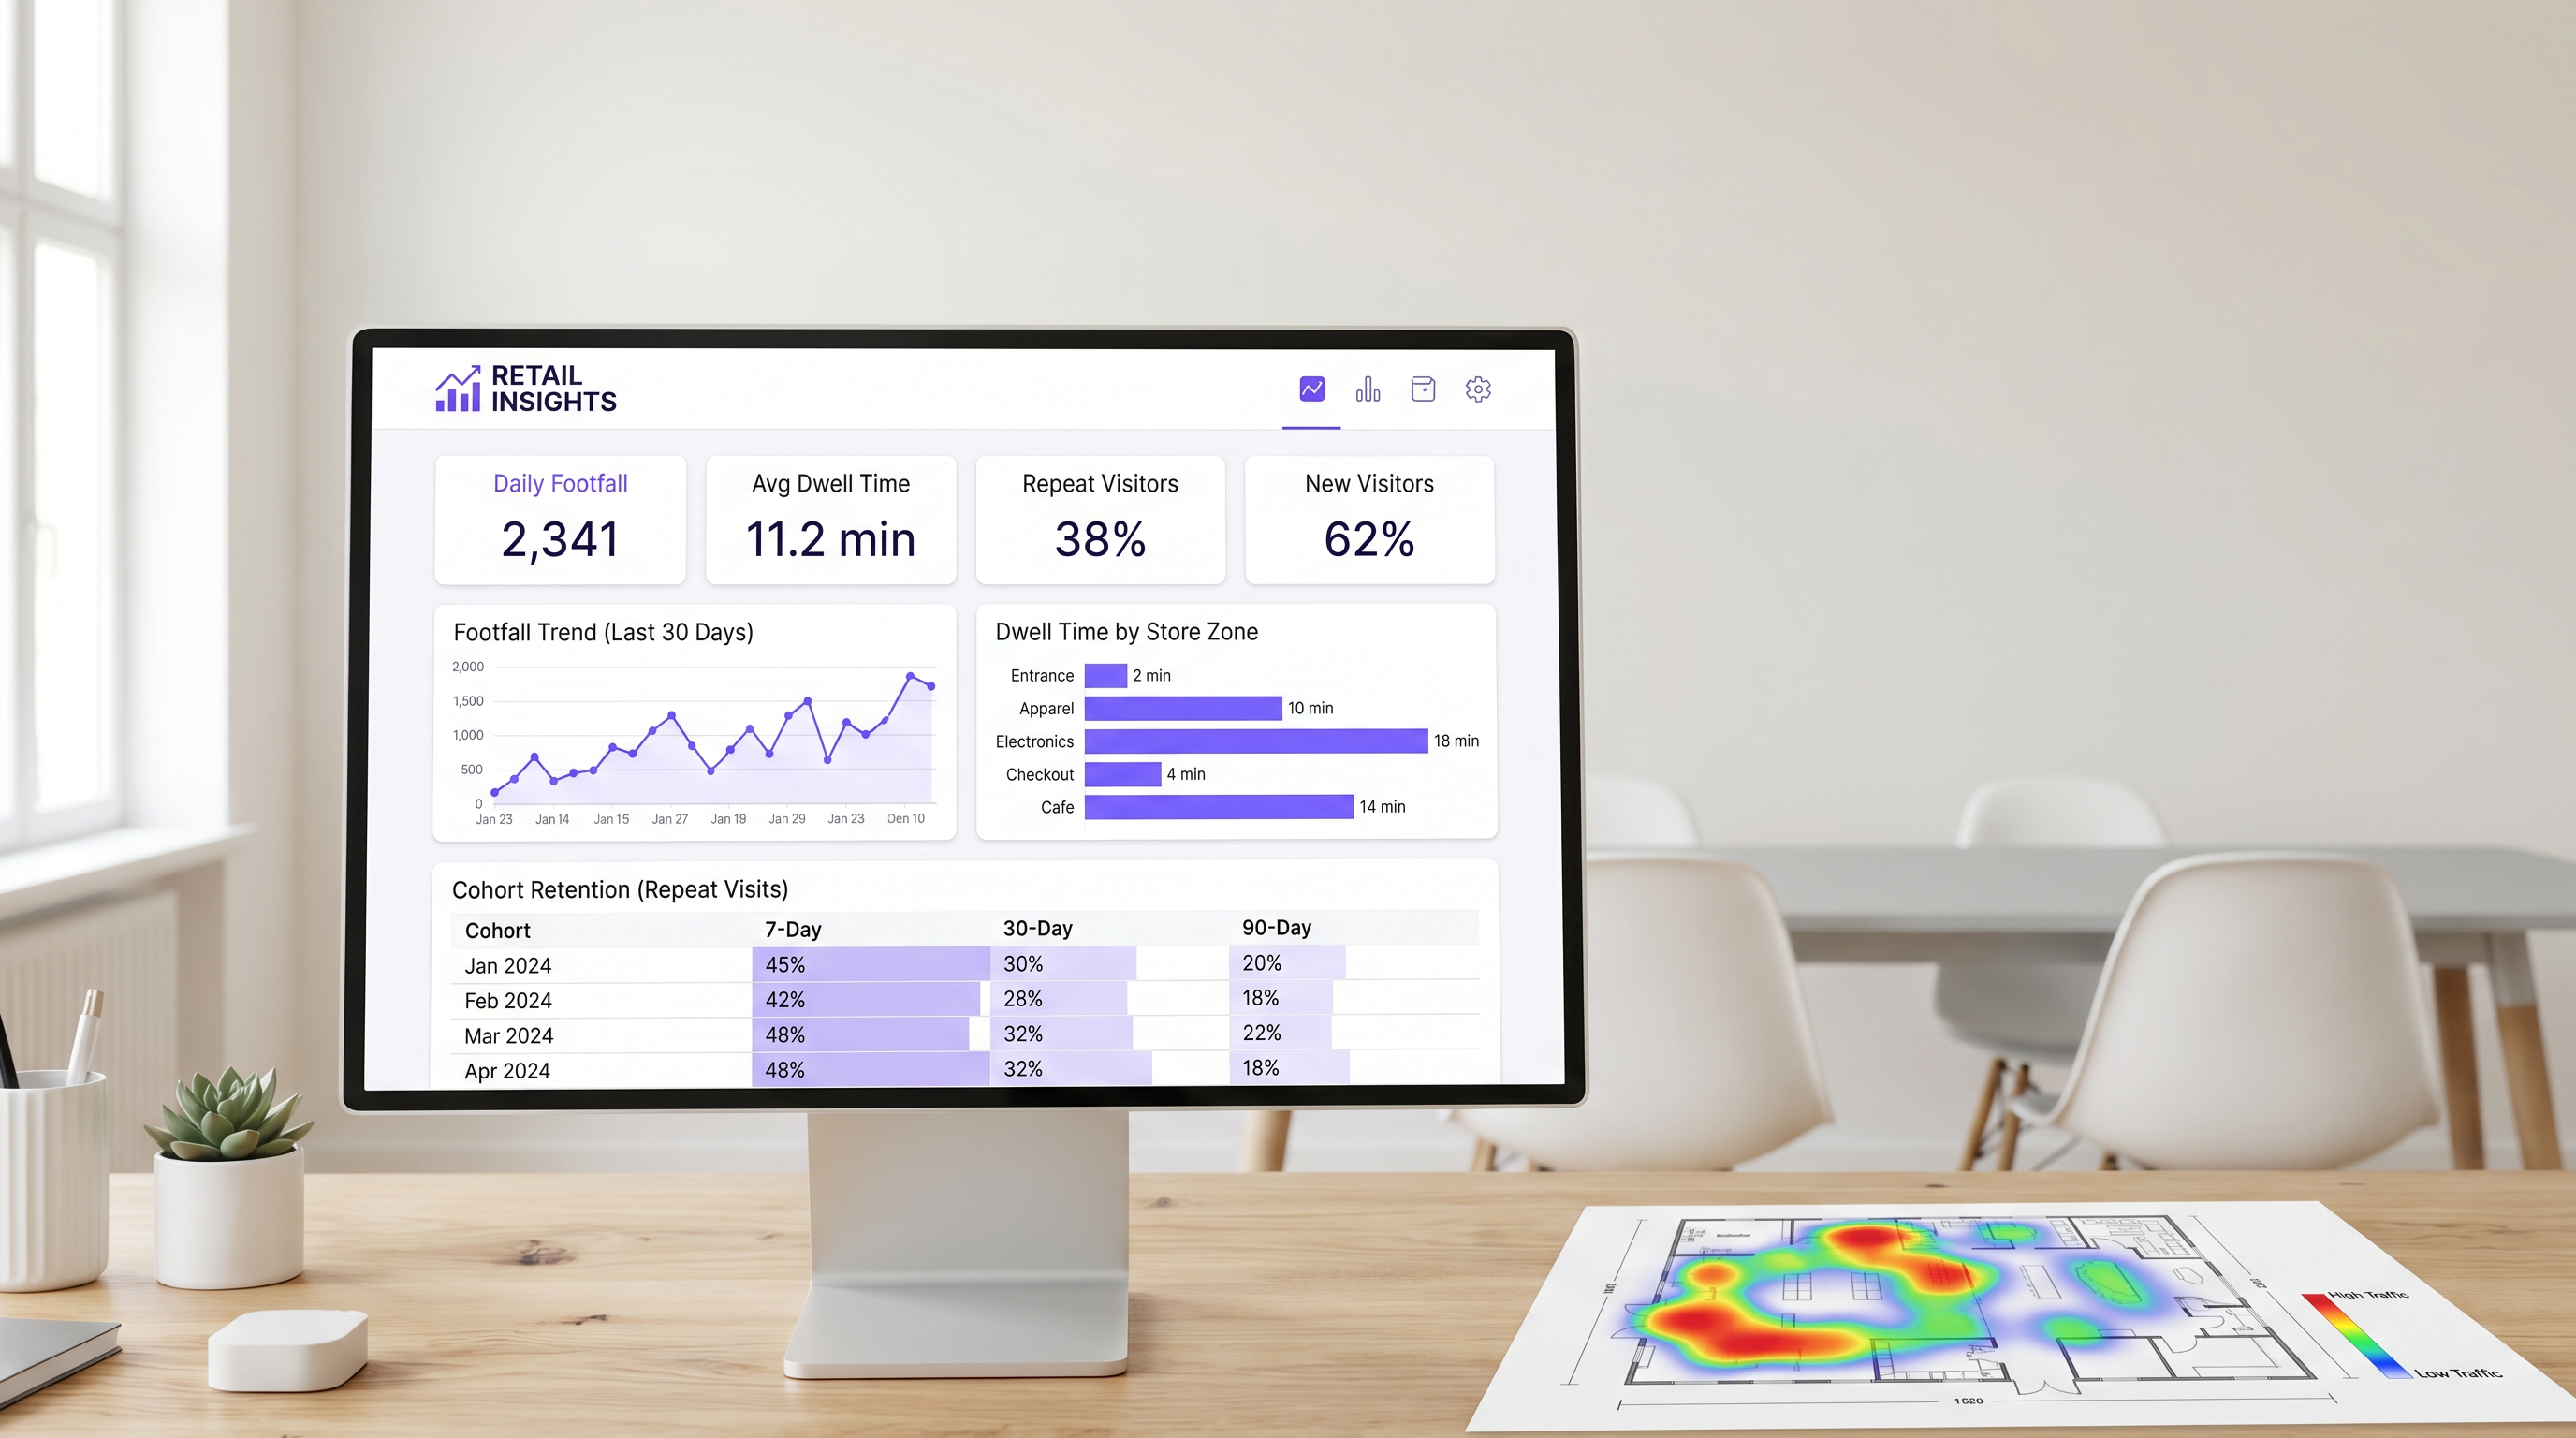
Im Kontext von WiFi Analytics ist die Besucherfrequenz die Anzahl der eindeutigen Geräte, die innerhalb eines Veranstaltungsortes über einen bestimmten Zeitraum erkannt werden. Entscheidend ist, dass Unternehmensplattformen die passive Sondenerkennung nutzen, um Geräte zu identifizieren, selbst wenn sie sich nicht im Netzwerk authentifizieren. Dies bietet eine wesentlich genauere Darstellung des gesamten Veranstaltungsort-Traffics, als sich ausschließlich auf authentifizierte Sitzungen zu verlassen.
Die wichtigste Untermetrik innerhalb der Besucherfrequenz ist die Unterscheidung zwischen neuen und wiederkehrenden Besuchern. Ein hoher Anteil neuer Besucher deutet auf effektives Top-of-Funnel-Marketing oder einen erstklassigen Standort hin, während eine hohe Rate wiederkehrender Besucher Kundenbindung und -loyalität beweist.
2. Verweildauer: Der Haupttreiber der Warenkorbgröße
Die Verweildauer misst die Zeitspanne, die ein Gerät innerhalb des Veranstaltungsortes oder einer bestimmten Erfassungszone verbleibt. Im Einzelhandel ist die Verweildauer durchweg einer der stärksten Prädiktoren für den Transaktionswert.
Um die Verweildauer effektiv zu messen, müssen IT-Teams das Netzwerk so konfigurieren, dass es zwischen drei primären Besucherzuständen unterscheidet:
- Absprung (unter 5 Minuten): Der Besucher betrat den Veranstaltungsort, interagierte aber nicht.
- Stöbern (5-15 Minuten): Der Besucher erkundet aktiv die Einzelhandelsumgebung.
- Engagiert (über 15 Minuten): Der Besucher ist stark engagiert, wobei übermäßige Verweildauern in bestimmten Zonen (z. B. im Kassenbereich) auf operative Reibung hinweisen können.
Die Verweildauer auf Zonenebene ist besonders wertvoll. Durch den strategischen Einsatz von APs und Sensoren in verschiedenen Bereichen (z. B. Eingang, Bekleidung, Elektronik, Kasse) können Betriebsleiter genau bestimmen, wo Kunden ihre Zeit verbringen.
3. Engagement-Rate: Der Datenerfassungs-Funnel
Die Engagement-Rate ist der Prozentsatz der erkannten Geräte, die sich erfolgreich über das Captive Portal im Gastnetzwerk authentifizieren. Diese Metrik repräsentiert den Übergang von der anonymen Geräteverfolgung zur identifizierten Kundenprofilierung.
Ein reibungsloser Authentifizierungsfluss – unter Verwendung von Social Login, E-Mail-Erfassung oder nahtlosen Identitätsanbietern wie OpenRoaming – ist entscheidend für die Maximierung des Engagements. In Einzelhandelsumgebungen sollte ein gut optimiertes Captive Portal eine Engagement-Rate von 25 % bis 40 % erreichen. Veranstaltungsorte mit längeren natürlichen Verweildauern, wie z. B. im Gastgewerbe oder in Verkehrsknotenpunkten , verzeichnen typischerweise noch höhere Konversionsraten.
4. Kohorten wiederkehrender Besucher: Echte Loyalität messen
Die Kohortenanalyse gruppiert Besucher basierend auf dem Zeitraum ihres ersten Besuchs (z. B. Januar 2025) und verfolgt deren Rückkehrhäufigkeit über nachfolgende Intervalle (typischerweise 7, 30 und 90 Tage). Dies bietet ein robustes Maß für die Kundenbindung, das vollständig aus Netzwerkdaten abgeleitet wird, ohne dass eine separate Loyalitätsanwendung erforderlich ist.
Für den Convenience Einzelhandel liegt eine gesunde 7-Tage-Rückkehrerquote typischerweise zwischen 30 % und 45 %. Für allgemeine Handelswaren liegt dieser Wert näher bei 15 % bis 25 %. Fällt die 90-Tage-Bindung unter 10 %, steht der Veranstaltungsort vor einer systemischen Loyalitätsherausforderung.
5. Umsatzkorrelation: IT und Marketing verbinden
Das ultimative Ziel von WiFi Analytics ist es, Netzwerkdaten mit der finanziellen Performance zu korrelieren. Durch die Integration der WiFi-Plattform mit POS-Systemen über Standard-APIs können Betriebsteams Besucherfrequenz und Verweildauer mit Konversionsraten und durchschnittlichen Transaktionswerten abgleichen.
Wenn die Besucherfrequenz steigt, der Umsatz aber stagniert, liegt das Problem in der Konversion. Wenn die Verweildauer sinkt, folgt der Umsatz typischerweise innerhalb weniger Wochen. Diese zusammengesetzte Metrik dient als Frühindikator für die Geschäftsleistung und ermöglicht proaktive operative Anpassungen.
Implementierungsleitfaden: Architektur eind Bereitstellung
Die Bereitstellung einer WiFi-Analyselösung erfordert eine grundlegende Änderung der Netzwerkdesign-Philosophie. IT-Teams müssen für die Datenerfassung und nicht nur für die Abdeckung konzipieren.
Platzierung von Access Points zur Zonenerkennung
Standardmäßige abdeckungsbasierte Netzwerkdesigns platzieren APs oft an zentralen Orten, um die Signalausbreitung zu maximieren. Um jedoch die Verweildauer auf Zonenebene genau zu messen, müssen APs so positioniert werden, dass sie klare Erkennungsgrenzen schaffen. Dies erfordert häufig eine höhere Dichte von APs, insbesondere in großflächigen Einzelhandelsumgebungen.
Vor der Installation sollten Netzwerkarchitekten die vorgeschlagenen AP-Standorte auf den Merchandising-Plan des Geschäfts legen. Dies stellt sicher, dass die resultierenden Daten mit den operativen Zonen des Unternehmens übereinstimmen.
Minderung der MAC-Adressen-Randomisierung
Moderne mobile Betriebssysteme (iOS 14+ und Android 10+) implementieren die MAC-Adressen-Randomisierung, um die Privatsphäre der Nutzer zu schützen. Wenn ein Gerät nach Netzwerken sucht, verwendet es eine temporäre, randomisierte MAC-Adresse anstelle seiner echten Hardware-Adresse.
Um genaue Besucher- und Kohortendaten zu erhalten, müssen Enterprise WiFi-Plattformen ausgeklügelte statistische Normalisierungstechniken anwenden und sich stark auf authentifizierte Sitzungsdaten verlassen. Wenn sich ein Benutzer über das captive portal authentifiziert, kann die Plattform die randomisierte MAC-Adresse mit einem persistenten Benutzerprofil verknüpfen, um die Kontinuität über Besuche hinweg zu gewährleisten. Weitere Informationen zu Datenschutz-Frameworks finden Sie in unserem Leitfaden zu CCPA vs GDPR: Global Privacy Compliance for Guest WiFi Data .
Best Practices und Fehlerbehebung
Abstimmung von IT und Marketing
Der häufigste Fehler bei der Bereitstellung von WiFi-Analysen ist eine mangelnde Abstimmung zwischen IT und Marketing. Um sicherzustellen, dass die Plattform einen messbaren ROI liefert (siehe Measuring ROI on Guest WiFi: A Framework for CMOs ), müssen sich beide Teams vor der Bereitstellung auf ein einheitliches KPI-Dashboard einigen. Die IT ist für die Genauigkeit der Datenerfassung verantwortlich, während das Marketing für die Durchführung von Kampagnen auf der Grundlage der gewonnenen Erkenntnisse zuständig ist.
Netzwerkleistung und SD-WAN
Da Einzelhandelsumgebungen zunehmend auf cloudbasierte Analysen und POS-Integrationen angewiesen sind, muss das zugrunde liegende Wide Area Network (WAN) robust und widerstandsfähig sein. Die Implementierung einer Software-Defined WAN (SD-WAN)-Architektur stellt sicher, dass kritische Analysedaten und Authentifizierungsverkehr gegenüber dem allgemeinen Gast-Internetzugang priorisiert werden. Für einen tieferen Einblick in die Netzwerkarchitektur lesen Sie The Core SD WAN Benefits for Modern Businesses .
Schlüsselbegriffe & Definitionen
Passive Probe Detection
The ability of a WiFi access point to detect devices that are searching for networks, even if those devices do not connect to the guest WiFi.
Essential for accurate footfall measurement, as it captures the 60-70% of visitors who do not actively authenticate to the network.
MAC Address Randomisation
A privacy feature in modern mobile OSs that generates a temporary hardware address when probing for networks, preventing persistent tracking of unauthenticated devices.
Forces IT teams to rely on sophisticated statistical normalisation and authenticated session data to maintain accurate cohort and repeat visit metrics.
Captive Portal
A web page that users are required to view and interact with before being granted access to a public WiFi network.
The primary data capture mechanism for marketing teams, transitioning anonymous devices into identified customer profiles.
Zone-Level Dwell Time
The measurement of how long a detected device remains within a specific, defined physical area of a venue (e.g., the checkout queue or a specific department).
Requires precise AP placement and RSSI calibration, but provides the most actionable data for store operations and merchandising teams.
Cohort Analysis
A method of grouping visitors based on the date of their first visit and tracking their subsequent return rates over 7, 30, and 90-day intervals.
Provides a network-derived measure of customer loyalty and retention without requiring a dedicated mobile application or loyalty card.
Engagement Rate
The percentage of total detected devices (footfall) that successfully authenticate and connect to the guest WiFi network.
A critical metric for evaluating the effectiveness and user experience of the captive portal.
RSSI (Received Signal Strength Indicator)
A measurement of the power present in a received radio signal.
Used by analytics platforms to estimate the distance of a device from an access point and determine which physical zone the device is located in.
OpenRoaming
A standard that allows users to seamlessly and securely connect to participating guest WiFi networks using a persistent identity profile.
Reduces authentication friction, significantly increasing the engagement rate and providing highly accurate, persistent user data.
Fallstudien
A 50,000 sq ft big-box retailer is deploying a new WiFi network and wants to measure dwell time specifically in their high-margin electronics department versus their low-margin homewares department. How should the IT team approach the deployment?
The IT team must abandon a pure coverage-based design. Instead of placing APs centrally for maximum range, they should deploy directional antennas or lower-power APs specifically targeted at the electronics and homewares zones to create distinct RF boundaries. They must configure the WiFi analytics platform to define these areas as separate tracking zones. Once deployed, they should conduct a physical walk-through with a test device to calibrate the Received Signal Strength Indicator (RSSI) thresholds that define when a device transitions from one zone to another.
A stadium operations director notes that while their total detected footfall is 40,000 per match, their captive portal engagement rate is only 8%. How can the IT and marketing teams collaborate to improve this metric?
The low engagement rate suggests friction in the authentication process or a lack of perceived value. The IT team should review the captive portal architecture to ensure it supports seamless authentication methods, such as social login or profile-based authentication (e.g., OpenRoaming). Simultaneously, the marketing team should update the portal design to clearly communicate the value exchange—for example, offering in-seat ordering or exclusive replays in exchange for authentication. Furthermore, the IT team should ensure the captive portal loads rapidly, even under high concurrent user load.
Szenarioanalyse
Q1. Your marketing director complains that the 'Repeat Visitor' metric on the dashboard dropped suddenly last month, despite store sales remaining stable. What is the most likely technical cause?
💡 Hinweis:Consider recent changes to mobile operating systems and how devices probe for networks.
Empfohlenen Ansatz anzeigen
The most likely cause is an OS update that increased the prevalence or aggression of MAC address randomisation. If the analytics platform relies heavily on passive probe data without robust statistical normalisation, randomised MACs will appear as 'New Visitors' rather than 'Returning Visitors'. The IT team should verify the platform's normalisation algorithms and work to increase the captive portal engagement rate to capture more authenticated, persistent sessions.
Q2. A retail chain wants to measure the conversion rate of their window displays. They place an AP right at the entrance. The data shows high footfall but an average dwell time of only 45 seconds. How should operations interpret this?
💡 Hinweis:Differentiate between venue-level dwell time and zone-level dwell time.
Empfohlenen Ansatz anzeigen
This indicates a high 'bounce rate'. Customers are entering the detection zone (the entrance) but not proceeding further into the store. The window display is successfully generating initial interest (footfall), but the immediate in-store experience is failing to convert that interest into a 'browse' state. Operations should evaluate the store layout immediately inside the entrance to remove friction or improve merchandising.
Q3. You are designing the network for a new flagship store. Marketing requires precise dwell time data for five specific departments. How does this requirement change your hardware deployment strategy compared to a standard office deployment?
💡 Hinweis:Think about the difference between designing for coverage versus designing for location accuracy.
Empfohlenen Ansatz anzeigen
A standard office deployment focuses on providing adequate signal coverage with the minimum number of APs. To provide precise zone-level analytics, the deployment must focus on location accuracy. This requires a higher density of APs to create overlapping detection zones, allowing the system to use RSSI triangulation to pinpoint device locations accurately. You may also need to deploy Bluetooth Low Energy (BLE) beacons or dedicated sensors to augment the WiFi data in highly granular zones.
Wichtigste Erkenntnisse
- ✓Focus on the five metrics that matter: Footfall, Dwell Time, Engagement Rate, Repeat Visit Cohorts, and Revenue Correlation.
- ✓Passive probe detection captures 60-70% more footfall data than relying on authenticated connections alone.
- ✓Dwell time is a primary driver of basket size; customers staying over 8 minutes spend 2-3x more.
- ✓Design your AP layout to create distinct RF boundaries for accurate zone-level analytics, not just maximum coverage.
- ✓Mitigate MAC address randomisation by optimising your captive portal to increase the engagement rate and capture authenticated sessions.
- ✓Align IT and marketing on a shared KPI dashboard before deployment to ensure the platform delivers measurable ROI.
