WiFi Analytics Metrics That Actually Matter for Retail
This authoritative reference guide details the five WiFi analytics metrics that directly correlate with retail revenue, dwell time, and customer loyalty. It provides IT managers and venue operations directors with a practical framework for configuring network hardware, mitigating MAC randomisation impacts, and aligning with marketing teams on a unified data dashboard.
🎧 Listen to this Guide
View Transcript

Executive Summary
For IT managers and venue operations directors in retail, hospitality, and large-scale venues, WiFi is no longer just a connectivity utility; it is the primary sensor network for physical spaces. However, the default metrics provided by most network management systems—such as total bandwidth consumed or peak concurrent connections—offer limited business intelligence. To drive measurable ROI, IT and marketing teams must align on metrics that correlate with customer behaviour: footfall, dwell time, engagement rate, repeat visit cohorts, and revenue correlation.
This guide cuts through the vanity metrics to focus on the WiFi analytics Key Performance Indicators (KPIs) that actually matter for retail. It provides a technical framework for configuring access points (APs) to capture accurate zone-level data, mitigating the impact of MAC address randomisation, and integrating WiFi analytics with Point of Sale (POS) and Customer Relationship Management (CRM) systems. By transitioning from basic network monitoring to advanced WiFi Analytics , operations directors can transform their infrastructure into a revenue-generating asset.
Listen to the companion audio briefing for an executive overview of these concepts:
Technical Deep-Dive: The Five Metrics That Matter
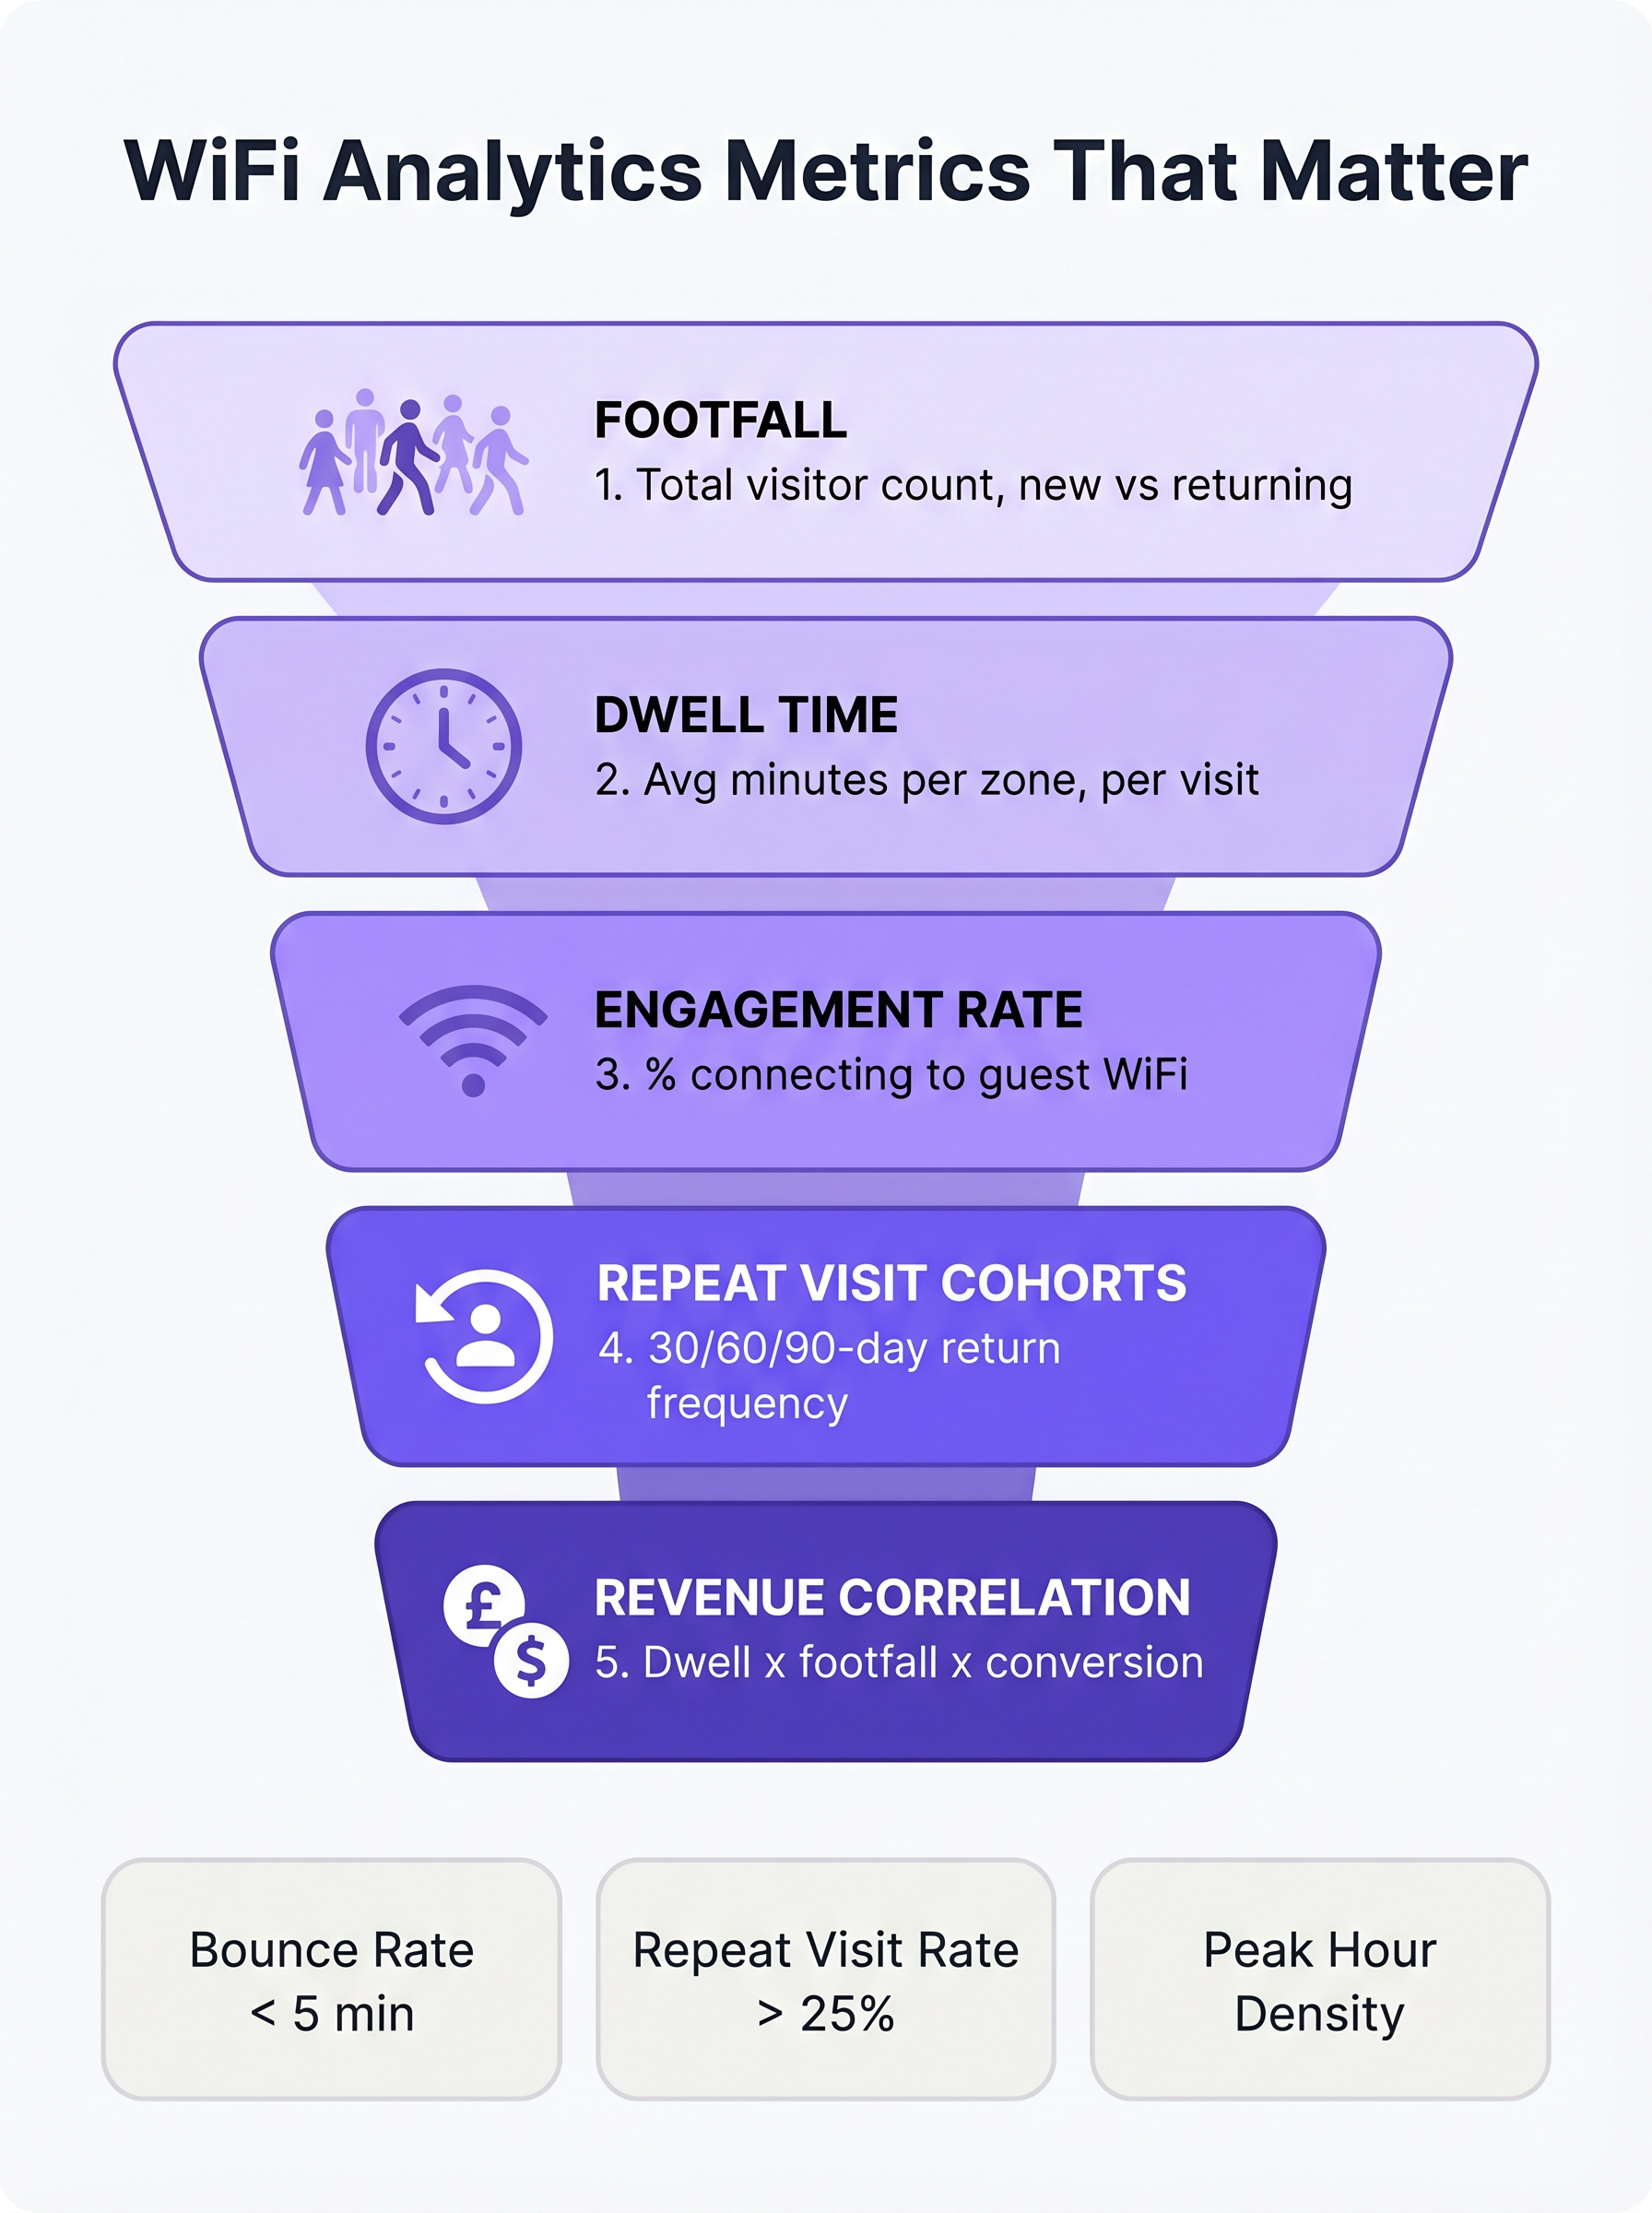
When evaluating a Guest WiFi platform for a retail environment, the focus must shift from network capacity to customer intelligence. The following five metrics form the foundation of a mature retail analytics strategy.
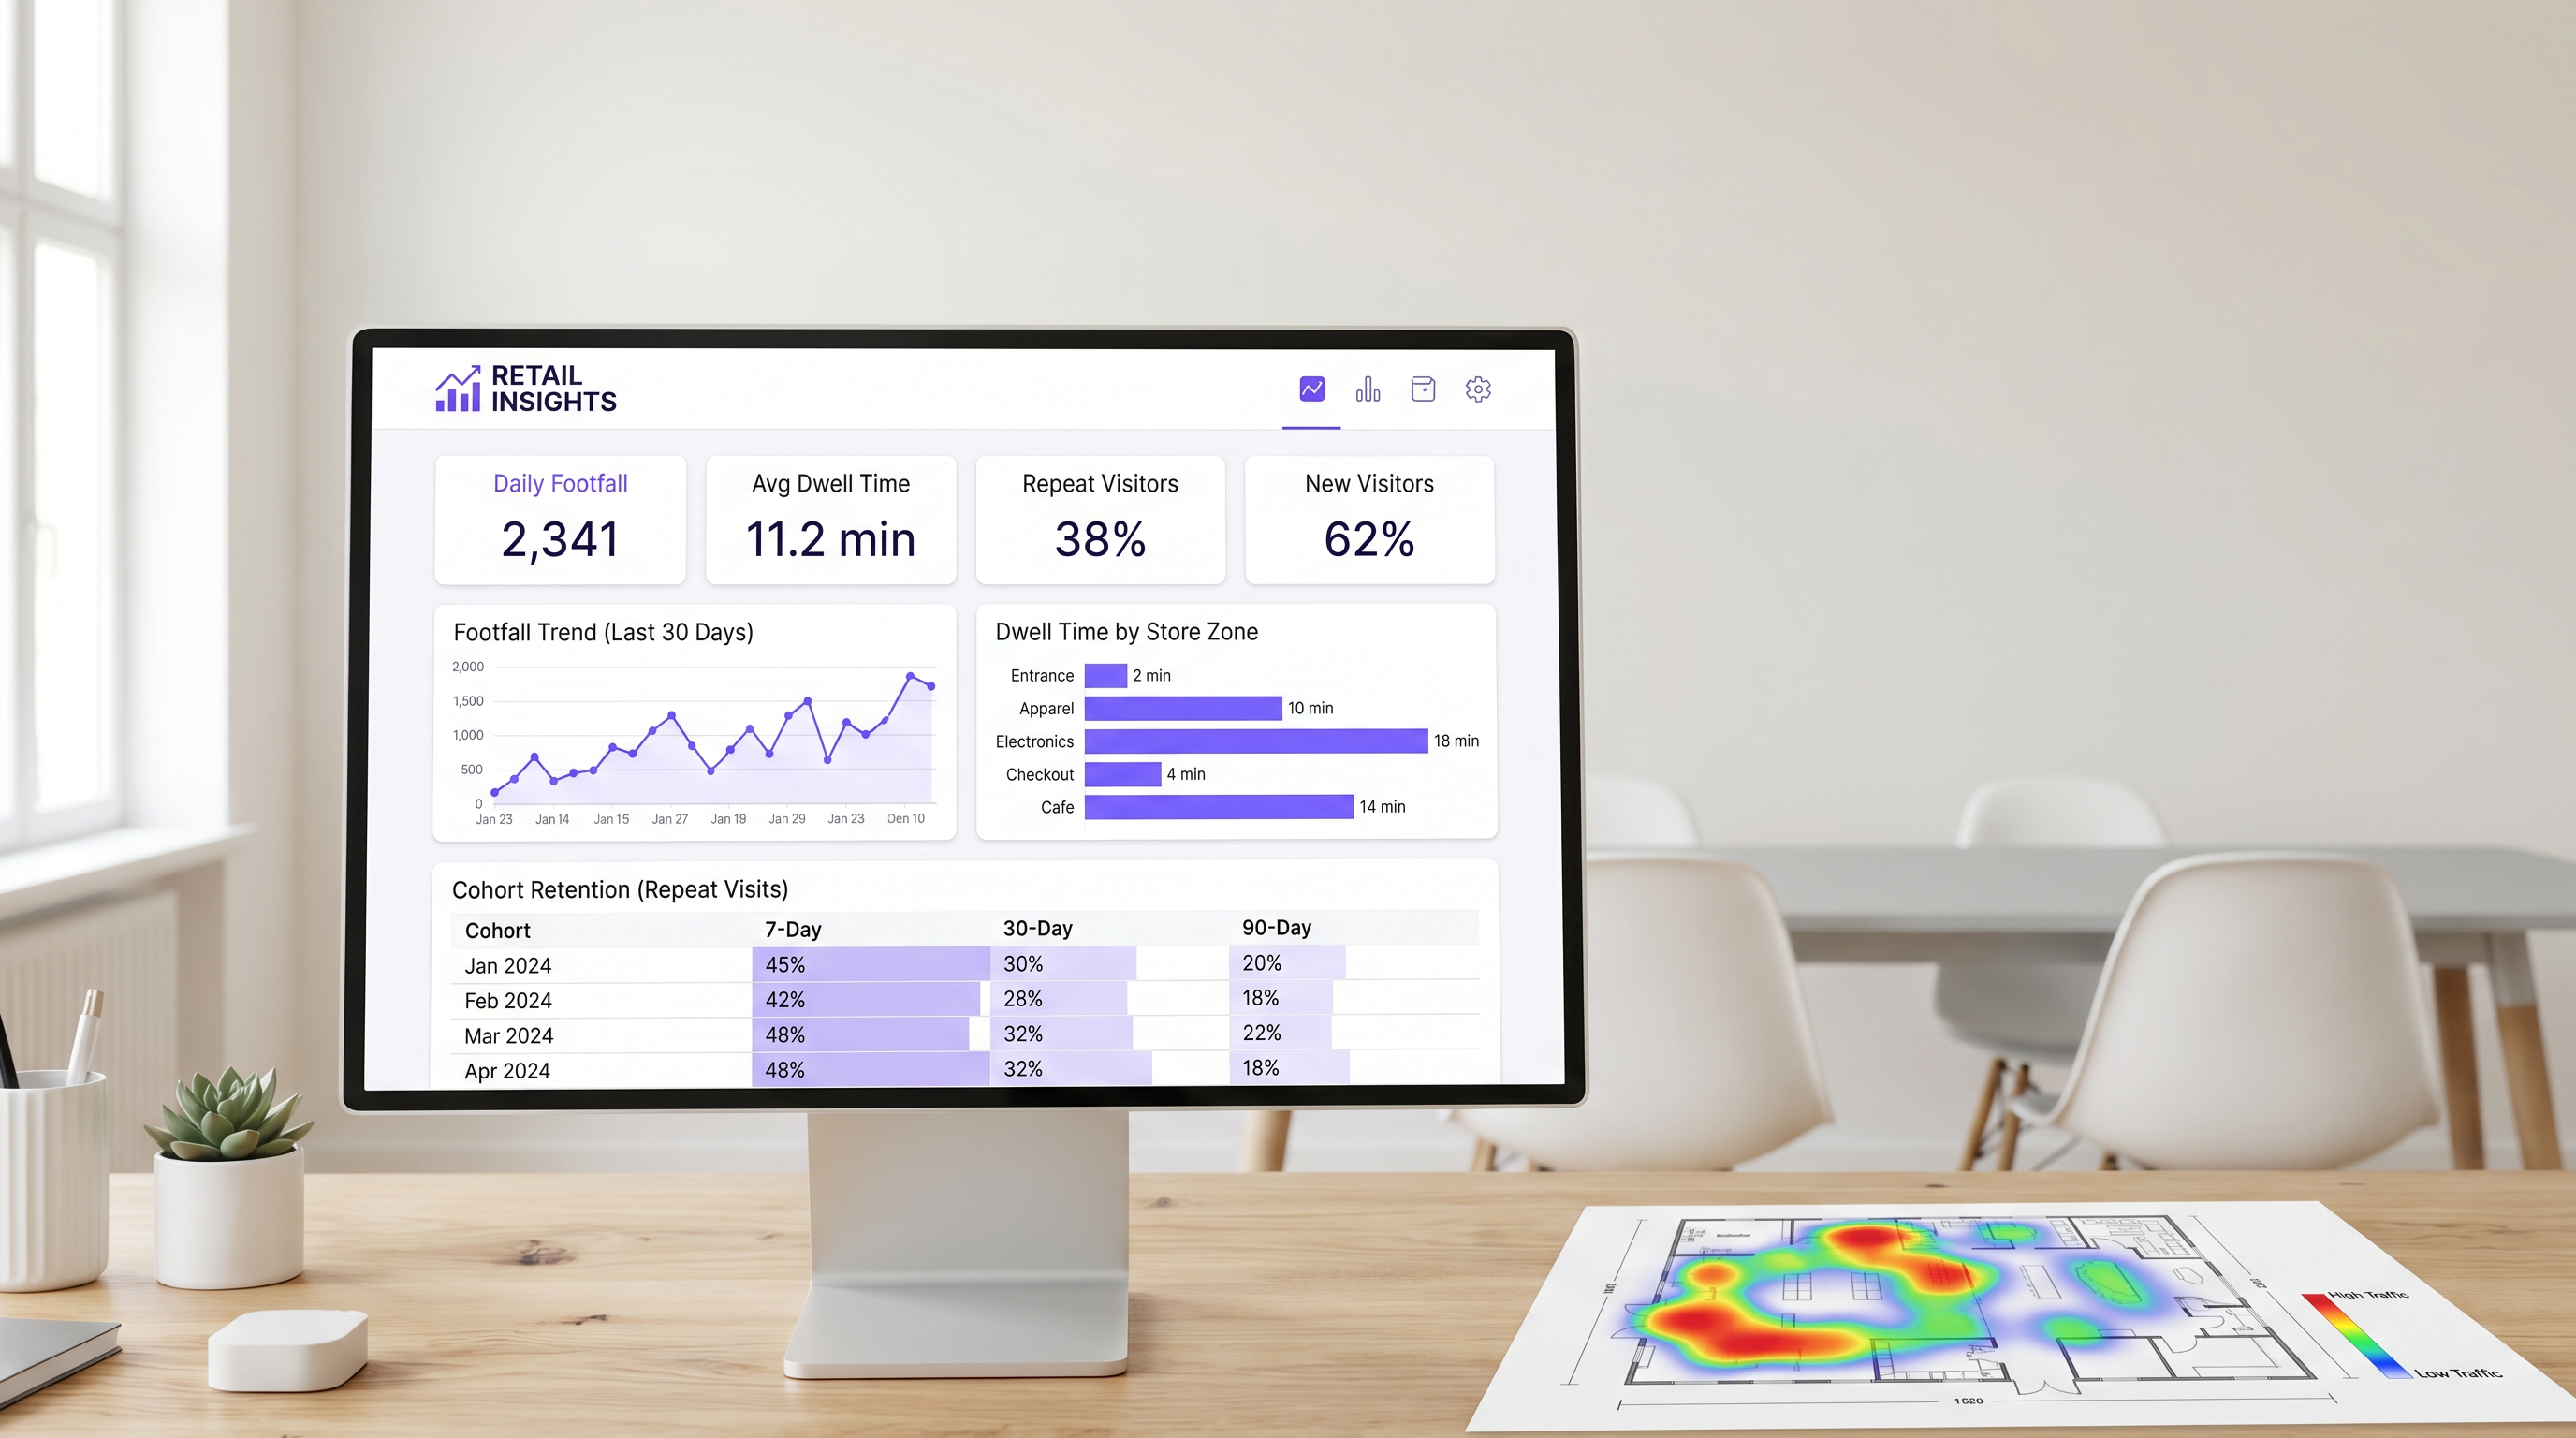
1. Footfall: Beyond Simple Connection Counts
In a WiFi analytics context, footfall is the count of unique devices detected within a venue over a specific time period. Crucially, enterprise platforms utilise passive probe detection to identify devices even if they do not authenticate to the network. This provides a significantly more accurate representation of total venue traffic than relying solely on authenticated sessions.
The most critical sub-metric within footfall is the distinction between new and returning visitors. A high ratio of new visitors indicates effective top-of-funnel marketing or a prime location, whereas a strong returning visitor rate demonstrates customer loyalty and retention.
2. Dwell Time: The Primary Driver of Basket Size
Dwell time measures the duration a device remains within the venue or a specific detection zone. In retail, dwell time is consistently one of the strongest predictors of transaction value.
To effectively measure dwell time, IT teams must configure the network to differentiate between three primary visitor states:
- Bounce (Under 5 minutes): The visitor entered the venue but did not engage.
- Browse (5-15 minutes): The visitor is actively exploring the retail environment.
- Engaged (Over 15 minutes): The visitor is highly engaged, though excessive dwell times in specific zones (e.g., the checkout area) may indicate operational friction.
Zone-level dwell time is particularly valuable. By strategically deploying APs and Sensors across distinct areas (e.g., entrance, apparel, electronics, checkout), operations directors can pinpoint exactly where customers spend their time.
3. Engagement Rate: The Data Capture Funnel
Engagement rate is the percentage of detected devices that successfully authenticate to the guest network via the captive portal. This metric represents the transition from anonymous device tracking to identified customer profiling.
A frictionless authentication flow—utilising social login, email capture, or seamless identity providers like OpenRoaming—is essential for maximising engagement. In retail environments, a well-optimised captive portal should achieve an engagement rate of 25% to 40%. Venues with longer natural dwell times, such as Hospitality or Transport hubs, typically see even higher conversion rates.
4. Repeat Visit Cohorts: Measuring True Loyalty
Cohort analysis groups visitors based on the time period of their first visit (e.g., January 2025) and tracks their return frequency over subsequent intervals (typically 7, 30, and 90 days). This provides a robust measure of customer retention derived entirely from network data, without requiring a separate loyalty application.
For convenience Retail , a healthy 7-day return rate is typically between 30% and 45%. For general merchandise, this figure is closer to 15% to 25%. If 90-day retention falls below 10%, the venue faces a systemic loyalty challenge.
5. Revenue Correlation: Bridging IT and Marketing
The ultimate goal of WiFi analytics is to correlate network data with financial performance. By integrating the WiFi platform with POS systems via standard APIs, operations teams can map footfall and dwell time against conversion rates and average transaction values.
When footfall increases but revenue remains flat, the issue lies in conversion. When dwell time drops, revenue typically follows within weeks. This composite metric serves as a leading indicator for store performance, allowing proactive operational adjustments.
Implementation Guide: Architecture and Deployment
Deploying a WiFi analytics solution requires a fundamental shift in network design philosophy. IT teams must design for data capture, not just coverage.
Access Point Placement for Zone Detection
Standard coverage-based network design often places APs in central locations to maximise signal propagation. However, to accurately measure zone-level dwell time, APs must be positioned to create distinct detection boundaries. This frequently necessitates a higher density of APs, particularly in large-format retail environments.
Before installation, network architects should overlay the proposed AP locations onto the store's merchandising plan. This ensures that the resulting data aligns with the business's operational zones.
Mitigating MAC Address Randomisation
Modern mobile operating systems (iOS 14+ and Android 10+) implement MAC address randomisation to protect user privacy. When a device probes for networks, it uses a temporary, randomised MAC address rather than its true hardware address.
To maintain accurate footfall and cohort data, enterprise WiFi platforms must employ sophisticated statistical normalisation techniques and rely heavily on authenticated session data. When a user authenticates via the captive portal, the platform can link the randomised MAC address to a persistent user profile, ensuring continuity across visits. For more information on privacy frameworks, see our guide on CCPA vs GDPR: Global Privacy Compliance for Guest WiFi Data .
Best Practices and Troubleshooting
Aligning IT and Marketing
The most common failure mode for WiFi analytics deployments is a lack of alignment between IT and marketing. To ensure the platform delivers measurable ROI (see Measuring ROI on Guest WiFi: A Framework for CMOs ), both teams must agree on a unified KPI dashboard before deployment. IT is responsible for the accuracy of the data capture, while marketing is responsible for executing campaigns based on the insights.
Network Performance and SD-WAN
As retail environments become increasingly reliant on cloud-based analytics and POS integrations, the underlying Wide Area Network (WAN) must be robust and resilient. Implementing a Software-Defined WAN (SD-WAN) architecture ensures that critical analytics data and authentication traffic are prioritised over general guest internet access. For a deeper dive into network architecture, review The Core SD WAN Benefits for Modern Businesses .
Key Terms & Definitions
Passive Probe Detection
The ability of a WiFi access point to detect devices that are searching for networks, even if those devices do not connect to the guest WiFi.
Essential for accurate footfall measurement, as it captures the 60-70% of visitors who do not actively authenticate to the network.
MAC Address Randomisation
A privacy feature in modern mobile OSs that generates a temporary hardware address when probing for networks, preventing persistent tracking of unauthenticated devices.
Forces IT teams to rely on sophisticated statistical normalisation and authenticated session data to maintain accurate cohort and repeat visit metrics.
Captive Portal
A web page that users are required to view and interact with before being granted access to a public WiFi network.
The primary data capture mechanism for marketing teams, transitioning anonymous devices into identified customer profiles.
Zone-Level Dwell Time
The measurement of how long a detected device remains within a specific, defined physical area of a venue (e.g., the checkout queue or a specific department).
Requires precise AP placement and RSSI calibration, but provides the most actionable data for store operations and merchandising teams.
Cohort Analysis
A method of grouping visitors based on the date of their first visit and tracking their subsequent return rates over 7, 30, and 90-day intervals.
Provides a network-derived measure of customer loyalty and retention without requiring a dedicated mobile application or loyalty card.
Engagement Rate
The percentage of total detected devices (footfall) that successfully authenticate and connect to the guest WiFi network.
A critical metric for evaluating the effectiveness and user experience of the captive portal.
RSSI (Received Signal Strength Indicator)
A measurement of the power present in a received radio signal.
Used by analytics platforms to estimate the distance of a device from an access point and determine which physical zone the device is located in.
OpenRoaming
A standard that allows users to seamlessly and securely connect to participating guest WiFi networks using a persistent identity profile.
Reduces authentication friction, significantly increasing the engagement rate and providing highly accurate, persistent user data.
Case Studies
A 50,000 sq ft big-box retailer is deploying a new WiFi network and wants to measure dwell time specifically in their high-margin electronics department versus their low-margin homewares department. How should the IT team approach the deployment?
The IT team must abandon a pure coverage-based design. Instead of placing APs centrally for maximum range, they should deploy directional antennas or lower-power APs specifically targeted at the electronics and homewares zones to create distinct RF boundaries. They must configure the WiFi analytics platform to define these areas as separate tracking zones. Once deployed, they should conduct a physical walk-through with a test device to calibrate the Received Signal Strength Indicator (RSSI) thresholds that define when a device transitions from one zone to another.
A stadium operations director notes that while their total detected footfall is 40,000 per match, their captive portal engagement rate is only 8%. How can the IT and marketing teams collaborate to improve this metric?
The low engagement rate suggests friction in the authentication process or a lack of perceived value. The IT team should review the captive portal architecture to ensure it supports seamless authentication methods, such as social login or profile-based authentication (e.g., OpenRoaming). Simultaneously, the marketing team should update the portal design to clearly communicate the value exchange—for example, offering in-seat ordering or exclusive replays in exchange for authentication. Furthermore, the IT team should ensure the captive portal loads rapidly, even under high concurrent user load.
Scenario Analysis
Q1. Your marketing director complains that the 'Repeat Visitor' metric on the dashboard dropped suddenly last month, despite store sales remaining stable. What is the most likely technical cause?
💡 Hint:Consider recent changes to mobile operating systems and how devices probe for networks.
Show Recommended Approach
The most likely cause is an OS update that increased the prevalence or aggression of MAC address randomisation. If the analytics platform relies heavily on passive probe data without robust statistical normalisation, randomised MACs will appear as 'New Visitors' rather than 'Returning Visitors'. The IT team should verify the platform's normalisation algorithms and work to increase the captive portal engagement rate to capture more authenticated, persistent sessions.
Q2. A retail chain wants to measure the conversion rate of their window displays. They place an AP right at the entrance. The data shows high footfall but an average dwell time of only 45 seconds. How should operations interpret this?
💡 Hint:Differentiate between venue-level dwell time and zone-level dwell time.
Show Recommended Approach
This indicates a high 'bounce rate'. Customers are entering the detection zone (the entrance) but not proceeding further into the store. The window display is successfully generating initial interest (footfall), but the immediate in-store experience is failing to convert that interest into a 'browse' state. Operations should evaluate the store layout immediately inside the entrance to remove friction or improve merchandising.
Q3. You are designing the network for a new flagship store. Marketing requires precise dwell time data for five specific departments. How does this requirement change your hardware deployment strategy compared to a standard office deployment?
💡 Hint:Think about the difference between designing for coverage versus designing for location accuracy.
Show Recommended Approach
A standard office deployment focuses on providing adequate signal coverage with the minimum number of APs. To provide precise zone-level analytics, the deployment must focus on location accuracy. This requires a higher density of APs to create overlapping detection zones, allowing the system to use RSSI triangulation to pinpoint device locations accurately. You may also need to deploy Bluetooth Low Energy (BLE) beacons or dedicated sensors to augment the WiFi data in highly granular zones.
Key Takeaways
- ✓Focus on the five metrics that matter: Footfall, Dwell Time, Engagement Rate, Repeat Visit Cohorts, and Revenue Correlation.
- ✓Passive probe detection captures 60-70% more footfall data than relying on authenticated connections alone.
- ✓Dwell time is a primary driver of basket size; customers staying over 8 minutes spend 2-3x more.
- ✓Design your AP layout to create distinct RF boundaries for accurate zone-level analytics, not just maximum coverage.
- ✓Mitigate MAC address randomisation by optimising your captive portal to increase the engagement rate and capture authenticated sessions.
- ✓Align IT and marketing on a shared KPI dashboard before deployment to ensure the platform delivers measurable ROI.
