Venue footfall tracking and sizing advisor
Model footfall sensing architecture, calibrate sensor density for WiFi and optical counters, resolve MAC randomization noise, and estimate venue operational conversion lift.
High-traffic retail destination requiring zone-level dwell time, storefront conversion attribution, and seamless GDPR compliance with salted hashing.
Raw uncalibrated probe detections: 15,300 pings. Deduplicated true visitors: 15,000 verified patrons.
The post-lunch floor looks empty. A manager checks the tills, sees steady receipts, and still can't explain why the shop feels quieter than the numbers suggest. Meanwhile, a gym operator may know total memberships and daily sales, but not whether the lunchtime rush needs another coach, a second reception worker, or a different class timetable. This gap between what people do and how many people were present is where footfall tracking earns its place.
Footfall tracking isn't just a sensor installed above a door. It's a data-pipeline decision. You need to define the visitor, filter repeated signals, protect privacy, calibrate the result against reality, and choose KPIs that someone can act on. The WiFi network may already provide useful telemetry, but existing infrastructure doesn't automatically produce trustworthy insight.
Why Counting People Matters More Than Counting Sales
Sales data starts at the end of the customer journey. It tells you what was purchased, when the transaction happened, and sometimes which channel or staff member handled it. It doesn't tell you how many people entered without buying, whether a promotion created genuine visits, or whether a queue turned away potential customers.
That makes footfall the upstream signal. If 120 people visit and 12 transactions occur, the resulting conversion rate only means something if both figures use compatible definitions and time windows. A till report alone can't tell you whether ten transactions came from a quiet stream of high-intent visitors or a crowded period where many left without engaging.
A venue manager should ask three questions before buying equipment:
- Did the campaign bring people through the door? Compare visitor flow during the campaign with an appropriate baseline, then separate increased traffic from increased purchasing.
- Did staffing match demand? Align reception, sales, cleaning, security, or coaching cover with arrival patterns rather than relying on a general impression of busy and quiet periods.
- Is there a choke point? Identify whether visitors stop at the entrance, queue, reception desk, lift lobby, checkout, or another zone before moving on.
Practical rule: Sales tells you what converted. Footfall tells you how much opportunity existed before conversion.
This distinction matters in places where demand arrives in waves. Operators responsible for managing peak hours in gyms can use the same logic to compare attendance patterns with class capacity, reception cover, and equipment pressure. The measure isn't valuable because it produces a large dashboard. It's valuable because it replaces a guess with a decision.
Start by defining the decision. If the question is staffing, you may need entries by fifteen-minute interval. If it's layout performance, you'll need zone movement and dwell time. If it's marketing, you'll need a consistent visit definition that can be compared with campaign dates. Only then should you choose a sensor.
What Footfall Tracking Actually Means
Footfall tracking measures people entering, moving through, and leaving a physical space over time. Simple people counting is closer to a toll system. It records vehicles passing one point. Tracking resembles a traffic study, which examines direction, flow, pauses, routes, and recurring movement.
The distinction is operational:
- Entries are detected arrivals through a defined boundary, such as a shop door or building entrance.
- Unique visits are distinct visit records after the system applies identity rules and removes repeated observations from the same device or person.
- Dwell time is the period a visit remains active, either in the whole venue or within a defined zone.
A basic counter can support a daily staffing decision. A tracking system can support more specific questions, such as whether the north entrance produces a different conversion rate from the main entrance, whether visitors linger near a display, or whether people return after an event. Those outputs are only useful when the venue defines what counts as a visit.
Consider a shopping centre with several doors. A person enters through one door, passes a WiFi access point, walks through a food court, and exits through another door. A raw sensor stream may produce several observations. A well-designed pipeline treats them as one visit where the rules support that conclusion. A poorly designed pipeline counts movement between access points as fresh arrivals.
The KPI follows the definition
If your KPI is total entries, a door counter may be enough. If it's conversion by entrance, you need reliable entrance attribution and a matching transaction window. If it's zone dwell, you need sensors that can see movement beyond the threshold. If it's repeat visits, you need a privacy-compliant method for distinguishing visit patterns without retaining unnecessary raw identifiers.
That's why the hard work starts before installation. The pipeline needs an agreed boundary, identity rule, time window, zone map, retention policy, and reporting owner. A sensor only produces events. Your operating model decides whether those events become evidence.
Sensing Technologies Compared
No sensing method sees the venue in exactly the same way. The right choice depends on whether the space has narrow entrances, open circulation, darkness, strong privacy constraints, an existing WiFi estate, or a requirement for zone-level movement.
The table below compares the main options without treating vendor accuracy claims as interchangeable.
Footfall sensing technologies at a glance
| Technology | What it detects | Typical accuracy | Privacy posture | Install complexity | Relative cost |
|---|---|---|---|---|---|
| WiFi probe | Nearby device signals and movement between access-point coverage areas | Opportunistic, affected by device settings and roaming | Requires careful treatment of device identifiers and clear notice | Low where suitable WiFi already exists, higher for tuning | Low to moderate |
| Bluetooth Low Energy beacons and receivers | Cooperative device or app interactions, often within defined zones | Strong for participating devices and zone dwell, incomplete for non-participants | More controlled when app-based, still requires transparent data practices | Moderate, with beacon placement and app or receiver configuration | Low to moderate |
| Camera-based people counting with computer vision | Person movement, direction, groups, and zone occupancy | High in suitable lighting and controlled views, weaker with obstruction or poor light | Raises image-processing and surveillance questions | Moderate to high, including positioning and privacy review | Moderate to high |
| Thermal or 3D depth sensors | Heat signatures, body shapes, or depth movement without conventional images | Consistent in darkness, affected by placement and crowding | Can reduce image-capture concerns, but still needs governance | Moderate | Moderate |
| Physical turnstiles or door counters | Passage through a narrow physical boundary | Definitive at the monitored chokepoint, not representative of open-plan flow | Usually limited personal data collection | Low to moderate, depending on building works | Low to moderate |
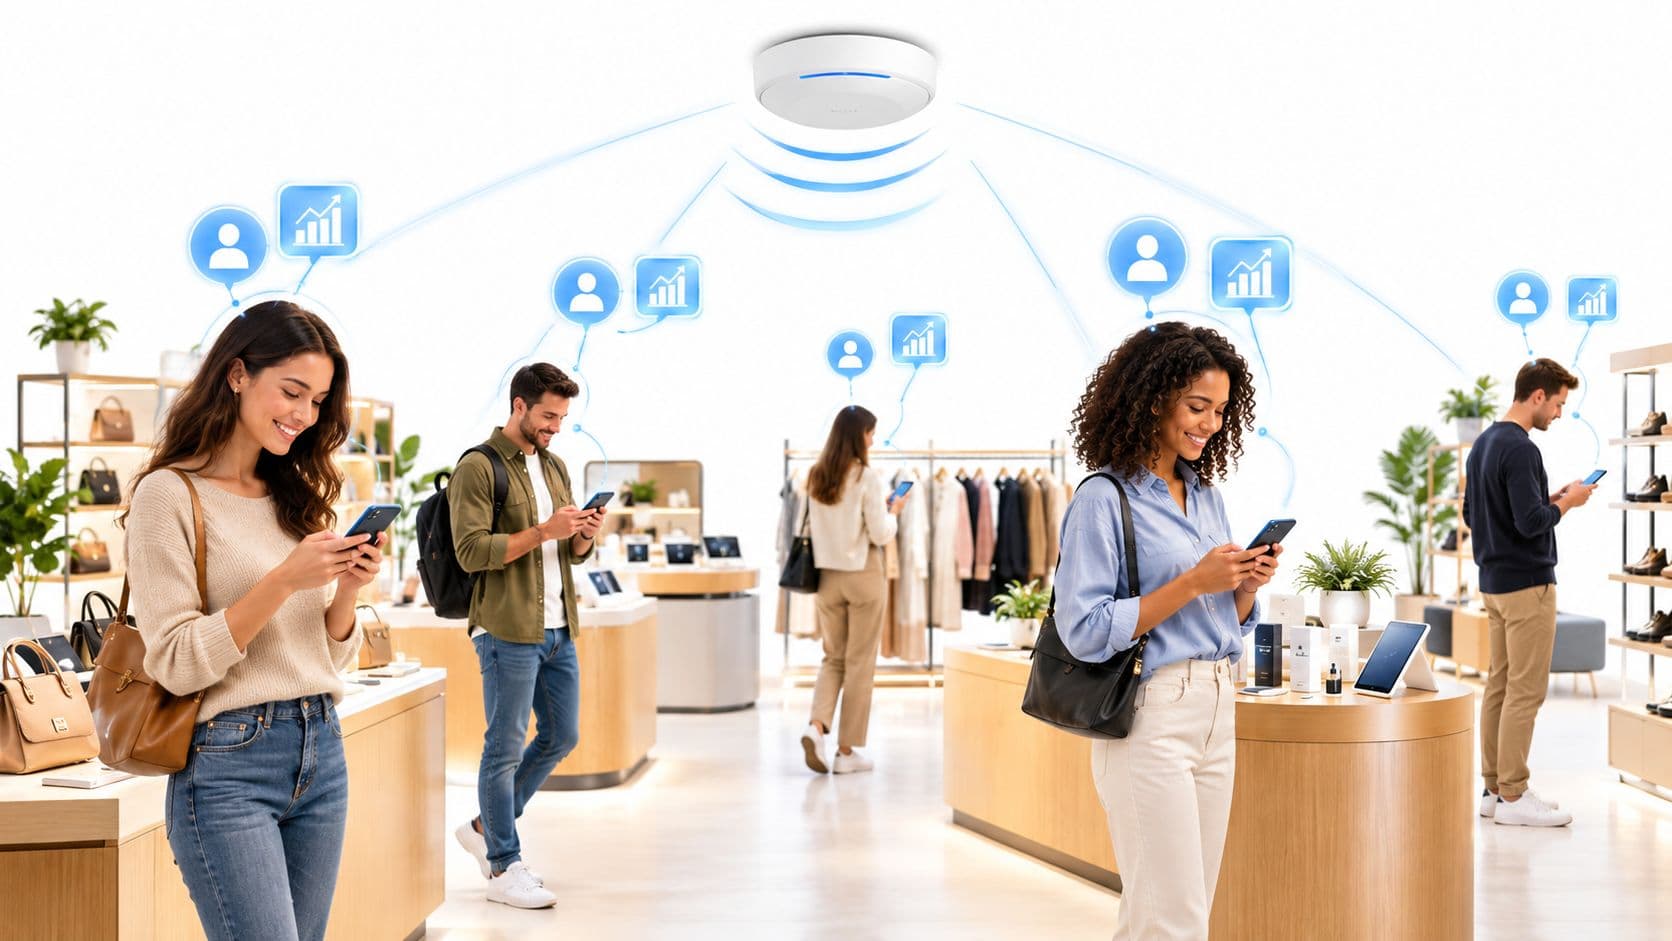
WiFi probes are attractive because the venue may already have access points, controller telemetry, and a network team. They're also opportunistic. A phone may not expose a usable signal, and one device doesn't always equal one person. The WiFi analytics guide is useful background when assessing what existing wireless infrastructure can and can't support.
Bluetooth Low Energy is more deliberate. Beacons can define zones and receivers can detect participating devices, but coverage depends on device cooperation, an app, or a compatible receiver strategy. That makes it useful for controlled environments, less suitable as a complete count of every anonymous passer-by.
Cameras offer richer spatial information, including direction and movement across a mapped area. They also create a heavier privacy and governance burden, particularly where visitors may reasonably expect not to be identified or observed beyond necessary safety functions.
Thermal and depth sensors can suit entrances or dark spaces where ordinary cameras struggle. Physical counters remain the simplest answer for a single narrow door. They become misleading in open-plan venues, where visitors can enter from several directions or move between connected areas.
Mature deployments often combine methods. Use a physical or overhead counter for the entry ground truth, WiFi for broader flow, and zone-capable sensing where dwell or congestion matters.
Accuracy, Deduplication and Calibration
Accuracy isn't a single number attached to a device. In practice, it means the processed count matches an agreed view of reality under defined conditions, such as a particular entrance, time period, crowd profile, and counting boundary.
The pipeline usually has four stages. Raw events arrive first. Filtering removes weak or irrelevant observations. Deduplication decides whether repeated signals represent one visit or several. Calibration then compares the processed output with a trusted reference and adjusts the operating rules.

Why repeated signals change the answer
Suppose the same device generates observations at 09:01 and 09:04. Your deduplication rule decides whether that is one person continuing a visit or two separate arrivals. A dwell window controls how long the system keeps that visit active. A shorter window may split one visit into several records. A longer window may merge separate visits into one.
Commonly tested windows include five, ten, or twenty minutes, but there isn't a universal correct choice. The appropriate setting depends on the venue, the question being answered, and how quickly visitors can leave and return. Changing the window changes unique visits, repeat-visit signals, and any conversion calculation built on them.
Entry counting and zone counting are different problems. A sensor over a door can establish movement across that boundary. It can't tell you whether someone stopped beside a display or walked directly to the exit. A camera-based zone map, depth sensor, or suitably placed receiver network can provide that detail, subject to its own limitations.
A calibration routine operators can repeat
Begin with manual counts during both busy and quiet periods. Compare those observations with the system output, then investigate the cause of any difference instead of applying an unexplained correction. POS transactions can provide a useful cross-check, while scheduled staff presence can expose obvious errors, such as the system reporting visitors after the venue has closed.
Seasonal adjustment factors should be documented rather than hidden. A festival, school holiday, weather event, or temporary closure can change the relationship between signals and people. Keep a record of sensor moves, access-point changes, controller updates, and layout alterations because each can invalidate an earlier calibration.
Trust improves when the team can explain how a raw event became a reported visit.
Implementing Footfall Tracking Step by Step
An IT lead or operations manager can treat deployment as a controlled service launch rather than a hardware purchase. The checklist below keeps technical, legal, and operational decisions in the same conversation.
Start with the decision
Write down the first operational question. It might be staffing at reception, conversion by entrance, occupancy by zone, or visitor flow through a property. Select a small set of KPIs and define the time period, boundary, and audience for each one.
Select the sensing method
Match the sensor to the physical constraint. A narrow doorway may suit a counter. An open retail floor may need zone visibility. An existing WiFi estate may provide a low-friction starting point, but only after the team confirms what telemetry the controller exposes and whether it can be processed without creating an avoidable privacy risk.
Plan the network path
Document which VLAN carries analytics traffic, how devices are monitored, and whether raw probe data remains on premises or leaves for a vendor cloud. Confirm how the WiFi controller exposes telemetry, which firewall and egress controls apply, and who owns troubleshooting when the analytics feed stops.
Purple's hardware integrations provide one example of how a WiFi analytics platform can connect with existing network hardware. Treat any platform as a component in the wider pipeline, not as a substitute for network design.
Publish the consent and retention model
Your signage and privacy notice should say that the venue uses WiFi analytics or another relevant sensing method, explain the purpose, and identify the available choices where required. Captive portal language must match the actual processing, and the legal team should confirm the approach under GDPR or another applicable regime before MAC-related data is captured.
Retention needs an owner and an automated control. A venue might choose to hash device identifiers within a short period and delete raw signals after a defined period, but the exact policy must reflect the stated purpose, legal advice, and vendor architecture. Don't let a temporary troubleshooting export become a permanent data store.

Test the service before launch
Build dashboards for operations, marketing, and security separately. Operations may need live occupancy and staffing alerts. Marketing may need campaign comparisons. Security may need system health, access control, and retention evidence rather than visitor behaviour.
Run a dry-run with staff acting as test traffic. Walk every entrance, change zones, queue, turn around, leave, and return. Compare expected events with reported visits, then fix boundary and deduplication rules before publishing the first baseline.
Footfall Tracking Across Industries
The same visitor stream can support very different operating decisions. A retail manager wants to connect visits with purchases. A hospital administrator needs to understand congestion without turning sensitive areas into surveillance zones. KPI design must follow the operator's responsibility.
Footfall KPIs by industry
| Industry | Primary KPI | Supporting KPI | Baseline to benchmark |
|---|---|---|---|
| Retail | Visitor-to-transaction conversion | Entries by entrance and dwell near key zones | A normal trading period before a campaign or layout change |
| Hospitality | Lobby dwell before service | Queue length and movement to food and beverage areas | Typical arrival and service pattern by day type |
| Healthcare | Waiting-area density or flow time | Wayfinding bottlenecks and arrivals by department | Normal clinic or appointment flow, using privacy-safe zones |
| Property management | Footfall per square metre | Zone distribution and tenant-area capture | Current visitor flow by property, entrance, and amenity |
Retail
A retailer may see stable sales but different visitor volumes at each entrance. The useful question isn't whether the shop is busy. It's whether one entrance attracts visitors who fail to reach the relevant department, or whether a campaign increased visits without improving transactions. Pair entries with POS data only after confirming that both systems use compatible timestamps and boundaries.
Hospitality
Hotels, bars, restaurants, and event venues often need to understand arrival pressure and service friction. A lobby may receive a surge of visitors, while the restaurant remains underused because signage or wayfinding sends people elsewhere. Lobby dwell and queue time can reveal that operational problem without assuming every visitor intends to buy food or accommodation.
Healthcare
Healthcare requires restraint. Measure flow through public waiting areas, reception, and wayfinding routes where the purpose is clear. Keep sensitive treatment areas out of unnecessary monitoring, restrict access to dashboards, and aggregate results so the operational benefit doesn't create an avoidable record of individual movement.
Property management
Property teams can use footfall per square metre to compare areas with different sizes and layouts. A low-traffic zone may need improved wayfinding, a different amenity, or a leasing strategy that gives visitors a reason to cross the property. A high-traffic corridor may justify closer attention to tenant placement, cleaning, security, and event planning.
The baseline should describe ordinary conditions, not an exceptional launch day. Record the venue state, opening hours, events, closures, and sensor configuration so future comparisons remain meaningful.
Common Pitfalls and How to Avoid Them
Footfall projects usually lose credibility through small design failures rather than dramatic hardware breakdowns. The number on the dashboard looks precise, so operators assume the underlying definition must also be precise. It isn't.

Missing consent
A sign that says “free WiFi” may not explain passive WiFi analytics. Visitors need a clear notice that reflects the actual processing, including the purpose and relevant choices. Corrective action this week is straightforward: ask privacy and network teams to approve one signage template, one privacy-notice paragraph, and one captive portal statement.
Double counting during roaming
A phone can appear to move between access points, creating multiple observations for one visit. Configure roaming hysteresis, which is the rule that prevents a brief change in coverage from creating a new visit, and test dwell thresholds against real movement through the building.
Sensors in the wrong place
A counter near a door may capture people passing rather than entering. A camera can lose visibility when lighting changes or groups overlap. Add an overhead sensor where appropriate, define the counting line on the floor plan, and use manual observation as the ground truth for tuning.
Retention creep
Raw events often survive because nobody owns deletion. The original retention policy gets extended for troubleshooting, reporting, or convenience, then becomes indefinite by accident. Assign an owner, record the retention period, and enforce deletion with automated jobs that produce an audit trail.
Maturity test: Don't add a more sophisticated sensor until the venue can explain its current boundary, consent language, deduplication rule, and calibration record.
A mature programme moves from basic counting to reliable comparison, then to zone insight and integrated decisions. Each step depends on the previous one. More data won't repair an undefined KPI or an untested privacy model.
ROI, KPIs and Your First 30 Days
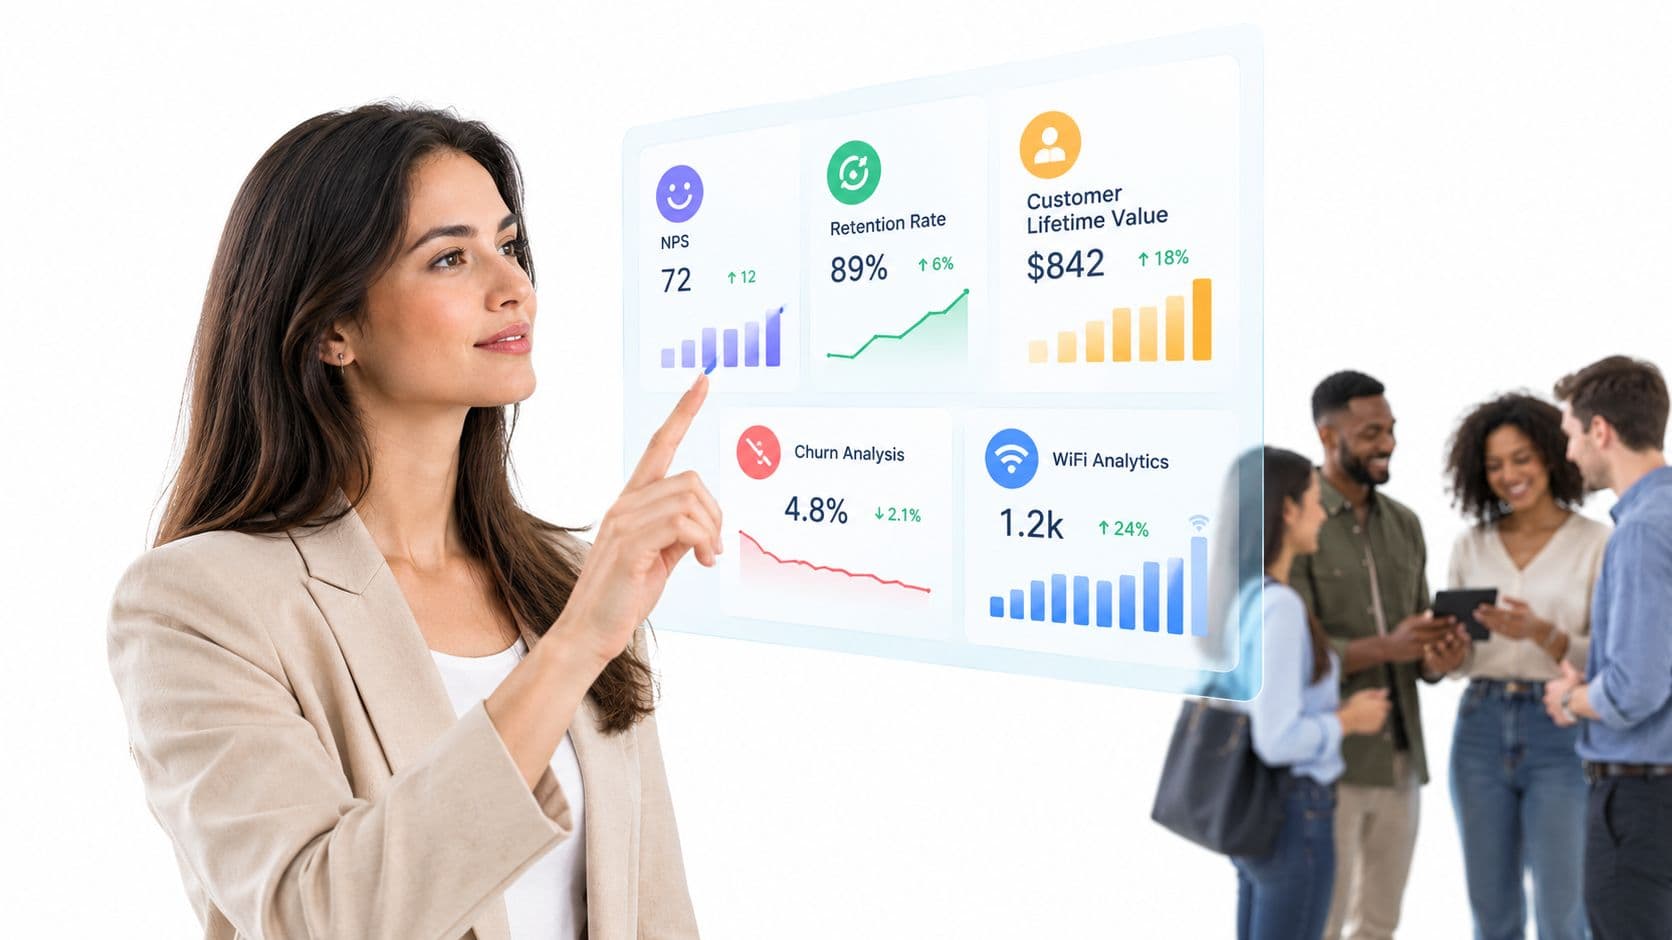
Footfall becomes commercially useful when it connects to a lever someone controls. Useful measures include conversion rate, sales per visitor adjusted for dwell, staff-to-traffic ratios, lease compliance, and queue-time reduction. A high visitor count is only a starting observation, not an ROI result.
Footfall KPIs by venue type
| Venue type | Primary KPI | Secondary KPI | Data source |
|---|---|---|---|
| Retail shop | Visitor-to-transaction conversion | Dwell by department or entrance | Entry sensor, zone sensor, POS |
| Gym or leisure venue | Visits by time period | Class attendance and reception pressure | WiFi or counter data, booking system |
| Hotel or event venue | Arrival and lobby dwell | Queue movement to service areas | Entrance sensors, zone analytics |
| Healthcare site | Waiting-area flow | Density and wayfinding movement | Privacy-safe counters and zone sensors |
| Managed property | Footfall per square metre | Tenant-area and amenity distribution | Entrance, zone, tenant, and property data |
Use the first week to document existing counters, network telemetry, opening hours, and privacy notices. During the second week, agree four KPIs and sketch the dashboard around decisions, not around every field the platform can export.
In the third week, run manual counts at representative busy and quiet periods. Tighten deduplication and roaming rules, then record the reason for each change. In the fourth week, review one decision for each venue type, such as a staffing adjustment, a wayfinding change, a service-point review, or a leasing discussion.
A simple commercial formula keeps the discussion grounded:
ROI = incremental margin from additional converted visitors minus sensor and labour cost.
The formula only works when the team can defend the baseline, conversion definition, calibration method, and cost allocation. If those inputs are unstable, the result is a persuasive-looking estimate rather than a reliable business case.
For teams assessing WiFi-based options, Purple's ROI calculator can help structure the commercial conversation. Purple offers WiFi analytics that use existing wireless access points to measure visitor numbers, dwell times, repeat visits, and occupancy patterns, with the final suitability still depending on network coverage, consent, calibration, and KPI design.
The first decision isn't which sensor to buy. It's which question the venue needs answered, what evidence will count as trustworthy, and how long the system should retain the data required to answer it.
Purple combines WiFi authentication, analytics, occupancy features, integrations, and reporting so venues can turn existing wireless infrastructure into a structured footfall data pipeline. Visit Purple to assess how its platform could support visitor measurement, privacy-aware connectivity, and KPI-led venue operations.