
British venue operators already work with movement data at national scale. The BRC-Sensormatic Footfall Monitor draws on 1.5 million footfall-measurement devices and captures over 40 billion shopper visits annually, showing how normalised continuous location measurement has become in UK retail. WiFi location analytics extends that discipline inside individual venues, turning wireless signals into practical evidence about presence, movement, dwell and repeat behaviour.
The technology isn't a magic replacement for tills, door counters or operational judgement. It works best as a calibrated layer that helps teams understand how people use a space, then connect that insight to staffing, layouts, service quality and infrastructure decisions. The difficult work sits in the details, especially signal accuracy, MAC-address handling, lawful processing and the difference between a persuasive dashboard and a decision-grade measurement system.
Understanding WiFi Location Analytics in UK Venues
WiFi location analytics uses wireless network observations to estimate how devices move through a defined physical environment. Access points and specialist sensors associate signals with zones, producing aggregated measures such as footfall, dwell duration, movement between areas and repeat presence. Visitors do not need an app or dedicated tracking device, although the results still depend on careful interpretation, calibration and data governance.
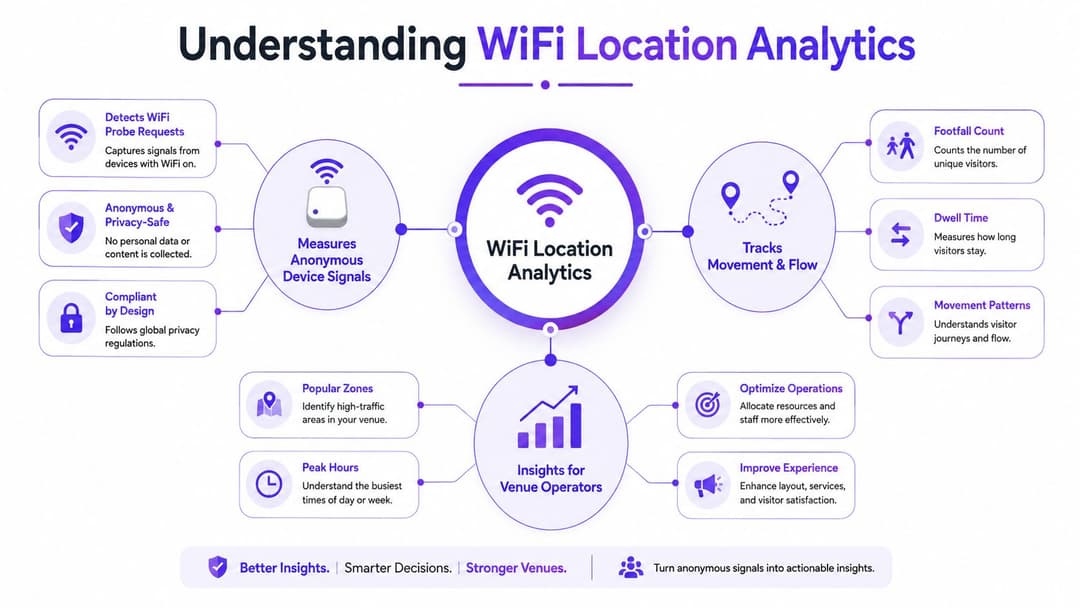
The UK research base is established. University College London demonstrated that WiFi probe-request data could estimate real-time pedestrian footfall on British retail high streets. Cardiff University research also identified WiFi as a technology-based alternative for measuring town-centre footfall alongside mobile-mast data. The UCL research on real-time high-street footfall is useful for practitioners because it sets out the measurement logic: passive wireless observations can reveal patterns associated with a particular place.
From academic method to operating tool
That method now sits within a wider UK movement-data market. The Department for Transport's Footfall Counter dataset uses mobile-network-derived location data to produce unique-visit totals by day and time, repeat-visit frequency and history back to 2019, without requiring on-site hardware. It is not WiFi data, but it shows the level of reporting operators increasingly expect. Location analytics should explain unique visits, timing and repeat behaviour, rather than just count connection events.
Ofcom's Connected Nations reporting includes WiFi coverage datasets at local-authority and postcode level. These sources place WiFi analytics within Britain's wider infrastructure and mobility measurement framework. For venues, that context matters when assessing whether a proposed deployment reflects real coverage conditions or only the capabilities described in a sales demonstration.
What operators can actually learn
Retailers can compare movement near an entrance with visits to a department. Transport operators can examine how passengers distribute themselves across concourses. Hotels, restaurants and event venues can use dwell and zone occupancy to identify pressure points in service delivery. The practical value appears when these observations are compared with transactions, staffing rosters, bookings, queue information or maintenance tickets.
The network still sets a ceiling on measurement quality. For guidance on understanding the networking and coverage decisions that determine whether location analytics will be reliable on your site , review the relevant planning and support considerations. UK operators can also consult this guide to WiFi analytics measurement and engagement when separating presence metrics from consented engagement.
Privacy controls belong in the design from the start. Define the operational decision first, then select a metric whose accuracy, retention and lawful use can be explained to venue staff and visitors.
Practical rule: Treat WiFi analytics as a measurement system, not a people-counting oracle. Define the decision you need to improve before selecting the metric.
How WiFi Location Analytics Captures Movement Data
A reliable deployment separates four layers: the device signal, the network observation, the location calculation and the retained record.
The signal and the observation
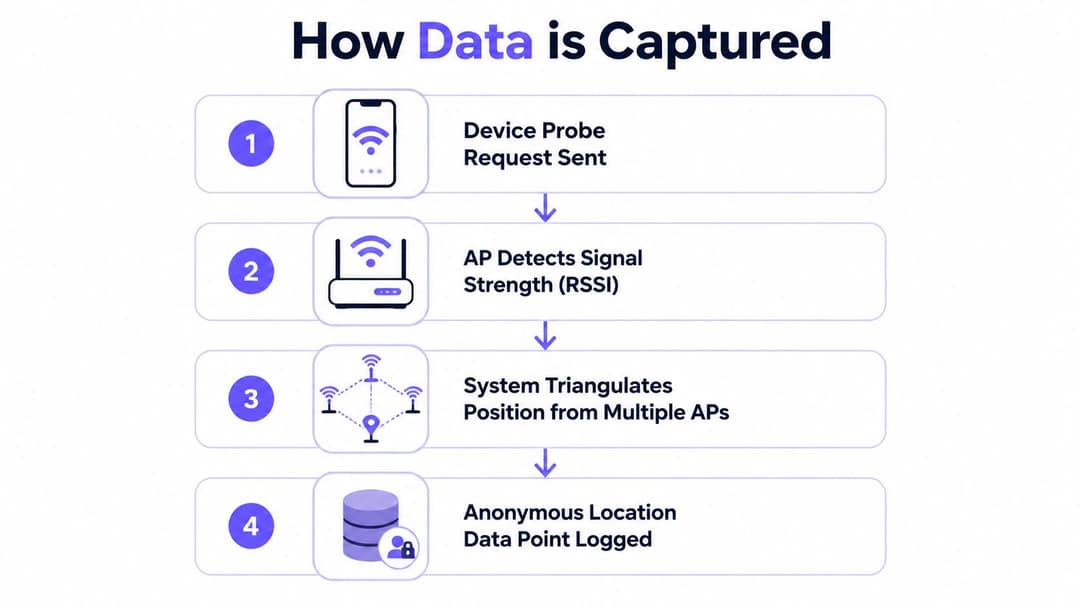
A phone, laptop or other wireless device may send a probe request while searching for available networks. Access points can detect that transmission and record technical characteristics such as signal strength, usually represented as RSSI. A device that joins the network also generates association and session events. Those events can provide a stronger observation than an unauthenticated probe by itself.
The system does not need to read messages or inspect application content. It works from wireless events and network metadata, then applies rules to determine whether an observation falls within a defined area and time window.
MAC addresses need careful handling. A MAC address is a network identifier, but its technical appearance does not place it outside data-protection law. Modern devices can randomise or rotate the address they present. A platform that counts every distinct value may therefore misread returning behaviour and overstate apparent device volume.
From signal strength to a zone
Several access points may observe the same device from different positions. The platform compares signal-strength patterns, known access-point locations and the venue floor plan to estimate the device's likely zone. Operators often call this triangulation, although the calculation may also use fingerprinting, map constraints and statistical smoothing rather than a simple geometric triangle.
WiFi fingerprinting compares nearby networks and signal levels with a previously surveyed map. It works like matching a sound to a known acoustic profile. Careful surveying helps distinguish an entrance from an adjacent corridor, or one department from another, particularly in venues where zones sit close together.
UK academic work indicates that some WiFi fingerprinting and map-assisted positioning systems can achieve under 2 m error, while the wider class of WiFi positioning systems is typically around 1 to 5 m. That range may support room-level or department-level analysis, but it does not guarantee that every point on a live dashboard has the same precision. The University of Essex thesis on WiFi indoor positioning sets out the technical basis behind those findings.
Why calibration decides the result
Walls, shelving, people, lifts and reflective surfaces change radio behaviour. A complex shopping centre can create multipath effects that confuse a model trained in a simpler environment. A UK study of crowd-sourced WiFi source localisation reported 14.15 m mean accuracy at Westfield, UK, with a 4.49 m standard deviation. The Edinburgh research on WiFi source localisation shows why this statistic matters: laboratory performance should be tested against the conditions of the actual venue.
A practical deployment sequence keeps the measurement tied to an operational decision:
- Map the venue: Record access-point positions, floor boundaries, entrances and working zones.
- Survey the RF environment: Identify walls, equipment and congestion that may distort observations.
- Define the question: Decide whether the system needs dependable entrance counts, dwell areas, route transitions or occupancy trends.
- Validate against a comparator: Use an appropriate counter, transaction record or operational observation to check whether the output remains directionally and consistently useful.
Calibration should be repeated when layouts, access-point positions or major sources of interference change. The useful question is whether each KPI has an owner, a decision threshold and a documented response, rather than how many KPIs the platform offers.
Key Metrics and Business Applications Across Sectors
The right metric depends on the decision. Footfall is useful for demand planning, but it won't tell a hospital why patients are waiting or a museum why one gallery is bypassed. Dwell can indicate engagement or congestion, depending on the setting. Zone transitions reveal journeys, while repeat visits help distinguish acquisition from retention.
UK public and commercial datasets are moving towards more operationally useful time granularity. Public examples include retail-store measurements at five-minute intervals, while mobile-network-derived footfall products provide monthly unique-visit counts. These aren't WiFi measures, but they show why venue teams increasingly need timely, comparable movement data rather than a monthly total that arrives after the decision has already been made.
| Sector | Primary Metrics | Business Application |
|---|---|---|
| Retail and shopping centres | Footfall, dwell by zone, route transitions, repeat presence | Compare entrances, assess layouts, support tenant reporting and align staffing with demand |
| Hospitality and events | Dwell, zone occupancy, arrival flow, movement between service areas | Adjust front-of-house cover, identify congestion and improve table, bar or concourse operations |
| Healthcare | Patient flow, waiting-area occupancy, movement between departments | Locate service bottlenecks, inform wayfinding changes and support facilities planning |
| Transport | Concourse presence, platform distribution, dwell and time-of-day flow | Monitor crowding patterns, plan customer-service coverage and review infrastructure |
| Offices and residential environments | Area occupancy, recurring presence and movement between shared spaces | Inform space planning, cleaning schedules and amenity management |
Metrics need a comparator
A dashboard becomes useful when its measures connect to another source of truth. Retailers can compare estimated visits with point-of-sale activity, but WiFi data shouldn't be treated as a direct transaction counter. A long dwell may indicate strong product consideration, a queue, poor navigation or a service delay. The operational team needs context before acting.
For hospitality, a manager might review zone occupancy alongside bookings, staffing and service times. For a hospital, movement data should be considered with appointment schedules and patient-flow records, with strict controls around sensitive environments. In transport, a crowding pattern becomes more actionable when paired with timetable changes, disruption logs or cleaning activity.
Make the reporting cadence fit the operation
Real-time or near-real-time measures can support immediate decisions, such as opening another service point or deploying staff to a busy area. Longer-term reporting is better for layout changes, capital planning and comparing like-for-like periods. The useful question isn't whether a platform has many KPIs. It's whether each KPI has an owner, a decision threshold and a documented response.
Privacy Compliance and Data Governance in the UK
The common assumption that WiFi analytics is automatically anonymous is unsafe. A device identifier may be hashed, shortened or rotated, yet still be treated as personal data if an organisation can single out a device, link observations or use the information to infer an individual pattern. UK operators need to assess the actual processing design, not rely on the label attached to a vendor's dashboard.
The Information Commissioner's Office guidance for WiFi operators is relevant across retail, leisure, transport and employment settings. It reinforces that MAC-address-based analytics can create UK GDPR obligations, particularly around lawful basis, transparency, retention and individual rights.
Anonymous and pseudonymous aren't interchangeable
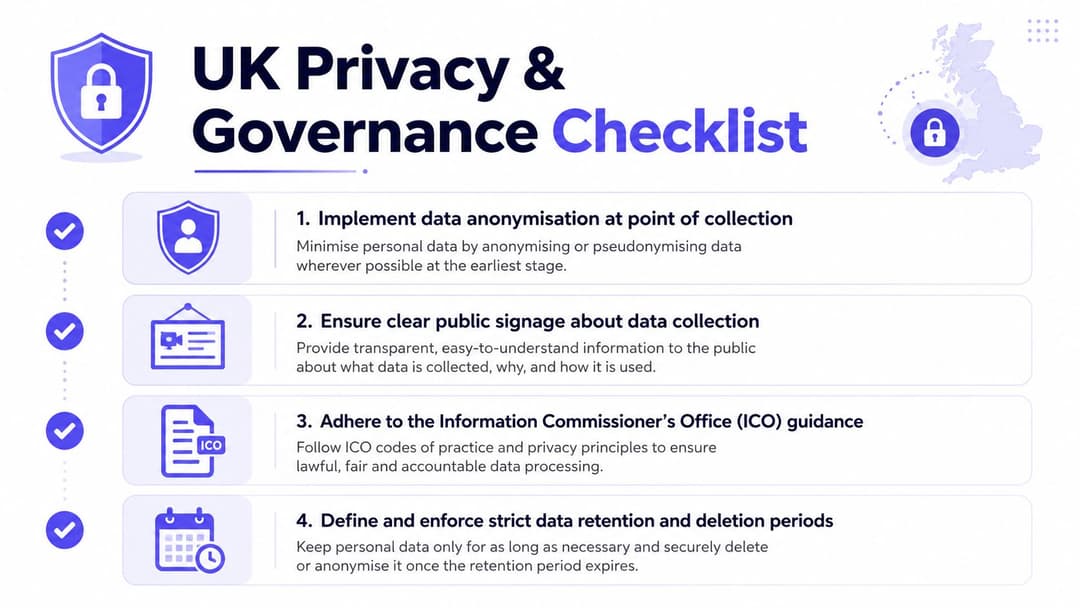
Anonymisation should prevent the organisation from reasonably identifying or singling out a person or device. Pseudonymisation replaces direct identifiers with a coded value, but leaves a possibility of linking records. That distinction affects the controls required, especially when a platform retains raw events, stable hashes, lookup tables or identifiable captive-portal records.
A responsible design normally separates presence analytics from engagement analytics. Aggregated presence data can support broad movement analysis, while any identified engagement layer should require a clear explanation and an appropriate permission mechanism. A privacy notice should state what is collected, why it is collected, how long it is kept, who processes it and how visitors can exercise their rights or object.
Governance must be operational
Before procurement, document a data-protection impact assessment, define the lawful basis, restrict access and agree deletion rules. Don't allow a vendor's default retention setting to become your policy by accident. One UK public body states that it retains WiFi location data for 6 months, demonstrating that retention periods are active operational choices rather than abstract compliance language.
Signage should be visible before or at the point of collection, written for ordinary visitors and consistent with the online privacy notice. The MAJC privacy policy provides a useful example of the kind of public-facing policy language organisations can review when shaping their own documentation. Purple's guest WiFi data privacy guidance also addresses the practical relationship between guest access and information governance.
Compliance test: If your team can't explain what happens to a device observation from detection through deletion, the deployment isn't ready for production.
Deployment Considerations and Vendor Selection Criteria
A successful deployment is usually won or lost before the first dashboard is opened. Start with the existing wireless estate, then test whether its access-point placement, firmware, telemetry and coverage support the intended zones. Meraki, Aruba, Ruckus, Mist and UniFi environments can all be relevant, but compatibility alone doesn't prove that the resulting location model will be useful.
Compare the deployment paths
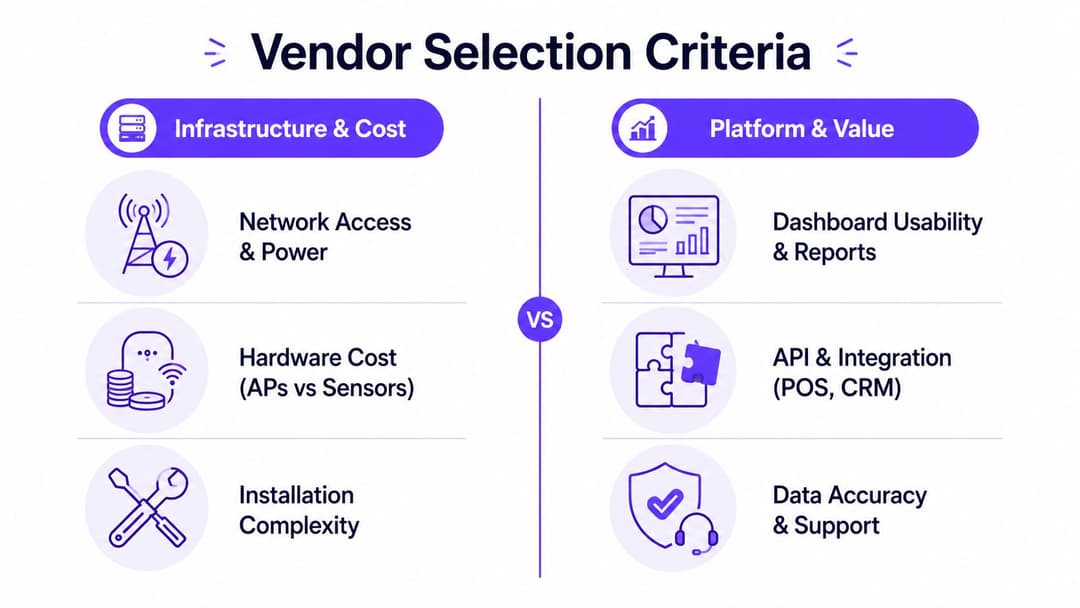
Using existing access points can reduce new hardware and cabling, but it may limit sensor placement or the consistency of data across sites. Dedicated sensors can provide a more controlled measurement layer, though they add installation, power, maintenance and procurement overhead. A hybrid approach often makes sense when a venue needs more dependable entrance counts or specific coverage that the WLAN can't provide.
The platform should also let the operator define and adjust zones without recabling. A department, queue area or tenant boundary can change after a refurbishment. If every zone amendment requires an engineering visit, the analytics system becomes too rigid for an active venue.
Test the platform, not just the feature list
Ask vendors to demonstrate the complete workflow:
- Accuracy method: Request the calibration process, confidence reporting and validation plan for the actual site.
- Data handling: Confirm where raw observations are processed, how identifiers are protected and how deletion is enforced.
- Integration: Check whether data can reach existing POS, CRM, business-intelligence and marketing systems through documented APIs or exports.
- Operations: Test live views, scheduled reports, user permissions, alerts and audit records with real venue roles.
- Multi-site consistency: Verify that a visitor metric means the same thing across stores, buildings or transport locations.
- Support model: Establish who investigates drift when a refurbishment, access-point move or radio change affects accuracy.
Don't ignore total cost
The subscription is only one part of the decision. Include surveying, calibration, access-point changes, installation, data integration, privacy work, training and ongoing review. A low-cost platform that produces ambiguous data can cost more than a higher-priced service that operators trust and use.
The WiFi buying guide can help structure the infrastructure questions. Run a bounded pilot with a named operational owner, a clear comparator and a decision about what would justify expansion.
How Purple Transforms WiFi Data into Actionable Insights
Purple combines guest WiFi authentication with analytics and location intelligence. Its passwordless approach is designed to replace shared guest passwords and cumbersome captive-portal experiences, while creating a consent point for first-party engagement data. That distinction matters because anonymous presence data and identified visitor engagement answer different operational and marketing questions.
For a venue, the practical value is the connection between access and insight. A platform can map zone-level dwell and movement across a floor plan, then connect permitted engagement data to CRM connectors or marketing automation workflows. That gives an operator a route from a visitor's WiFi interaction to a measurable follow-up, provided the venue has established an appropriate lawful basis and transparent consent experience.
Purple also supports OpenRoaming and Passpoint -certified connectivity. The publisher states that guests can authenticate once and receive encrypted connectivity across 80,000+ venues worldwide, which can reduce repeated sign-in friction for participating visitors. That capability is distinct from passive presence measurement, so procurement teams should assess authentication, analytics and identity functions separately rather than treating them as one undifferentiated feature.
Fit with existing network estates
The platform is designed to work with network vendors including Meraki, Aruba, Ruckus, Mist and UniFi. Purple states that deployments can go live in weeks rather than months, but the venue should still validate that claim against its own change-control process, site survey, privacy review and integration workload.
Optional functions such as surveys and enhanced security can extend the use case beyond movement reporting. A hotel might combine guest access with feedback, while a residential operator could separate resident, staff and visitor experiences. In healthcare, transport and events, the more important question is whether the platform's data boundaries and reporting controls match the sensitivity and operational rhythm of the site.
Purple isn't a substitute for calibration or governance. Its relevance is that authentication, analytics, integrations and network access can be considered within one operating model, reducing the number of disconnected systems that teams must reconcile.
Moving from Analytics to Operational Improvement
Start with one operational problem, not a long list of available metrics. A retail team might begin with an underused department, a hospitality operator with queue pressure, or a property manager with uncertain shared-space occupancy. Define the zone, the baseline period, the comparator data and the person responsible for acting on the result.
Use WiFi analytics alongside other evidence. Transactions can validate commercial movement, staffing records can explain service pressure, and manual observations can reveal why a route changes. The UK Department for Transport's use of unique visits, time patterns and repeat behaviour offers a useful comparator for designing measures that describe behaviour rather than merely counting technical events.
A practical rollout has three stages:
- Pilot: Survey the site, define zones, complete privacy documentation and test the output against an appropriate comparator.
- Operationalise: Give managers scheduled reports, clear metric definitions and a response process for notable changes.
- Improve: Review whether decisions changed, refine zones and recalibrate after physical or network alterations.
Don't launch a dashboard without agreeing what success means. The strongest programmes create a shared review between network teams, operations, marketing, facilities and data protection colleagues. That structure turns movement observations into controlled experiments, such as changing staffing, adjusting wayfinding or testing a layout, then checking whether the intended operational outcome followed.
Purple provides guest WiFi authentication, zone-level analytics, integrations and optional engagement tools for UK venues that want to connect wireless access with practical movement insight. Visit Purple to assess how its platform could support a governed pilot across your retail, hospitality, healthcare, transport or property environment.