Cómo el WiFi para invitados respalda el análisis de recintos y el seguimiento de afluencia
This guide provides a technical and operational framework for leveraging guest WiFi to gain deep insights into visitor behaviour within physical venues. It details how to capture and analyse data for footfall tracking and dwell time calculation, enabling IT and operations leaders to make data-driven decisions that optimize staffing, enhance venue layout, and increase business ROI.
🎧 Escucha esta guía
Ver transcripción
Resumen ejecutivo
Para los operadores de recintos y líderes de TI, el WiFi para invitados ya no es solo un servicio; es una fuente crítica de inteligencia empresarial. Más allá de proporcionar acceso a internet, una infraestructura WiFi moderna captura un rico flujo de datos que revela cómo los visitantes se mueven e interactúan con un espacio físico. Esta guía proporciona un marco técnico y operativo para comprender cómo aprovechar el WiFi para invitados en el análisis avanzado de recintos, centrándose específicamente en el seguimiento de afluencia, el cálculo del tiempo de permanencia y el análisis del comportamiento de los visitantes. Al traducir los datos brutos de WiFi en información procesable, las organizaciones pueden optimizar la dotación de personal, mejorar la distribución del recinto, aumentar el ROI de marketing y mejorar la experiencia general del visitante. Esta referencia está diseñada para gerentes de TI, arquitectos de redes y directores de operaciones que necesitan implementar, administrar y extraer valor de su plataforma de inteligencia WiFi. Cubre la tecnología subyacente, las mejores prácticas de implementación, las consideraciones de cumplimiento bajo el GDPR y los métodos para medir el impacto comercial, pasando de conceptos teóricos a una guía práctica de implementación.
Análisis técnico detallado
Comprender cómo funciona el análisis de WiFi requiere observar los datos generados en las diferentes etapas de interacción de un dispositivo con la red. El proceso comienza incluso antes de que un usuario se autentique, proporcionando una capa fundamental de datos de presencia y movimiento.
Recopilación pasiva de datos: Solicitudes de sondeo
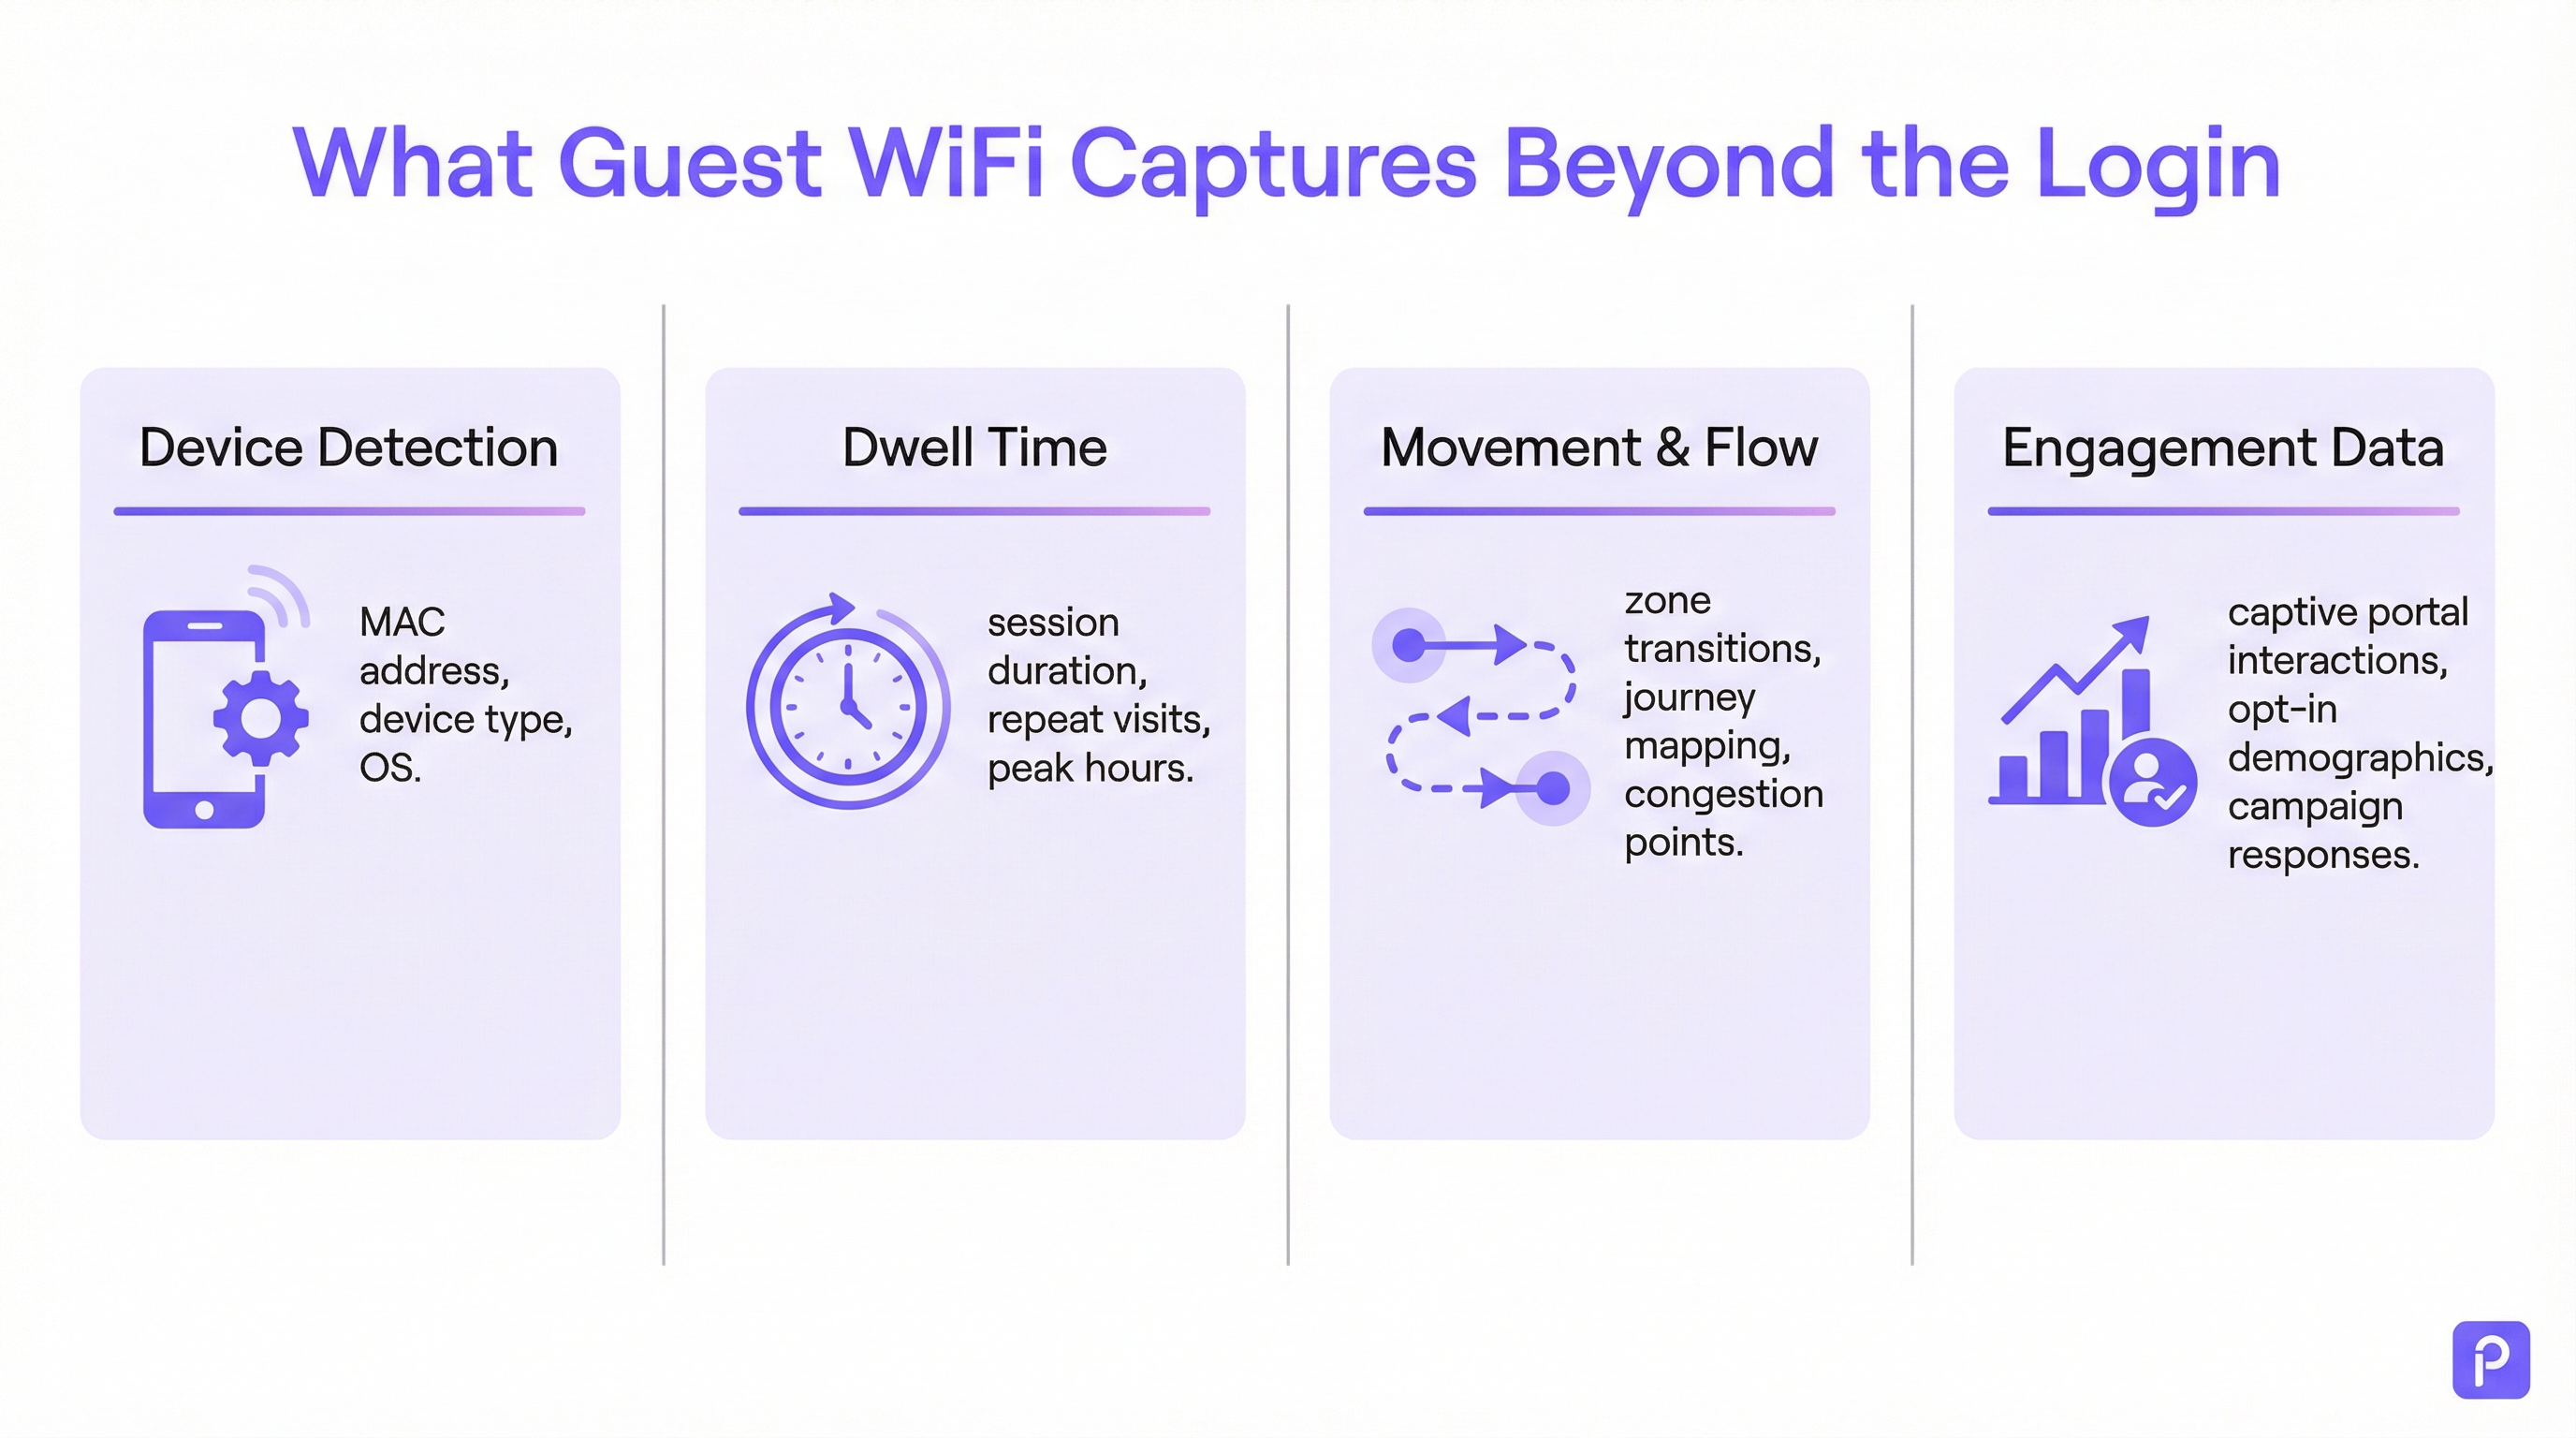
Todo dispositivo habilitado para WiFi (teléfono inteligente, tableta, computadora portátil) emite periódicamente "solicitudes de sondeo" (probe requests). Estos son pequeños paquetes de datos enviados por el dispositivo para descubrir redes WiFi cercanas. De manera crucial, cada solicitud de sondeo contiene la dirección única de Control de Acceso al Medio (MAC) del dispositivo. Incluso si un dispositivo nunca se conecta a la red, los puntos de acceso (AP) dentro del recinto pueden detectar y registrar estas solicitudes de sondeo.
- Qué se captura: Dirección MAC, Indicador de Fuerza de Señal Recibida (RSSI) y la marca de tiempo de la detección.
- Cómo se utiliza: Al triangular el RSSI de múltiples AP, el sistema puede aproximar la ubicación del dispositivo. Un flujo continuo de estas detecciones permite a la plataforma rastrear la ruta de un dispositivo a través del recinto. Esto forma la base del análisis de afluencia para todos los dispositivos habilitados para WiFi dentro del alcance, no solo aquellos conectados a la red.
- El desafío de la aleatorización de MAC: Desde iOS 14 y Android 10, los dispositivos ahora usan con frecuencia una dirección MAC aleatoria o privada para las solicitudes de sondeo con el fin de proteger la privacidad del usuario. Esto puede provocar que un solo dispositivo se cuente varias veces. Las plataformas de análisis de nivel empresarial emplean algoritmos sofisticados para deduplicar estas direcciones aleatorias, utilizando otras características de la señal y análisis temporal para reconstruir un recorrido probable para un solo dispositivo. [1]
Recopilación activa de datos: Sesiones conectadas
Cuando un visitante se conecta activamente al WiFi para invitados, generalmente a través de un Captive Portal, se obtiene un conjunto de datos mucho más rico. El proceso de autenticación crea una sesión formal con un inicio y un fin definidos.
- Cálculo del tiempo de permanencia: La métrica más fundamental derivada de una sesión conectada es el tiempo de permanencia. Se calcula como la diferencia de tiempo entre el inicio de la sesión (autenticación) y el final de la sesión (desconexión o tiempo de espera agotado). Una plataforma robusta irá más allá, fusionando múltiples sesiones cortas del mismo dispositivo dentro de un período de tiempo determinado en una sola "visita", proporcionando una imagen más precisa del tiempo total que pasó en el recinto.
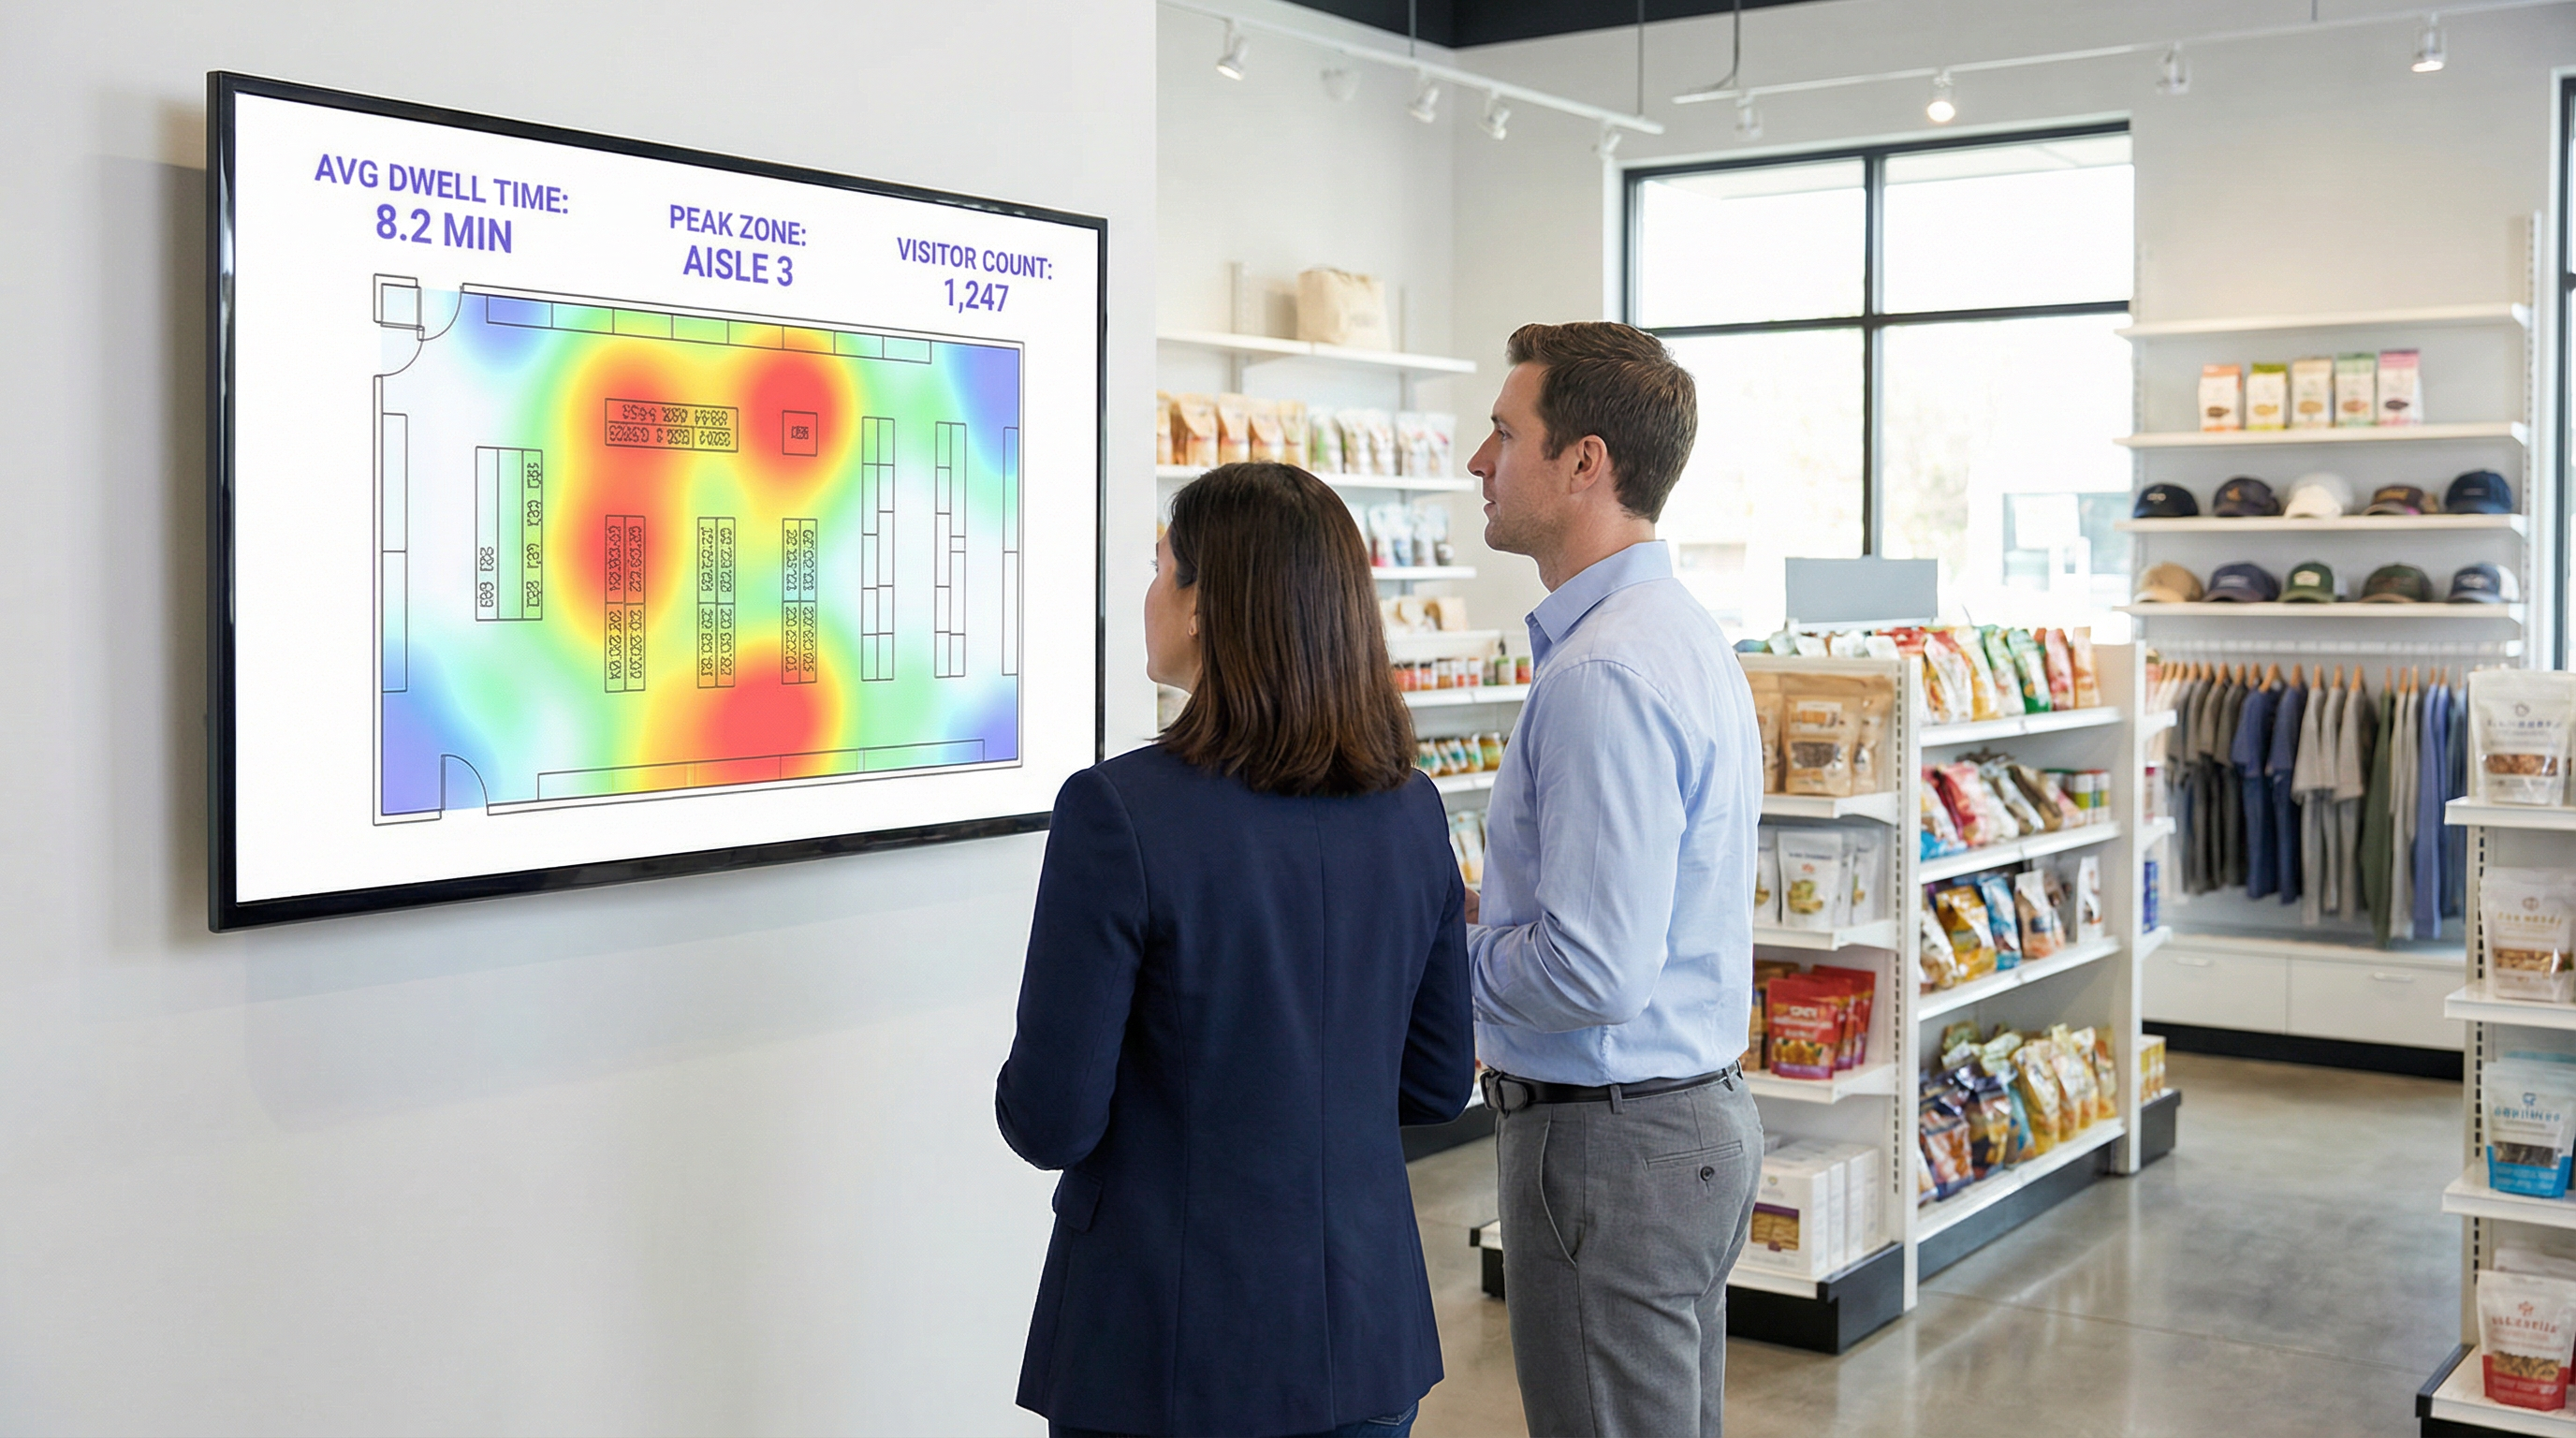
- Análisis de ubicación y zonas: Una vez conectado, la ubicación del dispositivo se puede rastrear con mayor precisión. La plataforma monitorea continuamente el RSSI de los AP con los que se comunica el dispositivo. Esto permite un análisis detallado basado en zonas: cuántas personas hay en el vestíbulo frente a la cafetería, cuánto tiempo permanecen en cada área y el flujo de tráfico entre zonas. Estos son los datos que impulsan los mapas de calor en tiempo real y el análisis del recorrido.
- Enriquecimiento de datos de origen (First-Party Data): El Captive Portal es un activo estratégico crítico. Al ofrecer autenticación a través del inicio de sesión social (por ejemplo, Facebook, LinkedIn), correo electrónico o un formulario simple, el recinto puede, con el consentimiento explícito del usuario, vincular la dirección MAC anónima a una identidad del mundo real o perfil demográfico. Esto transforma los datos de recuentos de afluencia anónimos en valiosos datos de clientes de origen que se pueden utilizar para marketing personalizado e integración de CRM, cumpliendo totalmente con estándares como el GDPR. [2]
Guía de implementación
Una implementación exitosa de análisis de WiFi tiene que ver tanto con el diseño físico de la red y la estrategia de datos como con la configuración del software.
Paso 1: Auditoría de densidad y ubicación de AP
Es posible que su distribución de AP existente esté optimizada para la cobertura, no para el análisis. Para un seguimiento preciso de la ubicación, se requiere una mayor densidad de AP para permitir una triangulación efectiva.
- Diseño solo para cobertura: Los AP se colocan para maximizar el alcance de la señal, lo que a menudo resulta en una superposición mínima entre las zonas de cobertura de los AP.
- Diseño listo para análisis: Los AP se colocan para crear una superposición significativa. Un dispositivo en cualquier ubicación dada debe ser detectable por al menos tres AP para un cálculo de ubicación confiable. Una mejor práctica general es apuntar a un AP por cada 150-200 metros cuadrados en áreas abiertas.
Paso 2: Configuración de la ingesta de datos
La plataforma de análisis necesita recibir datos de su controlador de red o directamente de los AP. Por lo general, esto implica configurar la red para reenviar datos de syslog o trampas SNMP que contengan la solicitud de sondeo relevante y la información de la sesión al endpoint de la nube de análisis. Asegúrese de que las reglas de su firewall permitan este tráfico saliente.
Paso 3: Definición de zonas y planos de planta
Cargue los planos de planta de su recinto en la plataforma de análisis. Luego, utilizando las herramientas proporcionadas, dibuje "zonas" poligonales sobre el mapa que correspondan a distintas áreas operativas (por ejemplo, 'Entrada principal', 'Pasillo 3', 'Área del bar', 'Sala de reuniones 1'). Este es el paso de configuración más crítico para generar informes significativos y específicos del contexto.
Paso 4: Diseño del Captive Portal y del flujo de trabajo de consentimiento
Diseñe su Captive Portal no solo como una puerta de inicio de sesión, sino como una herramienta de gobernanza de datos. En colaboración con sus equipos legales y de marketing:
- Redacte un aviso de privacidad claro: Explique en un lenguaje sencillo qué datos se están recopilando (dirección MAC, ubicación, tiempos de sesión) y con qué propósito (para mejorar las operaciones del recinto, para marketing).
- Implemente un consentimiento granular: Proporcione casillas de verificación separadas y explícitas para (a) aceptar los términos de acceso a la red y (b) dar su consentimiento para la recopilación de datos con fines de análisis y marketing. Este es un requisito fundamental para el cumplimiento del GDPR.
- Ofrezca un intercambio de valor: Aumente las tasas de aceptación ofreciendo un incentivo por compartir datos, como un cupón de descuento o acceso a contenido premium.
Mejores prácticas
- Filtre al personal y los dispositivos estáticos: Asegúrese de tener un proceso para excluir las direcciones MAC de los dispositivos del personal y los equipos fijos (como televisores inteligentes o terminales de pago) de sus análisis. La mayoría de las plataformas le permiten cargar una lista de MAC para ignorar, evitando que sus propias operaciones sesguen los datos de los visitantes.
- Intégrese con otros sistemas: El verdadero poder del análisis de WiFi se materializa cuando se combina con otras fuentes de datos. La integración con los sistemas de punto de venta (POS) le permite correlacionar el tiempo de permanencia con el gasto. La integración con su CRM le permite vincular el historial de visitas a los perfiles de los clientes. Priorice las plataformas con API REST robustas y bien documentadas.
- Cumpla con las políticas de retención de datos: Establezca una política clara de retención de datos basada en los requisitos legales (como el principio de limitación de almacenamiento del GDPR) y las necesidades comerciales. Los datos agregados y anonimizados se pueden conservar indefinidamente, pero la información de identificación personal (PII) debe purgarse o anonimizarse automáticamente después de un período definido (por ejemplo, 24 meses).
Solución de problemas y mitigación de riesgos
- Problema: Recuentos de visitantes inexactos: Esto a menudo se debe a la aleatorización de MAC. Asegúrese de que su plataforma tenga una función específica para abordar esto. Si los recuentos aún parecen altos, investigue si el personal o los dispositivos estáticos se están incluyendo en los datos.
- Problema: Poca precisión de ubicación: Esto casi siempre apunta a una densidad de AP insuficiente o una ubicación subóptima. Realice un estudio del sitio para identificar brechas de cobertura y áreas donde un dispositivo solo puede ser 'visto' por uno o dos AP.
- Riesgo: Falla en el cumplimiento del GDPR/CCPA: El mayor riesgo es un proceso de consentimiento mal configurado. Audite periódicamente el flujo de trabajo de su Captive Portal para asegurarse de que cumpla con los últimos estándares de consentimiento explícito e informado. Asegúrese de que el proveedor de su plataforma pueda proporcionar un Anexo de Procesamiento de Datos (DPA) que lo comprometa a un manejo de datos conforme a la normativa. [3]
- Riesgo: Violación de la seguridad de los datos: La conexión entre su red y la nube de análisis debe ser segura. Verifique que los datos estén encriptados en tránsito (usando TLS 1.2 o superior) y en reposo. Su plataforma también debe admitir el control de acceso basado en roles (RBAC) para garantizar que los usuarios solo puedan ver los datos relevantes para sus roles.
ROI e impacto comercial
Medir el retorno de la inversión de una plataforma de análisis de WiFi implica rastrear las mejoras en las métricas operativas clave.
- Comercio minorista (Retail): Correlacione el tiempo de permanencia en departamentos específicos con los datos de ventas de su POS. Un aumento del 10 % en el tiempo de permanencia en el departamento de electrónica que se correlaciona con un aumento del 2 % en las ventas de esa categoría proporciona un ROI claro. Utilice los datos de afluencia para realizar pruebas A/B en la distribución de la tienda y medir el impacto en el flujo de visitantes y el descubrimiento de productos.
- Hospitalidad: Optimice la dotación de personal en vestíbulos, bares y restaurantes en función de los datos de ocupación históricos y en tiempo real. Un hotel puede evitar el exceso de personal durante los períodos de poca actividad y prevenir la degradación del servicio durante los picos inesperados, lo que genera ahorros directos en la nómina y mejora la satisfacción de los huéspedes.
- Centros de conferencias: Proporcione a los patrocinadores datos verificables sobre la afluencia y el tiempo de permanencia alrededor de sus stands, creando una nueva fuente de ingresos. Utilice los datos de las sesiones de las salas de reuniones para informar la programación de eventos futuros, centrándose en los temas que generan mayor participación.
[1] IEEE Standards Association. (2020). IEEE 802.11-2020 - IEEE Standard for Information Technology. https://standards.ieee.org/standard/802_11-2020.html [2] General Data Protection Regulation (GDPR). (2018). Regulation (EU) 2016/679 of the European Parliament and of the Council. https://gdpr-info.eu/ [3] Information Commissioner's Office (ICO). (2021). Guide to the General Data Protection Regulation (GDPR). https://ico.org.uk/for-organisations/guide-to-data-protection/guide-to-the-general-data-protection-regulation-gdpr/
Términos clave y definiciones
Guest WiFi Analytics
The process of capturing, analysing, and interpreting data from guest WiFi networks to understand visitor behaviour in a physical space.
IT teams use this to transform the WiFi network from a cost centre into a source of business intelligence that informs operational decisions.
WiFi Footfall Tracking
The use of WiFi signals (specifically probe requests and session data) to measure the number of people entering a venue or specific zone and the paths they take.
Operations managers use this data to understand visitor journeys, identify bottlenecks, and optimise venue layouts without needing separate people-counting hardware.
Dwell Time
The total amount of time a visitor's device is detected within a venue or a specific predefined zone during a single visit.
This is a primary KPI for engagement. In retail, longer dwell time often correlates with higher spend. In hospitality, it helps measure the utilisation of amenities like bars and lounges.
MAC Address
A unique hardware identifier assigned to a device's network interface. It is the primary identifier used to track a device, even before it connects to a network.
While essential for tracking, IT teams must be aware of MAC randomisation and ensure their analytics platform can account for it to avoid inaccurate visitor counts.
RSSI (Received Signal Strength Indicator)
A measurement of the power present in a radio signal received by an access point from a device. The stronger the signal, the closer the device is assumed to be.
This is the core data point used for location triangulation. Network architects need to ensure sufficient AP density for reliable RSSI readings from multiple points.
Captive Portal
A web page that a user must view and interact with before being granted access to a public WiFi network.
For IT and marketing, this is the strategic point for enforcing terms, gaining GDPR-compliant consent for data collection, and capturing first-party data like email addresses.
MAC Randomisation
A privacy feature in modern operating systems (iOS, Android) that periodically changes the MAC address a device uses for WiFi scanning to prevent passive tracking.
This is the single biggest technical challenge for accurate footfall counting. A key task for network architects is to select an analytics platform that has a proven mechanism for mitigating its effects.
Zone Analytics
The analysis of visitor behaviour within predefined virtual areas (zones) of a venue, such as movement between zones and dwell time per zone.
Venue operators use this to get granular insights. Instead of just knowing total visitors, they can compare the performance of 'Aisle 1' vs. 'Aisle 2' or see how many lobby visitors proceed to the restaurant.
Casos de éxito
A 200-room hotel wants to reduce lobby congestion during the peak check-in window (3-5 PM) and improve the guest experience.
- Deploy WiFi Analytics: Ensure AP density in the lobby, entrance, and bar areas meets the 3-AP visibility rule. Define zones for 'Check-in Queue', 'Lobby Seating', and 'Bar Entrance'. 2. Data Collection (1 Week): Collect baseline data on visitor flow and dwell times during the 3-5 PM window. 3. Analysis: The analytics reveal that dwell time in the 'Check-in Queue' zone peaks at 15 minutes, and footfall from the entrance flows directly to the queue, bypassing the lobby bar. 4. Intervention: The hotel implements a mobile check-in station in the 'Lobby Seating' area and updates the captive portal to promote a 'skip the queue' message with a link to the hotel app. 5. Measure & Iterate: Post-intervention data shows queue dwell time has dropped to 8 minutes, and footfall to the bar area from the entrance has increased by 20%.
A retail chain is redesigning its flagship store and wants to validate that the new layout improves product discovery and customer engagement.
- Baseline Analysis: Before the redesign, use WiFi analytics to map the most common customer journeys and generate a footfall heatmap. Identify which zones have the highest and lowest dwell times. 2. Post-Redesign Analysis: After the new layout is implemented, conduct the same analysis. 3. Comparative Reporting: Compare the before-and-after heatmaps and journey flows. The new layout is successful if: (a) footfall is more evenly distributed, indicating better discovery; (b) dwell time has increased in high-margin product zones; and (c) the percentage of visitors who only visit the entrance zone (bouncing) has decreased. 4. POS Integration: Correlate the increase in dwell time in a specific zone (e.g., 'Premium Denim') with sales data for that category to calculate the direct revenue impact of the layout change.
Análisis de escenarios
Q1. A large conference is experiencing complaints about overcrowding in the corridors between sessions. How would you use WiFi analytics to diagnose the problem and propose a data-driven solution?
💡 Sugerencia:Think about using time-series data for specific zones and correlating it with the event schedule.
Mostrar enfoque recomendado
First, define the corridor areas as distinct zones in the analytics platform. Then, analyse the footfall and device density metrics for these zones, specifically in the 15-minute windows before and after major keynote sessions. This will quantify the congestion peaks. The solution would be to present this data to the event organisers and recommend staggering the session end times by 10-15 minutes for adjacent large halls to smooth out the flow of attendees. The success of this change can be measured by a reduction in peak device density in the corridor zones during the next event.
Q2. A retail store's marketing team wants to prove the ROI of a new in-store digital signage campaign. How can they use guest WiFi analytics to measure the campaign's impact on footfall and dwell time?
💡 Sugerencia:The key is to isolate the variable. You need to compare behaviour in the target zone before and during the campaign.
Mostrar enfoque recomendado
Define a zone around the new digital signage. Establish a baseline by measuring the average dwell time and the percentage of total store visitors who enter that zone for a two-week period before the campaign starts. Once the campaign is active, continue to measure the same metrics. The ROI can be demonstrated by showing a statistically significant increase in either dwell time within the zone (people are stopping to watch) or the capture rate of the zone (more people are being drawn to the area). For a more advanced analysis, integrate with POS data to see if the increased engagement correlates with a sales lift for the promoted products.
Q3. A hotel manager has noticed a 15% drop in bar revenue over the last quarter but overall visitor numbers are stable. How could they use WiFi analytics to investigate potential causes related to visitor behaviour?
💡 Sugerencia:This requires looking at visitor journeys and flow patterns, not just isolated zone data.
Mostrar enfoque recomendado
The investigation should focus on visitor journey analysis. Define zones for the lobby, reception, lifts, and the bar. Use the platform's flow analysis tools to answer two questions: 1. What percentage of visitors who enter the lobby also enter the bar zone? Is this percentage trending down over the last quarter? 2. Of the visitors who do enter the bar, is their average dwell time decreasing? A drop in the lobby-to-bar conversion rate might suggest an issue with signage or visibility. A decrease in dwell time for those who do enter the bar might suggest a problem with service, atmosphere, or offerings. The data pinpoints whether the problem is attracting guests or retaining them.
Conclusiones clave
- ✓Your guest WiFi is a powerful sensor network capable of generating deep business intelligence.
- ✓WiFi analytics captures both passive (probe requests) and active (connected sessions) data to build a complete picture of visitor behaviour.
- ✓Accurate footfall and dwell time analysis depends on strategic AP placement with sufficient density for triangulation (the '3-AP rule').
- ✓MAC randomisation is a critical technical challenge; your analytics platform must have a robust mechanism to handle it for accurate counting.
- ✓The captive portal is your gateway for gaining GDPR-compliant consent and enriching anonymous data with valuable first-party demographic information.
- ✓The highest ROI comes from integrating WiFi analytics data into core operational workflows for staffing, marketing, and space utilisation.
- ✓Compliance is non-negotiable. Your consent workflow must be explicit, and your data handling must adhere to GDPR/CCPA principles.
