Como o Guest WiFi apoia o Venue Analytics e o Rastreamento de Fluxo de Pessoas
This guide provides a technical and operational framework for leveraging guest WiFi to gain deep insights into visitor behaviour within physical venues. It details how to capture and analyse data for footfall tracking and dwell time calculation, enabling IT and operations leaders to make data-driven decisions that optimize staffing, enhance venue layout, and increase business ROI.
🎧 Ouça este Guia
Ver Transcrição
Resumo Executivo
Para operadores de espaços e líderes de TI, o guest WiFi não é mais apenas uma comodidade; é uma fonte crítica de business intelligence. Além de fornecer acesso à internet, uma infraestrutura de WiFi moderna captura um fluxo rico de dados que revela como os visitantes se movem e interagem com um espaço físico. Este guia fornece uma estrutura técnica e operacional para entender como aproveitar o guest WiFi para venue analytics avançado, com foco específico no rastreamento de fluxo de pessoas, cálculo de tempo de permanência e análise do comportamento do visitante. Ao transformar dados brutos de WiFi em insights acionáveis, as organizações podem otimizar a equipe, melhorar o layout do espaço, aumentar o ROI de marketing e aprimorar a experiência geral do visitante. Esta referência foi desenvolvida para gerentes de TI, arquitetos de rede e diretores de operações que precisam implantar, gerenciar e extrair valor de sua plataforma de inteligência de WiFi. Ele abrange a tecnologia subjacente, as melhores práticas de implementação, as considerações de conformidade sob a GDPR e os métodos para medir o impacto nos negócios, passando de conceitos teóricos para orientações práticas de implantação.
Análise Técnica Aprofundada
Entender como o WiFi analytics funciona exige observar os dados gerados em diferentes estágios da interação de um dispositivo com a rede. O processo começa mesmo antes de um usuário se autenticar, fornecendo uma camada fundamental de dados de presença e movimento.
Coleta Passiva de Dados: Probe Requests
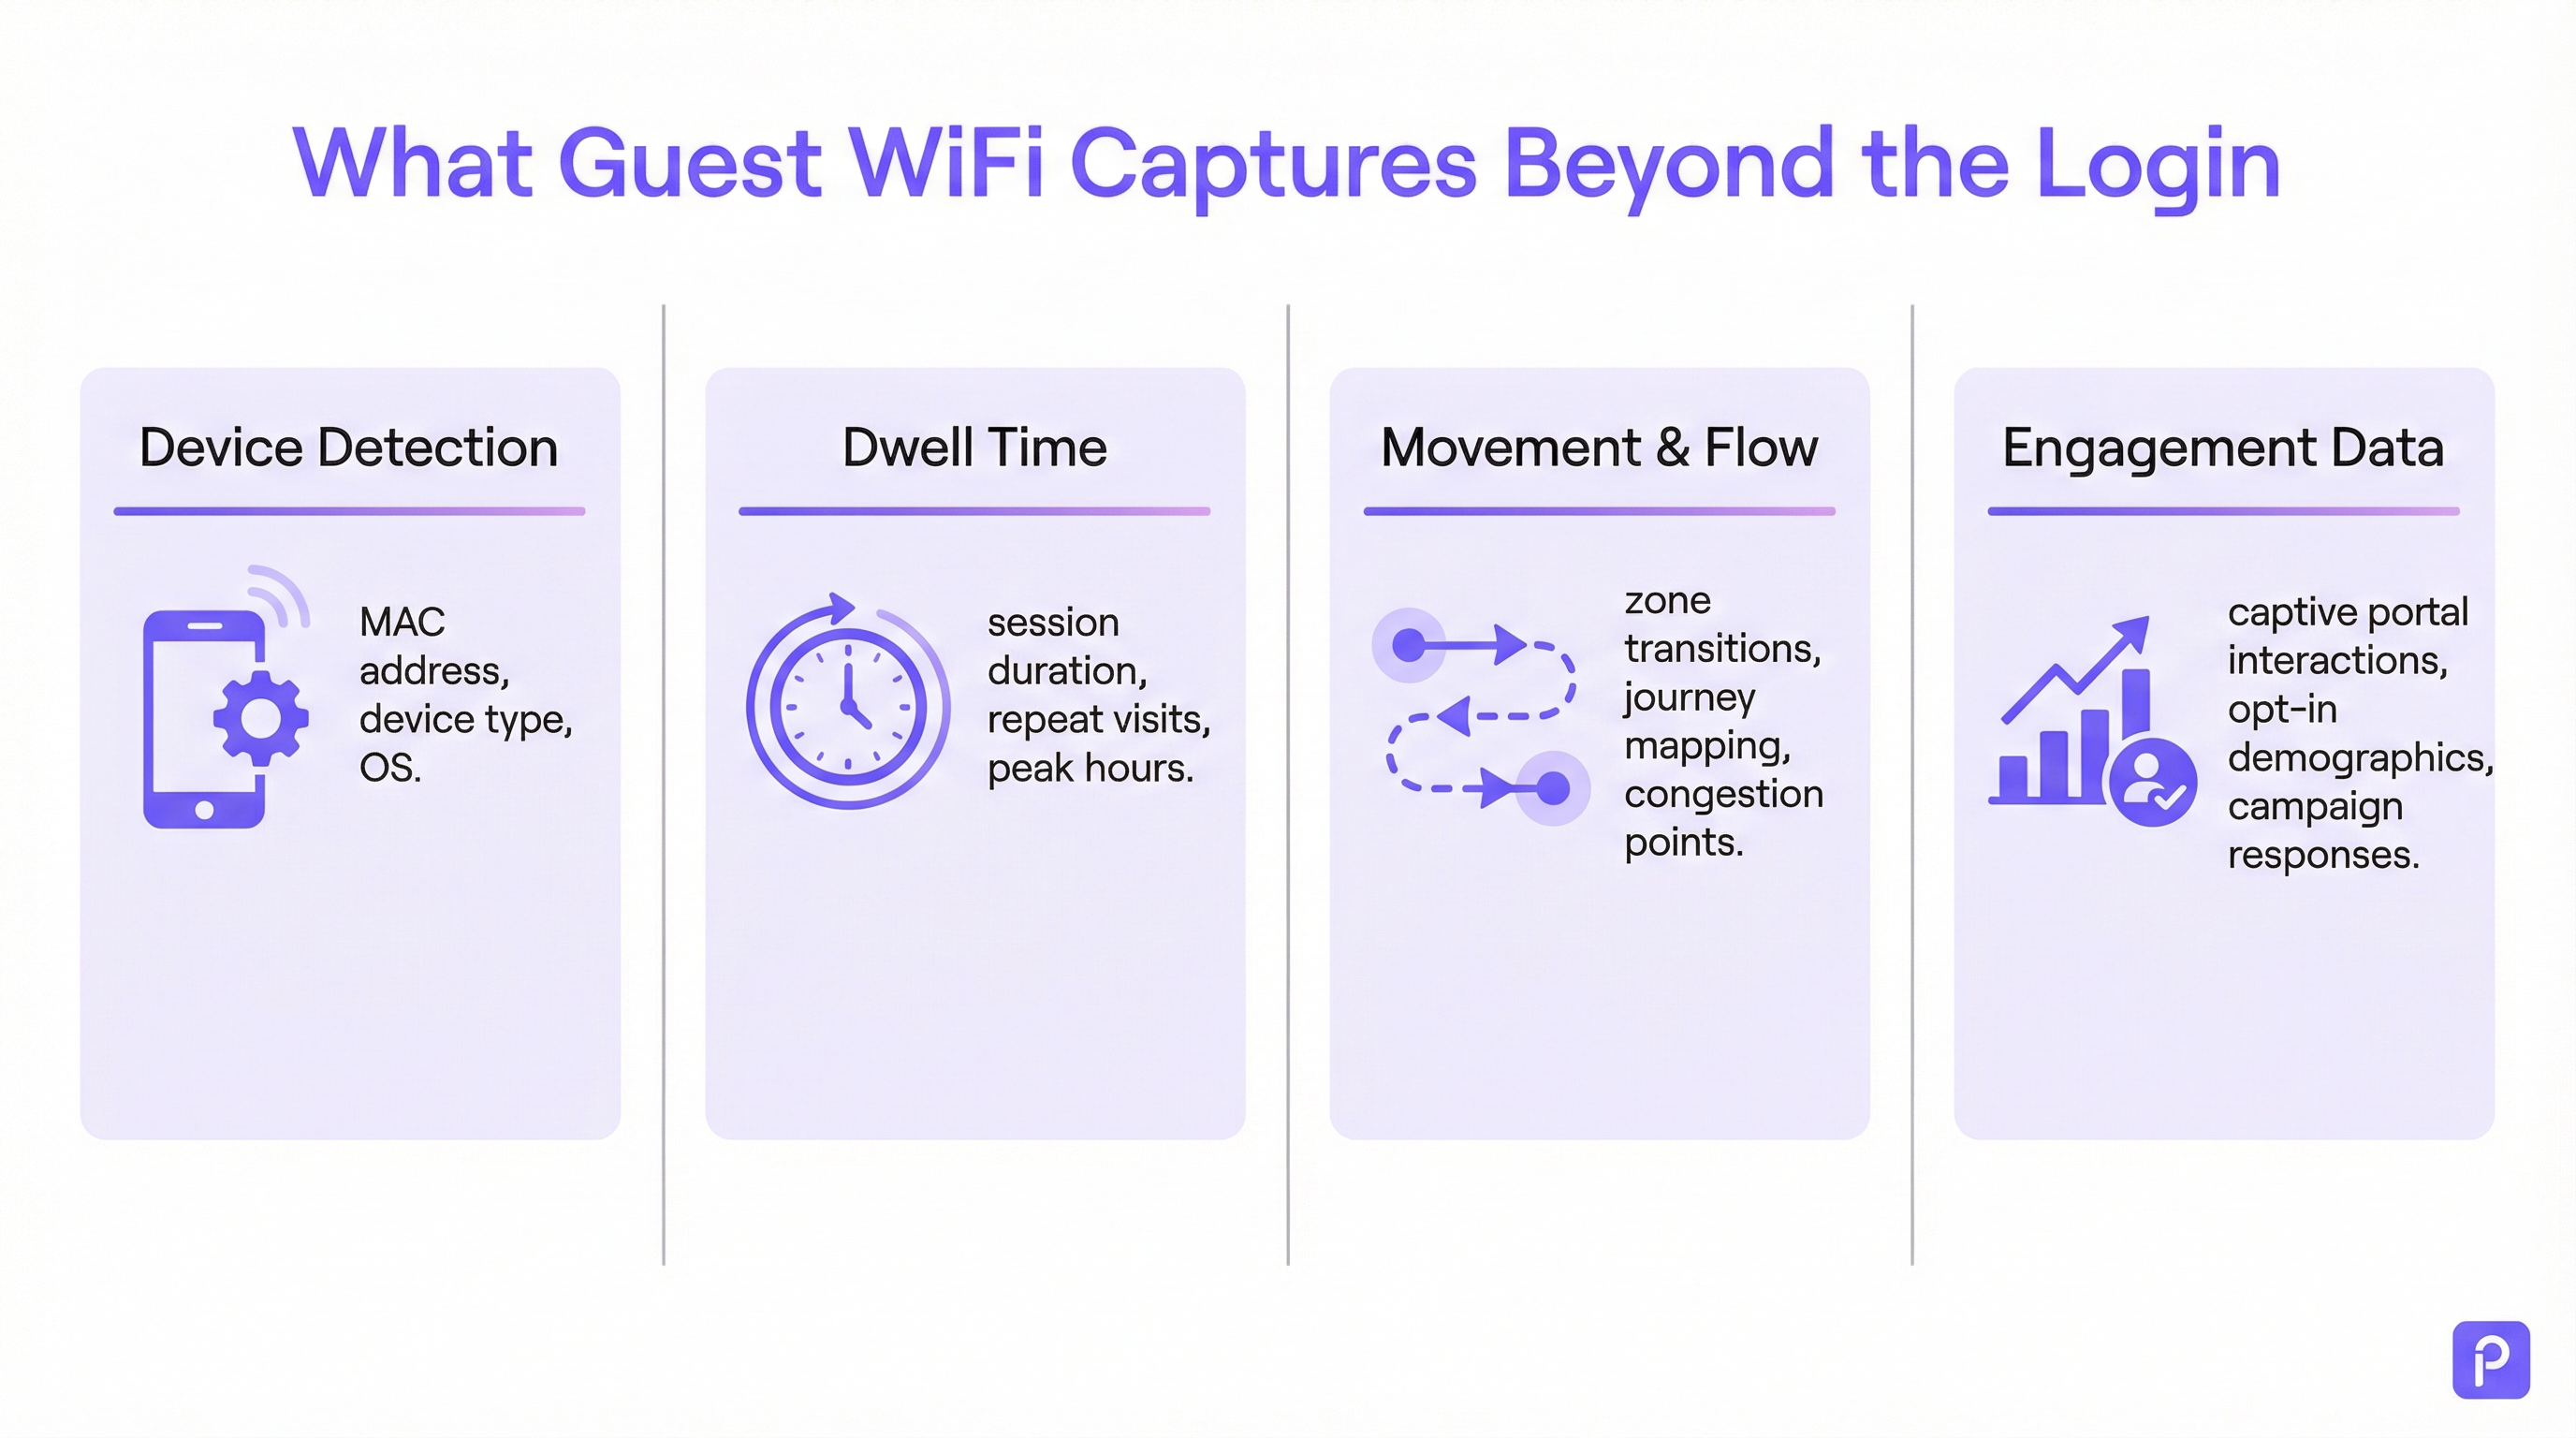
Todo dispositivo com WiFi (smartphone, tablet, laptop) transmite periodicamente "probe requests". Estes são pequenos pacotes de dados enviados pelo dispositivo para descobrir redes WiFi próximas. Fundamentalmente, cada probe request contém o endereço Media Access Control (MAC) exclusivo do dispositivo. Mesmo que um dispositivo nunca se conecte à rede, os pontos de acesso (APs) dentro do local podem detectar e registrar esses probe requests.
- O que é capturado: Endereço MAC, Indicador de Força do Sinal Recebido (RSSI) e o carimbo de data/hora (timestamp) da detecção.
- Como é utilizado: Ao triangular o RSSI de vários APs, o sistema pode aproximar a localização do dispositivo. Um fluxo contínuo dessas detecções permite que a plataforma rastreie o caminho de um dispositivo pelo local. Isso forma a base da análise de fluxo de pessoas para todos os dispositivos com WiFi dentro do alcance, não apenas aqueles conectados à rede.
- O Desafio da Randomização de MAC: Desde o iOS 14 e o Android 10, os dispositivos agora usam frequentemente um endereço MAC randomizado ou privado para probe requests a fim de proteger a privacidade do usuário. Isso pode fazer com que um único dispositivo seja contado várias vezes. Plataformas de analytics de nível corporativo empregam algoritmos sofisticados para desduplicar esses endereços randomizados, usando outras características de sinal e análise temporal para reconstruir uma jornada provável para um único dispositivo. [1]
Coleta Ativa de Dados: Sessões Conectadas
Quando um visitante se conecta ativamente ao guest WiFi, normalmente por meio de um Captive Portal, um conjunto de dados muito mais rico se torna disponível. O processo de autenticação cria uma sessão formal com início e fim definidos.
- Cálculo do Tempo de Permanência (Dwell Time): A métrica mais fundamental derivada de uma sessão conectada é o tempo de permanência. Ele é calculado como a diferença de tempo entre o início da sessão (autenticação) e o fim da sessão (desconexão ou tempo limite). Uma plataforma robusta irá além, unificando várias sessões curtas do mesmo dispositivo dentro de uma determinada janela de tempo em uma única "visita", fornecendo uma imagem mais precisa do tempo total gasto no local.
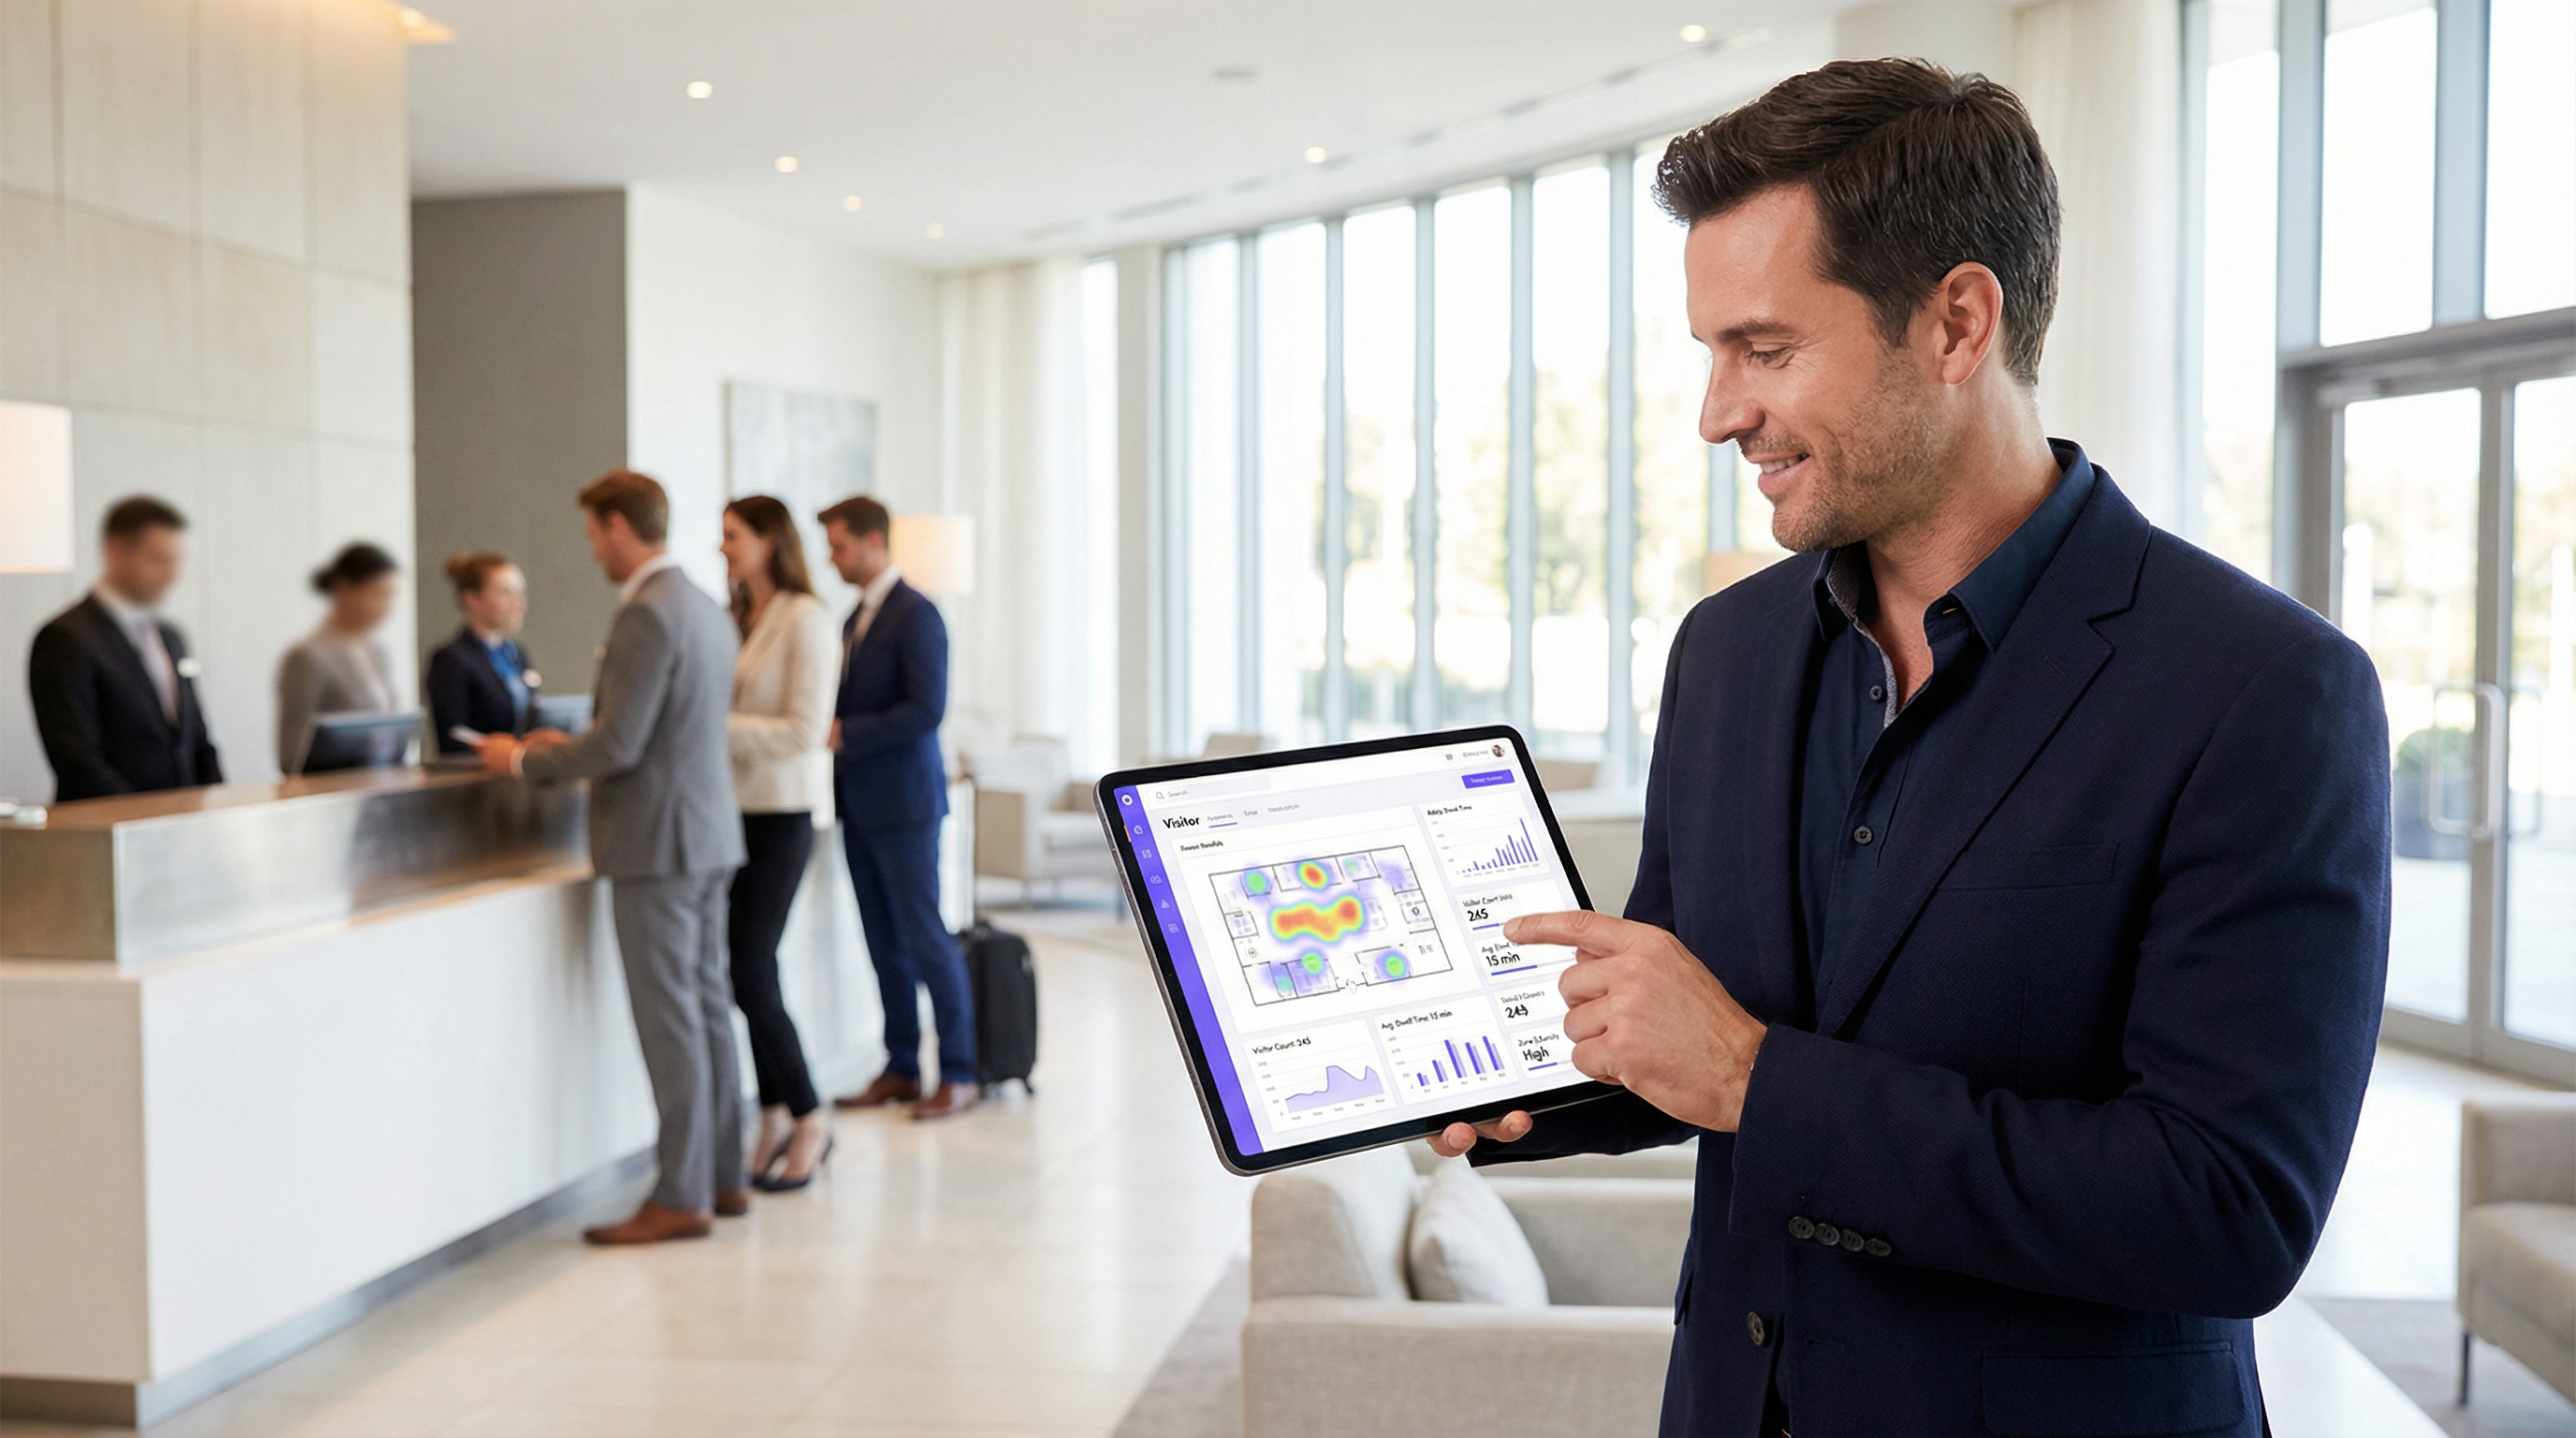
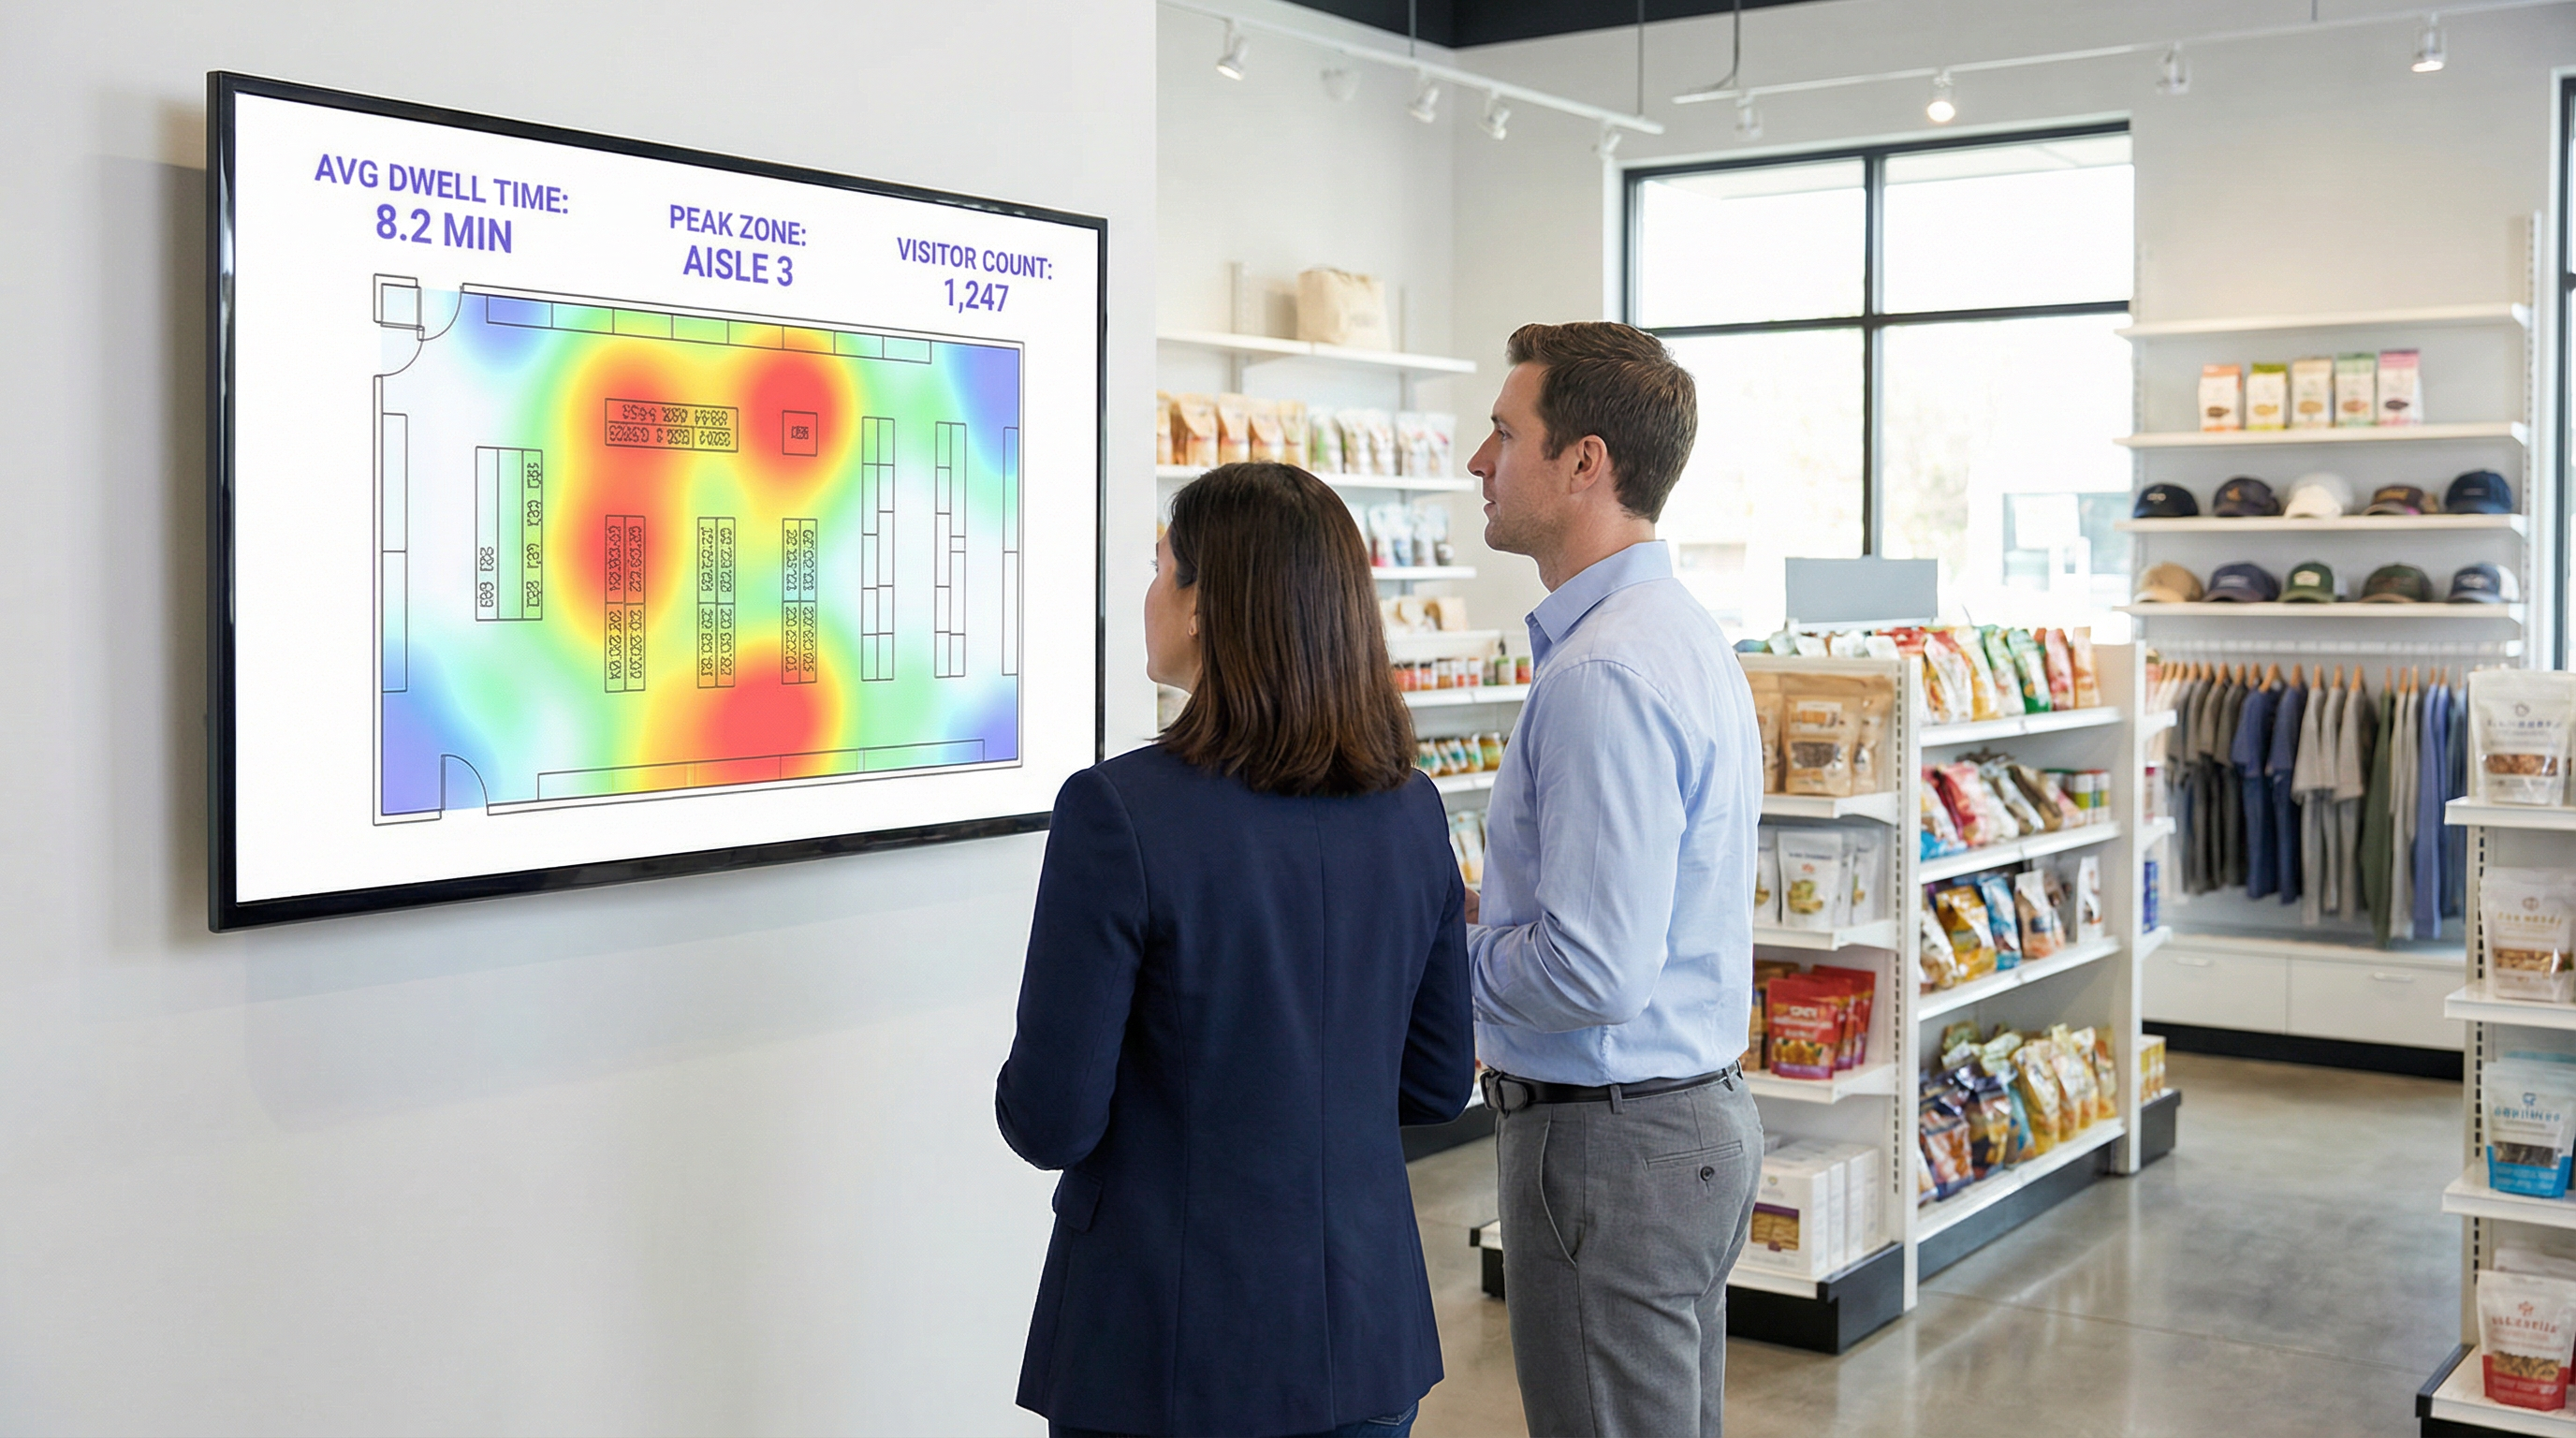
- Analytics de Localização e Zonas: Uma vez conectado, a localização do dispositivo pode ser rastreada com maior precisão. A plataforma monitora continuamente o RSSI dos APs com os quais o dispositivo está se comunicando. Isso permite um analytics detalhado baseado em zonas: quantas pessoas estão no saguão em comparação com o café, quanto tempo elas permanecem em cada área e o fluxo de tráfego entre as zonas. Estes são os dados que alimentam os mapas de calor (heatmaps) em tempo real e a análise de jornada.
- Enriquecimento de First-Party Data: O Captive Portal é um ativo estratégico crítico. Ao oferecer autenticação via login social (por exemplo, Facebook, LinkedIn), e-mail ou um formulário simples, o local pode, com o consentimento explícito do usuário, vincular o endereço MAC anônimo a uma identidade do mundo real ou perfil demográfico. Isso transforma os dados de contagens anônimas de fluxo de pessoas em first-party data ricos de clientes que podem ser usados para marketing personalizado e integração de CRM, em total conformidade com padrões como a GDPR. [2]
Guia de Implementação
Uma implantação bem-sucedida de WiFi analytics depende tanto do design físico da rede e da estratégia de dados quanto da configuração do software.
Passo 1: Auditoria de Posicionamento e Densidade de APs
O layout atual dos seus APs pode estar otimizado para cobertura, não para analytics. Para um rastreamento de localização preciso, é necessária uma maior densidade de APs para permitir uma triangulação eficaz.
- Design Focado Apenas em Cobertura: Os APs são posicionados para maximizar o alcance do sinal, muitas vezes resultando em sobreposição mínima entre as zonas de cobertura dos APs.
- Design Pronto para Analytics: Os APs são posicionados para criar uma sobreposição significativa. Um dispositivo em qualquer local deve ser detectável por pelo menos três APs para um cálculo de localização confiável. Uma melhor prática geral é buscar um AP a cada 150-200 metros quadrados em áreas abertas.
Passo 2: Configurando a Ingestão de Dados
A plataforma de analytics precisa receber dados do seu controlador de rede ou diretamente dos APs. Isso normalmente envolve configurar a rede para encaminhar dados de syslog ou SNMP trap contendo as informações relevantes de probe request e sessão para o endpoint na nuvem de analytics. Certifique-se de que as regras do seu firewall permitam esse tráfego de saída.
Passo 3: Definindo Zonas e Plantas Baixas
Faça o upload das plantas baixas do seu local na plataforma de analytics. Em seguida, usando as ferramentas fornecidas, desenhe "zonas" poligonais sobre o mapa correspondentes a áreas operacionais distintas (por exemplo, 'Entrada Principal', 'Corredor 3', 'Área do Bar', 'Sala de Reunião 1'). Este é o passo de configuração mais crítico para gerar relatórios significativos e específicos de contexto.
Passo 4: Design do Captive Portal e Fluxo de Consentimento
Projete seu Captive Portal não apenas como um portão de login, mas como uma ferramenta de governança de dados. Em colaboração com suas equipes jurídica e de marketing:
- Crie um Aviso de Privacidade Claro: Explique em linguagem simples quais dados estão sendo coletados (endereço MAC, localização, tempos de sessão) e para qual finalidade (para melhorar as operações do local, para marketing).
- Implemente o Consentimento Granular: Forneça caixas de seleção separadas e explícitas para (a) aceitar os termos de acesso à rede e (b) consentir com a coleta de dados para analytics e marketing. Este é um requisito central para a conformidade com a GDPR.
- Ofereça Troca de Valor: Aumente as taxas de opt-in oferecendo um incentivo para o compartilhamento de dados, como um voucher de desconto ou acesso a conteúdo premium.
Melhores Práticas
- Filtre Dispositivos de Funcionários e Estáticos: Certifique-se de ter um processo para excluir os endereços MAC de dispositivos de funcionários e equipamentos fixos (como smart TVs ou terminais de pagamento) do seu analytics. A maioria das plataformas permite que você faça o upload de uma lista de MACs para ignorar, evitando que suas próprias operações distorçam os dados dos visitantes.
- Integre com Outros Sistemas: O verdadeiro poder do WiFi analytics é percebido quando ele é combinado com outras fontes de dados. A integração com sistemas de Ponto de Venda (POS) permite correlacionar o tempo de permanência com os gastos. A integração com o seu CRM permite vincular o histórico de visitas aos perfis dos clientes. Priorize plataformas com APIs REST robustas e bem documentadas.
- Adira às Políticas de Retenção de Dados: Estabeleça uma política clara de retenção de dados com base em requisitos legais (como o princípio de limitação de armazenamento da GDPR) e nas necessidades dos negócios. Dados anonimizados e agregados podem ser mantidos indefinidamente, mas as informações de identificação pessoal (PII) devem ser automaticamente eliminadas ou anonimizadas após um período definido (por exemplo, 24 meses).
Solução de Problemas e Mitigação de Riscos
- Problema: Contagens Imprecisas de Visitantes: Isso geralmente se deve à randomização de MAC. Certifique-se de que sua plataforma tenha um recurso específico para lidar com isso. Se as contagens ainda parecerem altas, investigue se dispositivos de funcionários ou estáticos estão sendo incluídos nos dados.
- Problema: Baixa Precisão de Localização: Isso quase sempre aponta para densidade insuficiente de APs ou posicionamento subótimo. Realize um site survey para identificar lacunas de cobertura e áreas onde um dispositivo só pode ser 'visto' por um ou dois APs.
- Risco: Falha de Conformidade com GDPR/CCPA: O maior risco é um processo de consentimento mal configurado. Audite regularmente o fluxo de trabalho do seu Captive Portal para garantir que ele atenda aos padrões mais recentes de consentimento explícito e informado. Certifique-se de que o fornecedor da sua plataforma possa fornecer um Adendo de Processamento de Dados (DPA) que os comprometa com o manuseio de dados em conformidade. [3]
- Risco: Violação de Segurança de Dados: A conexão entre sua rede e a nuvem de analytics deve ser segura. Verifique se os dados são criptografados em trânsito (usando TLS 1.2 ou superior) e em repouso. Sua plataforma também deve suportar controle de acesso baseado em funções (RBAC) para garantir que os usuários só possam ver os dados relevantes para suas funções.
ROI e Impacto nos Negócios
Medir o retorno sobre o investimento de uma plataforma de WiFi analytics envolve rastrear melhorias nas principais métricas operacionais.
- Varejo: Correlacione o tempo de permanência em departamentos específicos com os dados de vendas do seu POS. Um aumento de 10% no tempo de permanência no departamento de eletrônicos que se correlaciona com um aumento de 2% nas vendas dessa categoria fornece um ROI claro. Use dados de fluxo de pessoas para realizar testes A/B em layouts de lojas e medir o impacto no fluxo de visitantes e na descoberta de produtos.
- Hospitalidade: Otimize a equipe em saguões, bares e restaurantes com base em dados de ocupação históricos e em tempo real. Um hotel pode evitar o excesso de funcionários durante períodos de calmaria e prevenir a degradação do serviço durante picos inesperados, levando a economias diretas na folha de pagamento e à melhoria da satisfação dos hóspedes.
- Centros de Conferências: Forneça aos patrocinadores dados verificáveis sobre o fluxo de pessoas e o tempo de permanência em torno de seus estandes, criando um novo fluxo de receita. Use dados de sessão de salas de apoio (breakout rooms) para informar a programação de eventos futuros, focando em tópicos que geram o maior engajamento.
[1] IEEE Standards Association. (2020). IEEE 802.11-2020 - IEEE Standard for Information Technology. https://standards.ieee.org/standard/802_11-2020.html [2] General Data Protection Regulation (GDPR). (2018). Regulation (EU) 2016/679 of the European Parliament and of the Council. https://gdpr-info.eu/ [3] Information Commissioner's Office (ICO). (2021). Guide to the General Data Protection Regulation (GDPR). https://ico.org.uk/for-organisations/guide-to-data-protection/guide-to-the-general-data-protection-regulation-gdpr/
Termos-Chave e Definições
Guest WiFi Analytics
The process of capturing, analysing, and interpreting data from guest WiFi networks to understand visitor behaviour in a physical space.
IT teams use this to transform the WiFi network from a cost centre into a source of business intelligence that informs operational decisions.
WiFi Footfall Tracking
The use of WiFi signals (specifically probe requests and session data) to measure the number of people entering a venue or specific zone and the paths they take.
Operations managers use this data to understand visitor journeys, identify bottlenecks, and optimise venue layouts without needing separate people-counting hardware.
Dwell Time
The total amount of time a visitor's device is detected within a venue or a specific predefined zone during a single visit.
This is a primary KPI for engagement. In retail, longer dwell time often correlates with higher spend. In hospitality, it helps measure the utilisation of amenities like bars and lounges.
MAC Address
A unique hardware identifier assigned to a device's network interface. It is the primary identifier used to track a device, even before it connects to a network.
While essential for tracking, IT teams must be aware of MAC randomisation and ensure their analytics platform can account for it to avoid inaccurate visitor counts.
RSSI (Received Signal Strength Indicator)
A measurement of the power present in a radio signal received by an access point from a device. The stronger the signal, the closer the device is assumed to be.
This is the core data point used for location triangulation. Network architects need to ensure sufficient AP density for reliable RSSI readings from multiple points.
Captive Portal
A web page that a user must view and interact with before being granted access to a public WiFi network.
For IT and marketing, this is the strategic point for enforcing terms, gaining GDPR-compliant consent for data collection, and capturing first-party data like email addresses.
MAC Randomisation
A privacy feature in modern operating systems (iOS, Android) that periodically changes the MAC address a device uses for WiFi scanning to prevent passive tracking.
This is the single biggest technical challenge for accurate footfall counting. A key task for network architects is to select an analytics platform that has a proven mechanism for mitigating its effects.
Zone Analytics
The analysis of visitor behaviour within predefined virtual areas (zones) of a venue, such as movement between zones and dwell time per zone.
Venue operators use this to get granular insights. Instead of just knowing total visitors, they can compare the performance of 'Aisle 1' vs. 'Aisle 2' or see how many lobby visitors proceed to the restaurant.
Estudos de Caso
A 200-room hotel wants to reduce lobby congestion during the peak check-in window (3-5 PM) and improve the guest experience.
- Deploy WiFi Analytics: Ensure AP density in the lobby, entrance, and bar areas meets the 3-AP visibility rule. Define zones for 'Check-in Queue', 'Lobby Seating', and 'Bar Entrance'. 2. Data Collection (1 Week): Collect baseline data on visitor flow and dwell times during the 3-5 PM window. 3. Analysis: The analytics reveal that dwell time in the 'Check-in Queue' zone peaks at 15 minutes, and footfall from the entrance flows directly to the queue, bypassing the lobby bar. 4. Intervention: The hotel implements a mobile check-in station in the 'Lobby Seating' area and updates the captive portal to promote a 'skip the queue' message with a link to the hotel app. 5. Measure & Iterate: Post-intervention data shows queue dwell time has dropped to 8 minutes, and footfall to the bar area from the entrance has increased by 20%.
A retail chain is redesigning its flagship store and wants to validate that the new layout improves product discovery and customer engagement.
- Baseline Analysis: Before the redesign, use WiFi analytics to map the most common customer journeys and generate a footfall heatmap. Identify which zones have the highest and lowest dwell times. 2. Post-Redesign Analysis: After the new layout is implemented, conduct the same analysis. 3. Comparative Reporting: Compare the before-and-after heatmaps and journey flows. The new layout is successful if: (a) footfall is more evenly distributed, indicating better discovery; (b) dwell time has increased in high-margin product zones; and (c) the percentage of visitors who only visit the entrance zone (bouncing) has decreased. 4. POS Integration: Correlate the increase in dwell time in a specific zone (e.g., 'Premium Denim') with sales data for that category to calculate the direct revenue impact of the layout change.
Análise de Cenário
Q1. A large conference is experiencing complaints about overcrowding in the corridors between sessions. How would you use WiFi analytics to diagnose the problem and propose a data-driven solution?
💡 Dica:Think about using time-series data for specific zones and correlating it with the event schedule.
Mostrar Abordagem Recomendada
First, define the corridor areas as distinct zones in the analytics platform. Then, analyse the footfall and device density metrics for these zones, specifically in the 15-minute windows before and after major keynote sessions. This will quantify the congestion peaks. The solution would be to present this data to the event organisers and recommend staggering the session end times by 10-15 minutes for adjacent large halls to smooth out the flow of attendees. The success of this change can be measured by a reduction in peak device density in the corridor zones during the next event.
Q2. A retail store's marketing team wants to prove the ROI of a new in-store digital signage campaign. How can they use guest WiFi analytics to measure the campaign's impact on footfall and dwell time?
💡 Dica:The key is to isolate the variable. You need to compare behaviour in the target zone before and during the campaign.
Mostrar Abordagem Recomendada
Define a zone around the new digital signage. Establish a baseline by measuring the average dwell time and the percentage of total store visitors who enter that zone for a two-week period before the campaign starts. Once the campaign is active, continue to measure the same metrics. The ROI can be demonstrated by showing a statistically significant increase in either dwell time within the zone (people are stopping to watch) or the capture rate of the zone (more people are being drawn to the area). For a more advanced analysis, integrate with POS data to see if the increased engagement correlates with a sales lift for the promoted products.
Q3. A hotel manager has noticed a 15% drop in bar revenue over the last quarter but overall visitor numbers are stable. How could they use WiFi analytics to investigate potential causes related to visitor behaviour?
💡 Dica:This requires looking at visitor journeys and flow patterns, not just isolated zone data.
Mostrar Abordagem Recomendada
The investigation should focus on visitor journey analysis. Define zones for the lobby, reception, lifts, and the bar. Use the platform's flow analysis tools to answer two questions: 1. What percentage of visitors who enter the lobby also enter the bar zone? Is this percentage trending down over the last quarter? 2. Of the visitors who do enter the bar, is their average dwell time decreasing? A drop in the lobby-to-bar conversion rate might suggest an issue with signage or visibility. A decrease in dwell time for those who do enter the bar might suggest a problem with service, atmosphere, or offerings. The data pinpoints whether the problem is attracting guests or retaining them.
Principais Conclusões
- ✓Your guest WiFi is a powerful sensor network capable of generating deep business intelligence.
- ✓WiFi analytics captures both passive (probe requests) and active (connected sessions) data to build a complete picture of visitor behaviour.
- ✓Accurate footfall and dwell time analysis depends on strategic AP placement with sufficient density for triangulation (the '3-AP rule').
- ✓MAC randomisation is a critical technical challenge; your analytics platform must have a robust mechanism to handle it for accurate counting.
- ✓The captive portal is your gateway for gaining GDPR-compliant consent and enriching anonymous data with valuable first-party demographic information.
- ✓The highest ROI comes from integrating WiFi analytics data into core operational workflows for staffing, marketing, and space utilisation.
- ✓Compliance is non-negotiable. Your consent workflow must be explicit, and your data handling must adhere to GDPR/CCPA principles.
