Comment le WiFi invité optimise l'analyse des sites et le suivi de la fréquentation
This guide provides a technical and operational framework for leveraging guest WiFi to gain deep insights into visitor behaviour within physical venues. It details how to capture and analyse data for footfall tracking and dwell time calculation, enabling IT and operations leaders to make data-driven decisions that optimize staffing, enhance venue layout, and increase business ROI.
🎧 Écouter ce guide
Voir la transcription
Synthèse
Pour les exploitants de sites et les responsables informatiques, le WiFi invité n'est plus une simple commodité ; c'est une source essentielle de Business Intelligence. Au-delà de l'accès à Internet, une infrastructure WiFi moderne capture un flux riche de données qui révèle comment les visiteurs se déplacent et interagissent avec un espace physique. Ce guide fournit un cadre technique et opérationnel pour comprendre comment exploiter le WiFi invité pour une analyse avancée des sites, en se concentrant spécifiquement sur le suivi de la fréquentation, le calcul du temps de séjour et l'analyse du comportement des visiteurs. En transformant les données WiFi brutes en informations exploitables, les entreprises peuvent optimiser leurs effectifs, améliorer l'agencement des lieux, augmenter le ROI marketing et enrichir l'expérience globale des visiteurs. Ce document de référence est conçu pour les responsables informatiques, les architectes réseau et les directeurs des opérations qui doivent déployer, gérer et tirer parti de leur plateforme d'intelligence WiFi. Il couvre la technologie sous-jacente, les meilleures pratiques de mise en œuvre, les considérations de conformité au GDPR et les méthodes de mesure de l'impact commercial, passant des concepts théoriques à des conseils de déploiement pratiques.
Analyse technique approfondie
Comprendre le fonctionnement de l'analyse WiFi nécessite d'examiner les données générées aux différentes étapes de l'interaction d'un appareil avec le réseau. Le processus commence avant même qu'un utilisateur ne s'authentifie, fournissant une couche fondamentale de données de présence et de mouvement.
Collecte de données passive : requêtes Probe
Chaque appareil compatible WiFi (smartphone, tablette, ordinateur portable) diffuse périodiquement des « requêtes Probe ». Il s'agit de petits paquets de données envoyés par l'appareil pour découvrir les réseaux WiFi à proximité. Fait crucial, chaque requête Probe contient l'adresse MAC (Media Access Control) unique de l'appareil. Même si un appareil ne se connecte jamais au réseau, les points d'accès (AP) du site peuvent détecter et enregistrer ces requêtes.
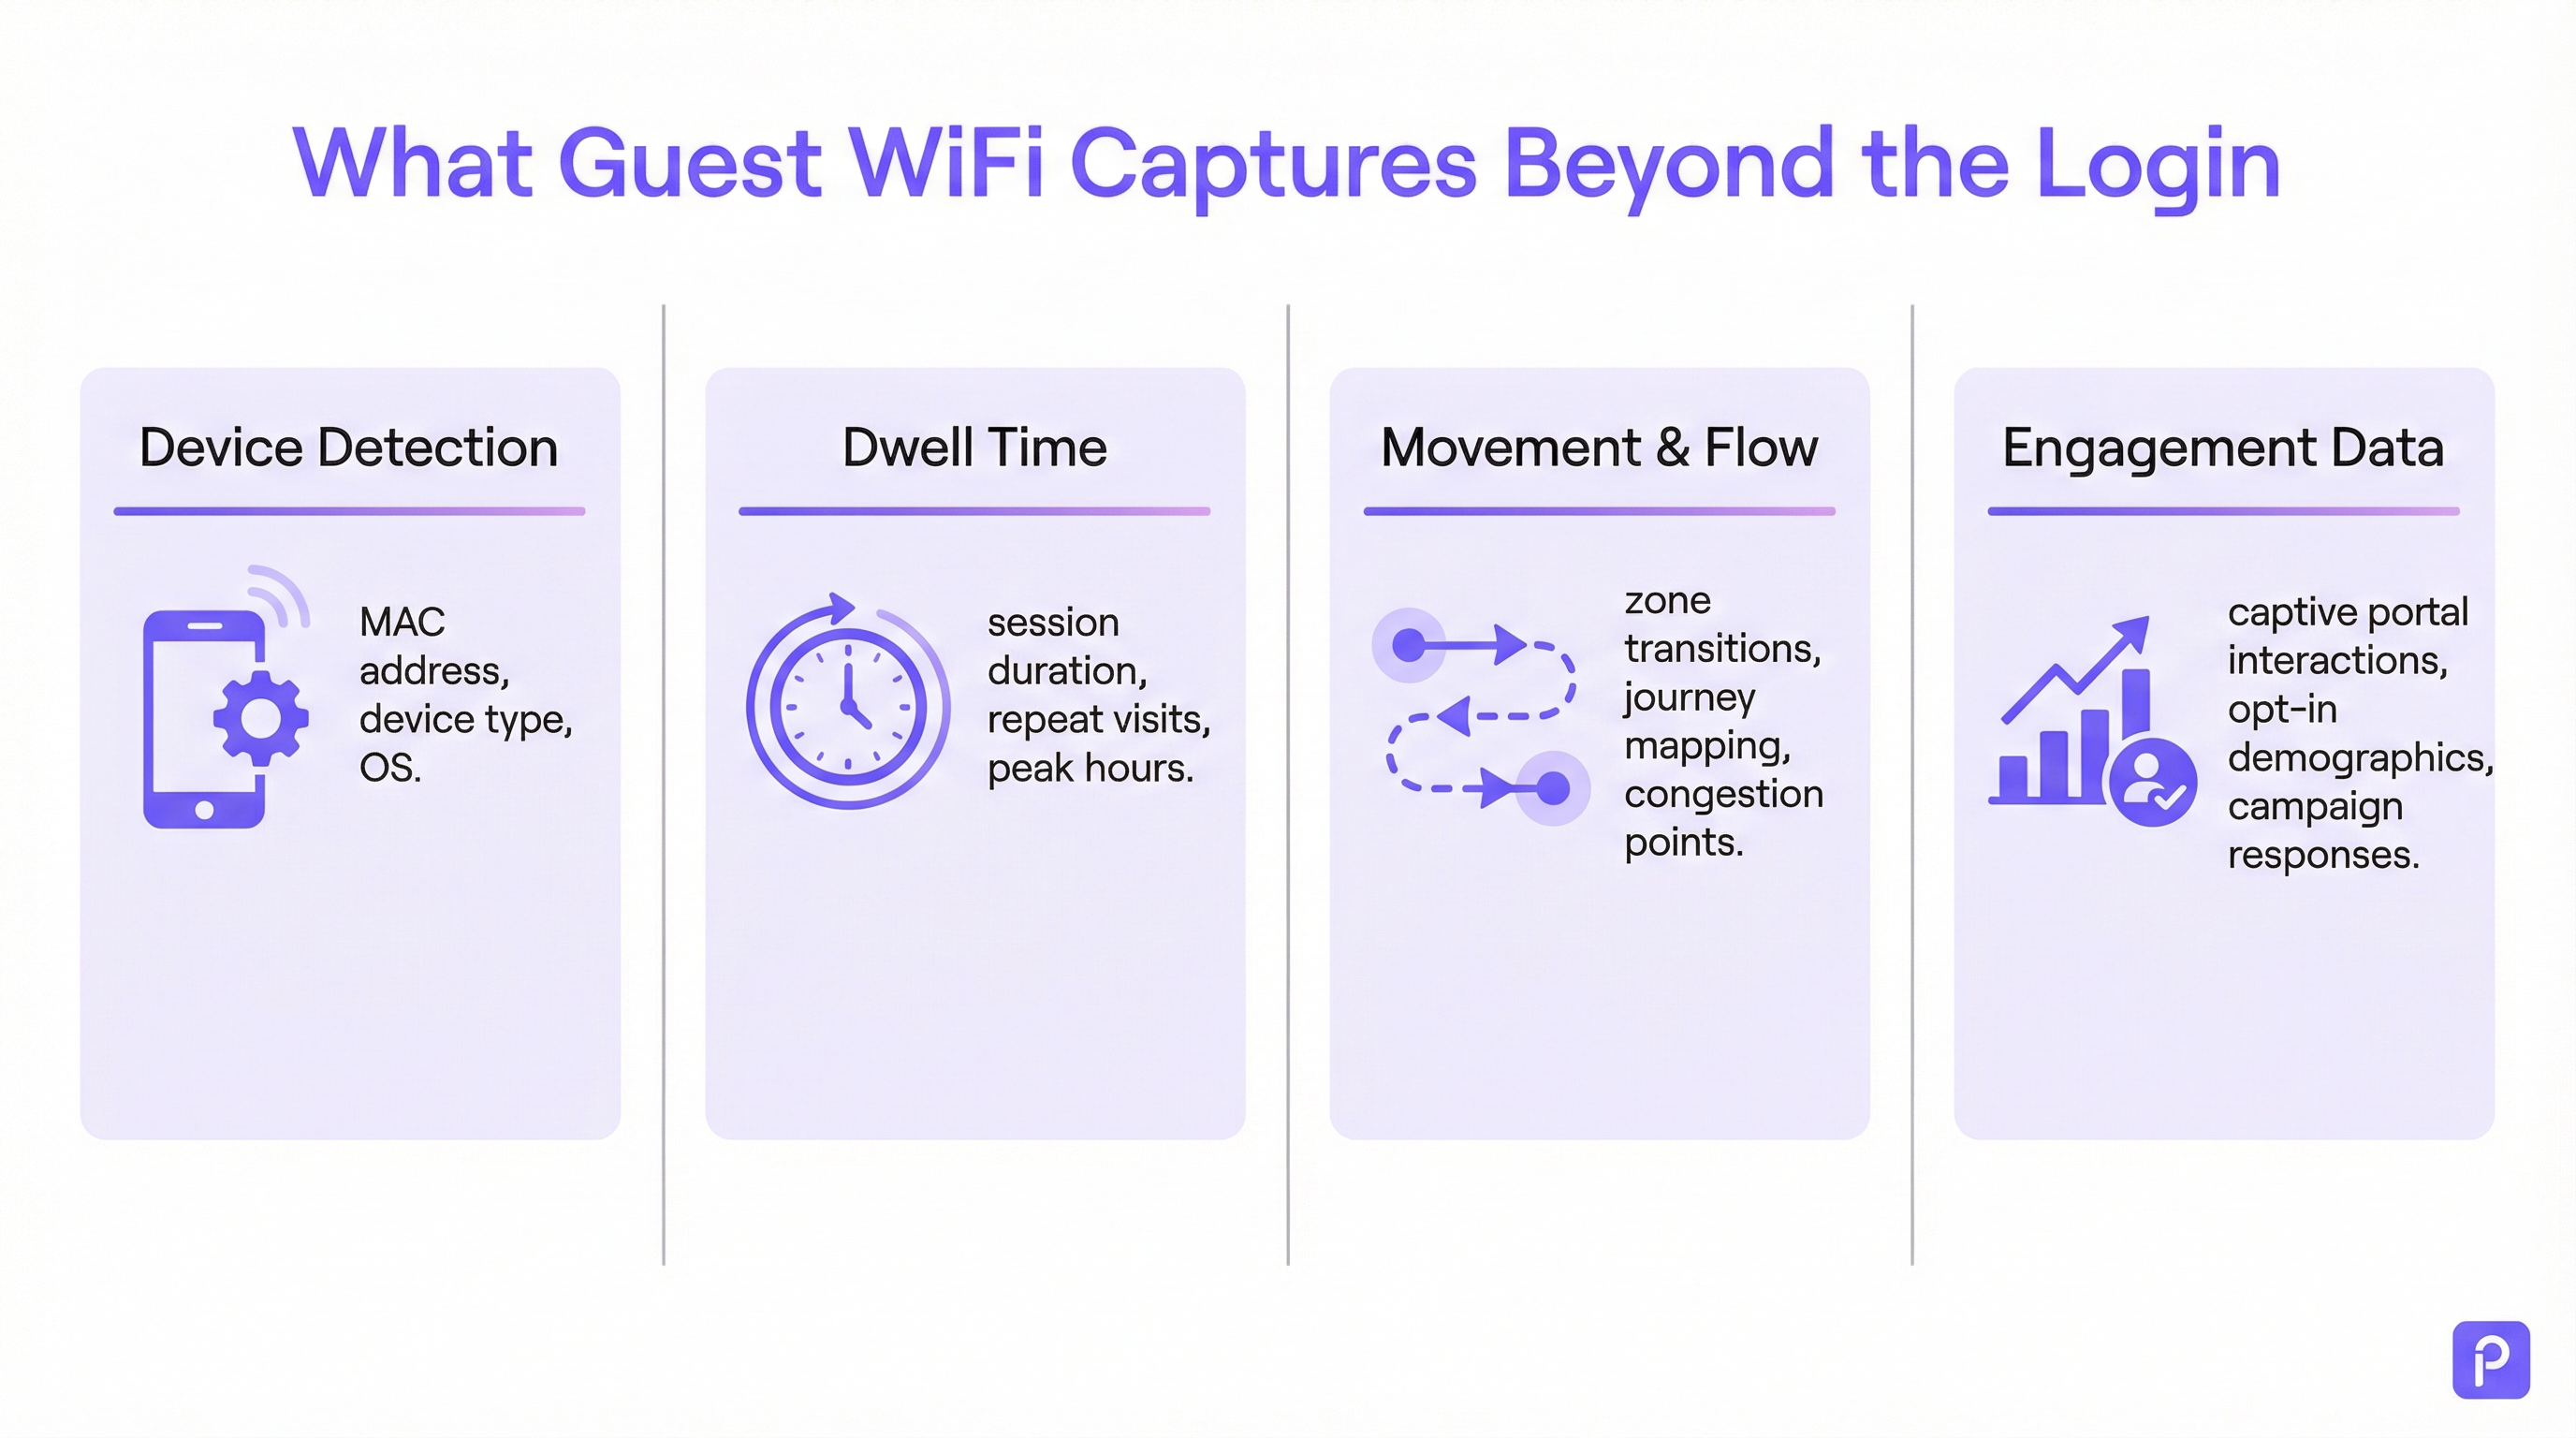
- Ce qui est capturé : l'adresse MAC, l'indicateur de force du signal reçu (RSSI) et l'horodatage de la détection.
- Comment c'est utilisé : en triangulant le RSSI de plusieurs points d'accès, le système peut estimer l'emplacement de l'appareil. Un flux continu de ces détections permet à la plateforme de tracer le parcours d'un appareil à travers le site. Cela constitue la base de l'analyse de la fréquentation pour tous les appareils compatibles WiFi à portée, et pas seulement ceux connectés au réseau.
- Le défi de la randomisation MAC : depuis iOS 14 et Android 10, les appareils utilisent fréquemment une adresse MAC aléatoire ou privée pour les requêtes Probe afin de protéger la vie privée des utilisateurs. Cela peut conduire à ce qu'un seul appareil soit compté plusieurs fois. Les plateformes d'analyse d'entreprise utilisent des algorithmes sophistiqués pour dédupliquer ces adresses aléatoires, en utilisant d'autres caractéristiques de signal et une analyse temporelle pour reconstituer le parcours probable d'un appareil unique. [1]
Collecte de données active : sessions connectées
Lorsqu'un visiteur se connecte activement au WiFi invité, généralement via un Captive Portal, un ensemble de données beaucoup plus riche devient disponible. Le processus d'authentification crée une session formelle avec un début et une fin définis.
- Calcul du temps de séjour : la métrique la plus fondamentale dérivée d'une session connectée est le temps de séjour (dwell time). Il est calculé comme la différence de temps entre le début de la session (authentification) et la fin de la session (déconnexion ou expiration). Une plateforme robuste ira plus loin, en fusionnant plusieurs sessions courtes du même appareil dans une fenêtre de temps donnée en une seule « visite », offrant ainsi une image plus précise du temps total passé sur le site.
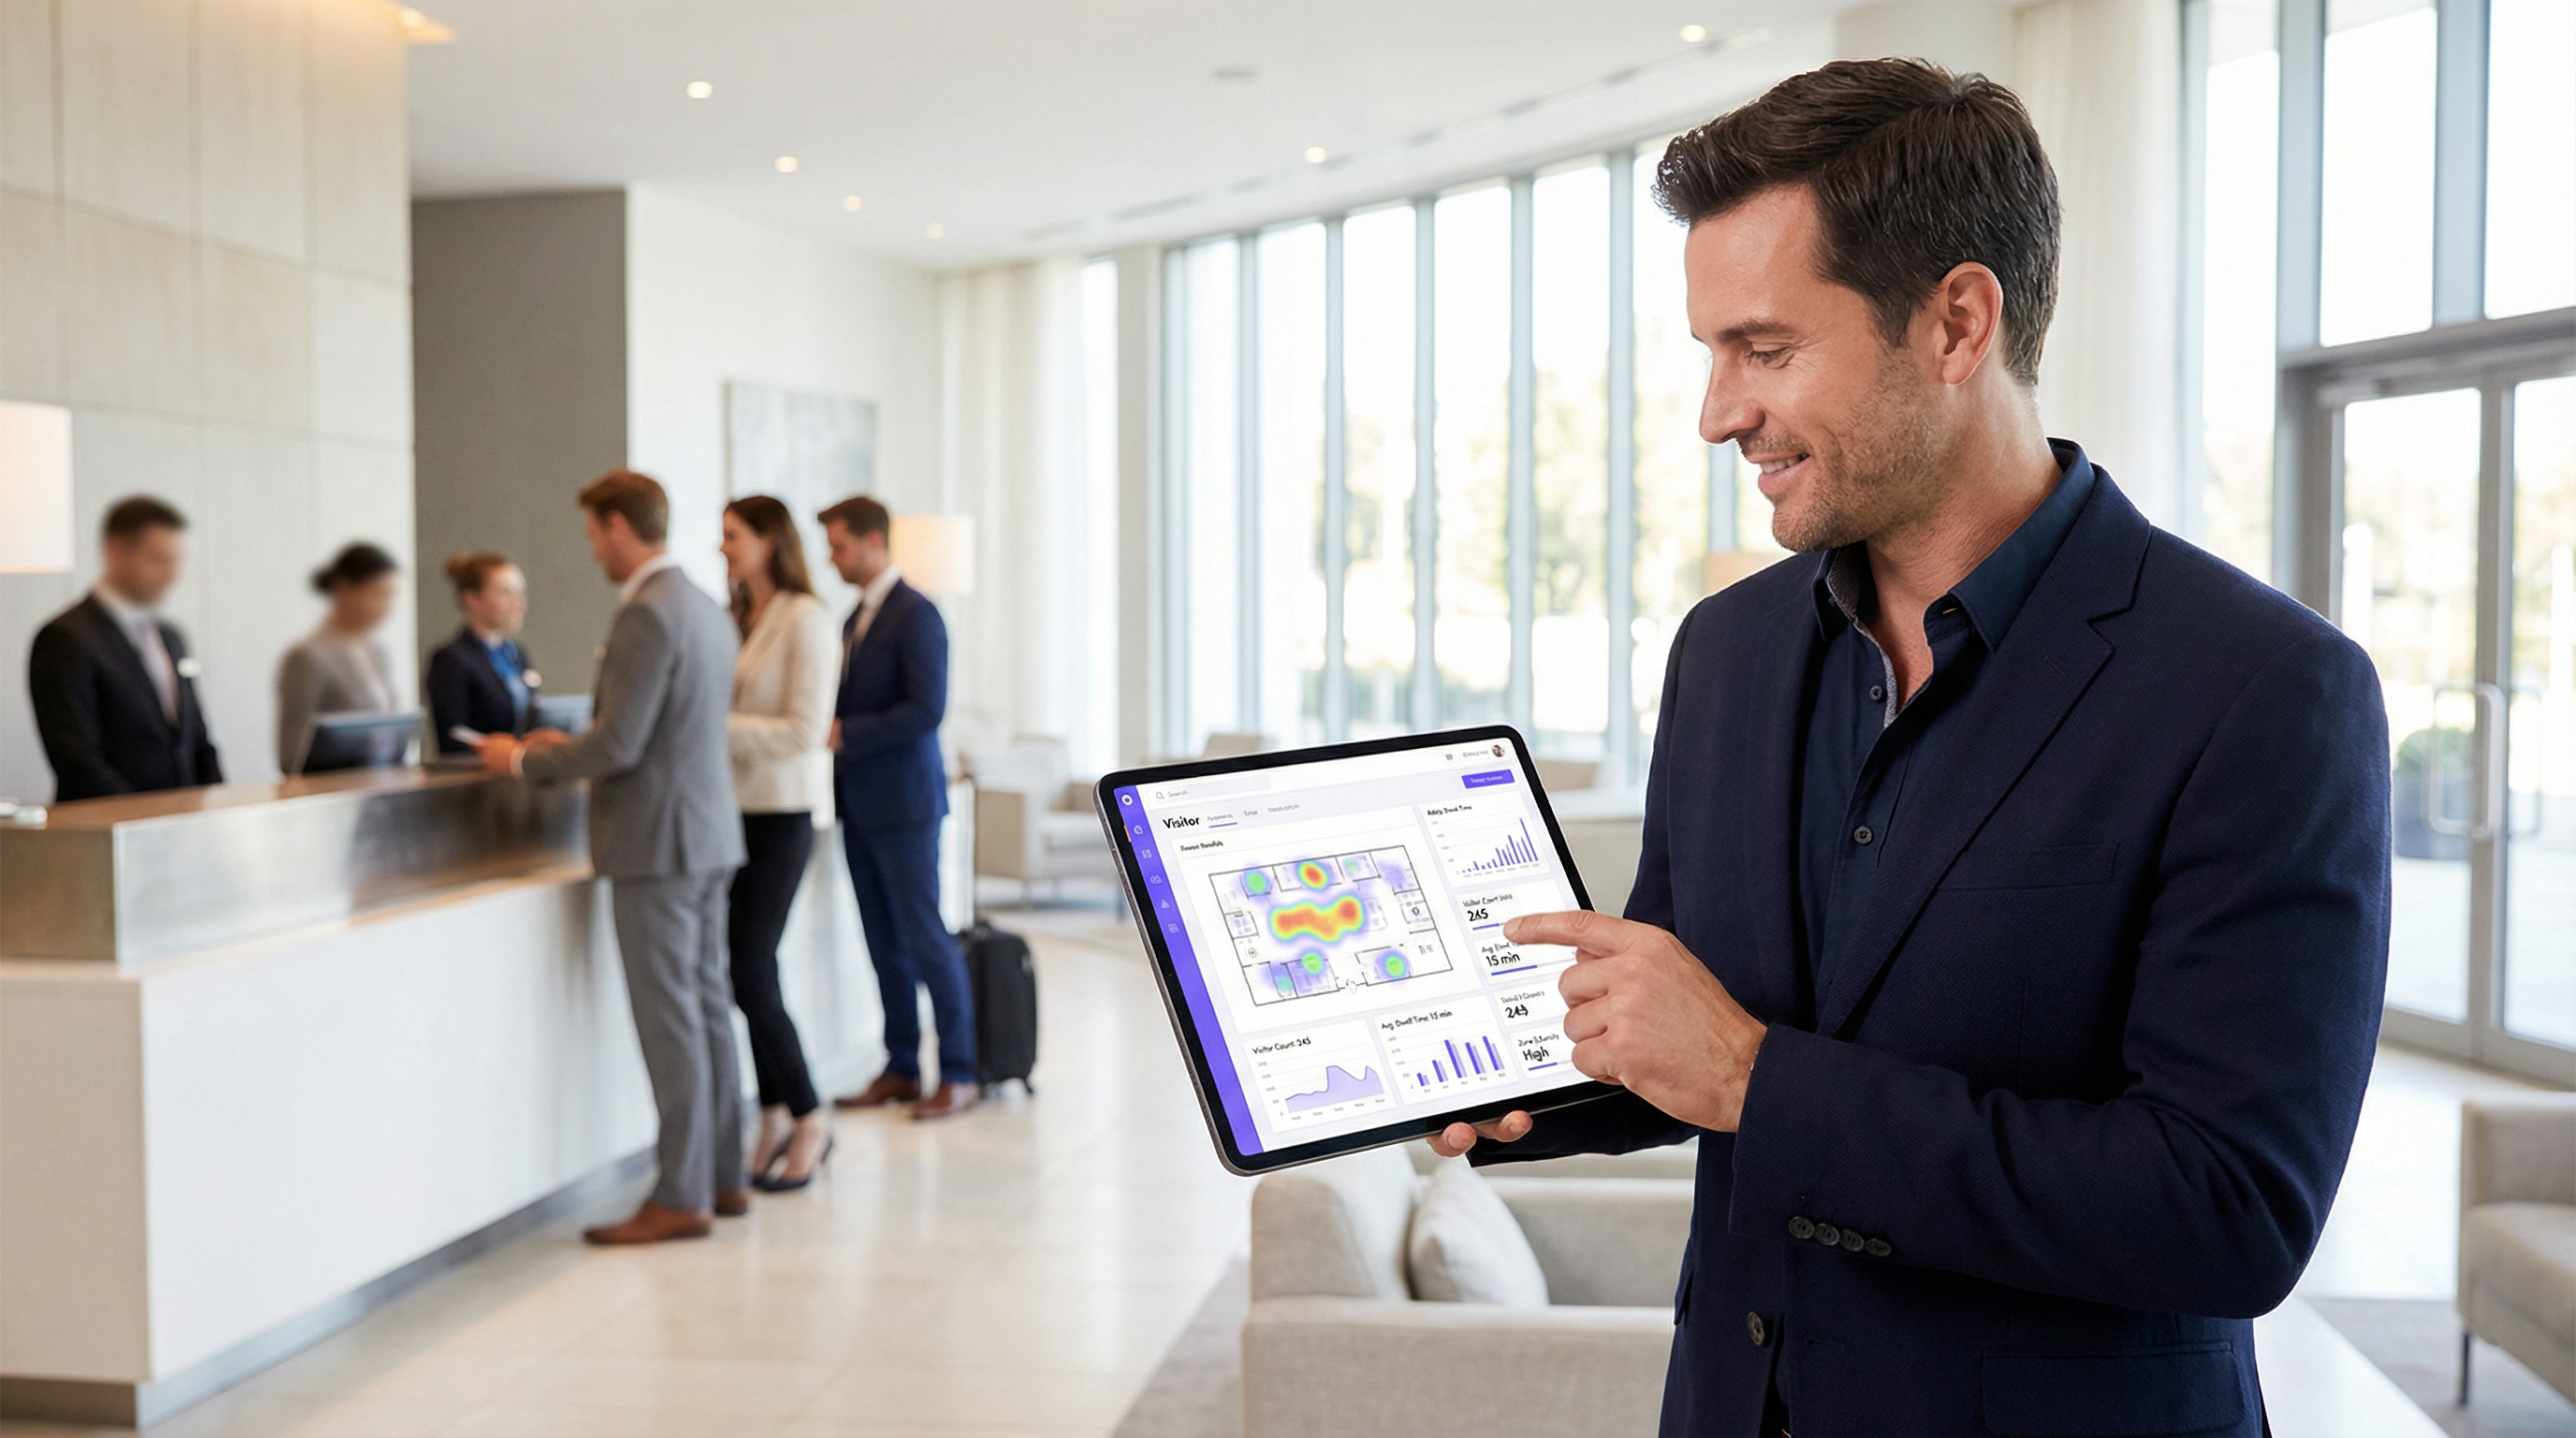
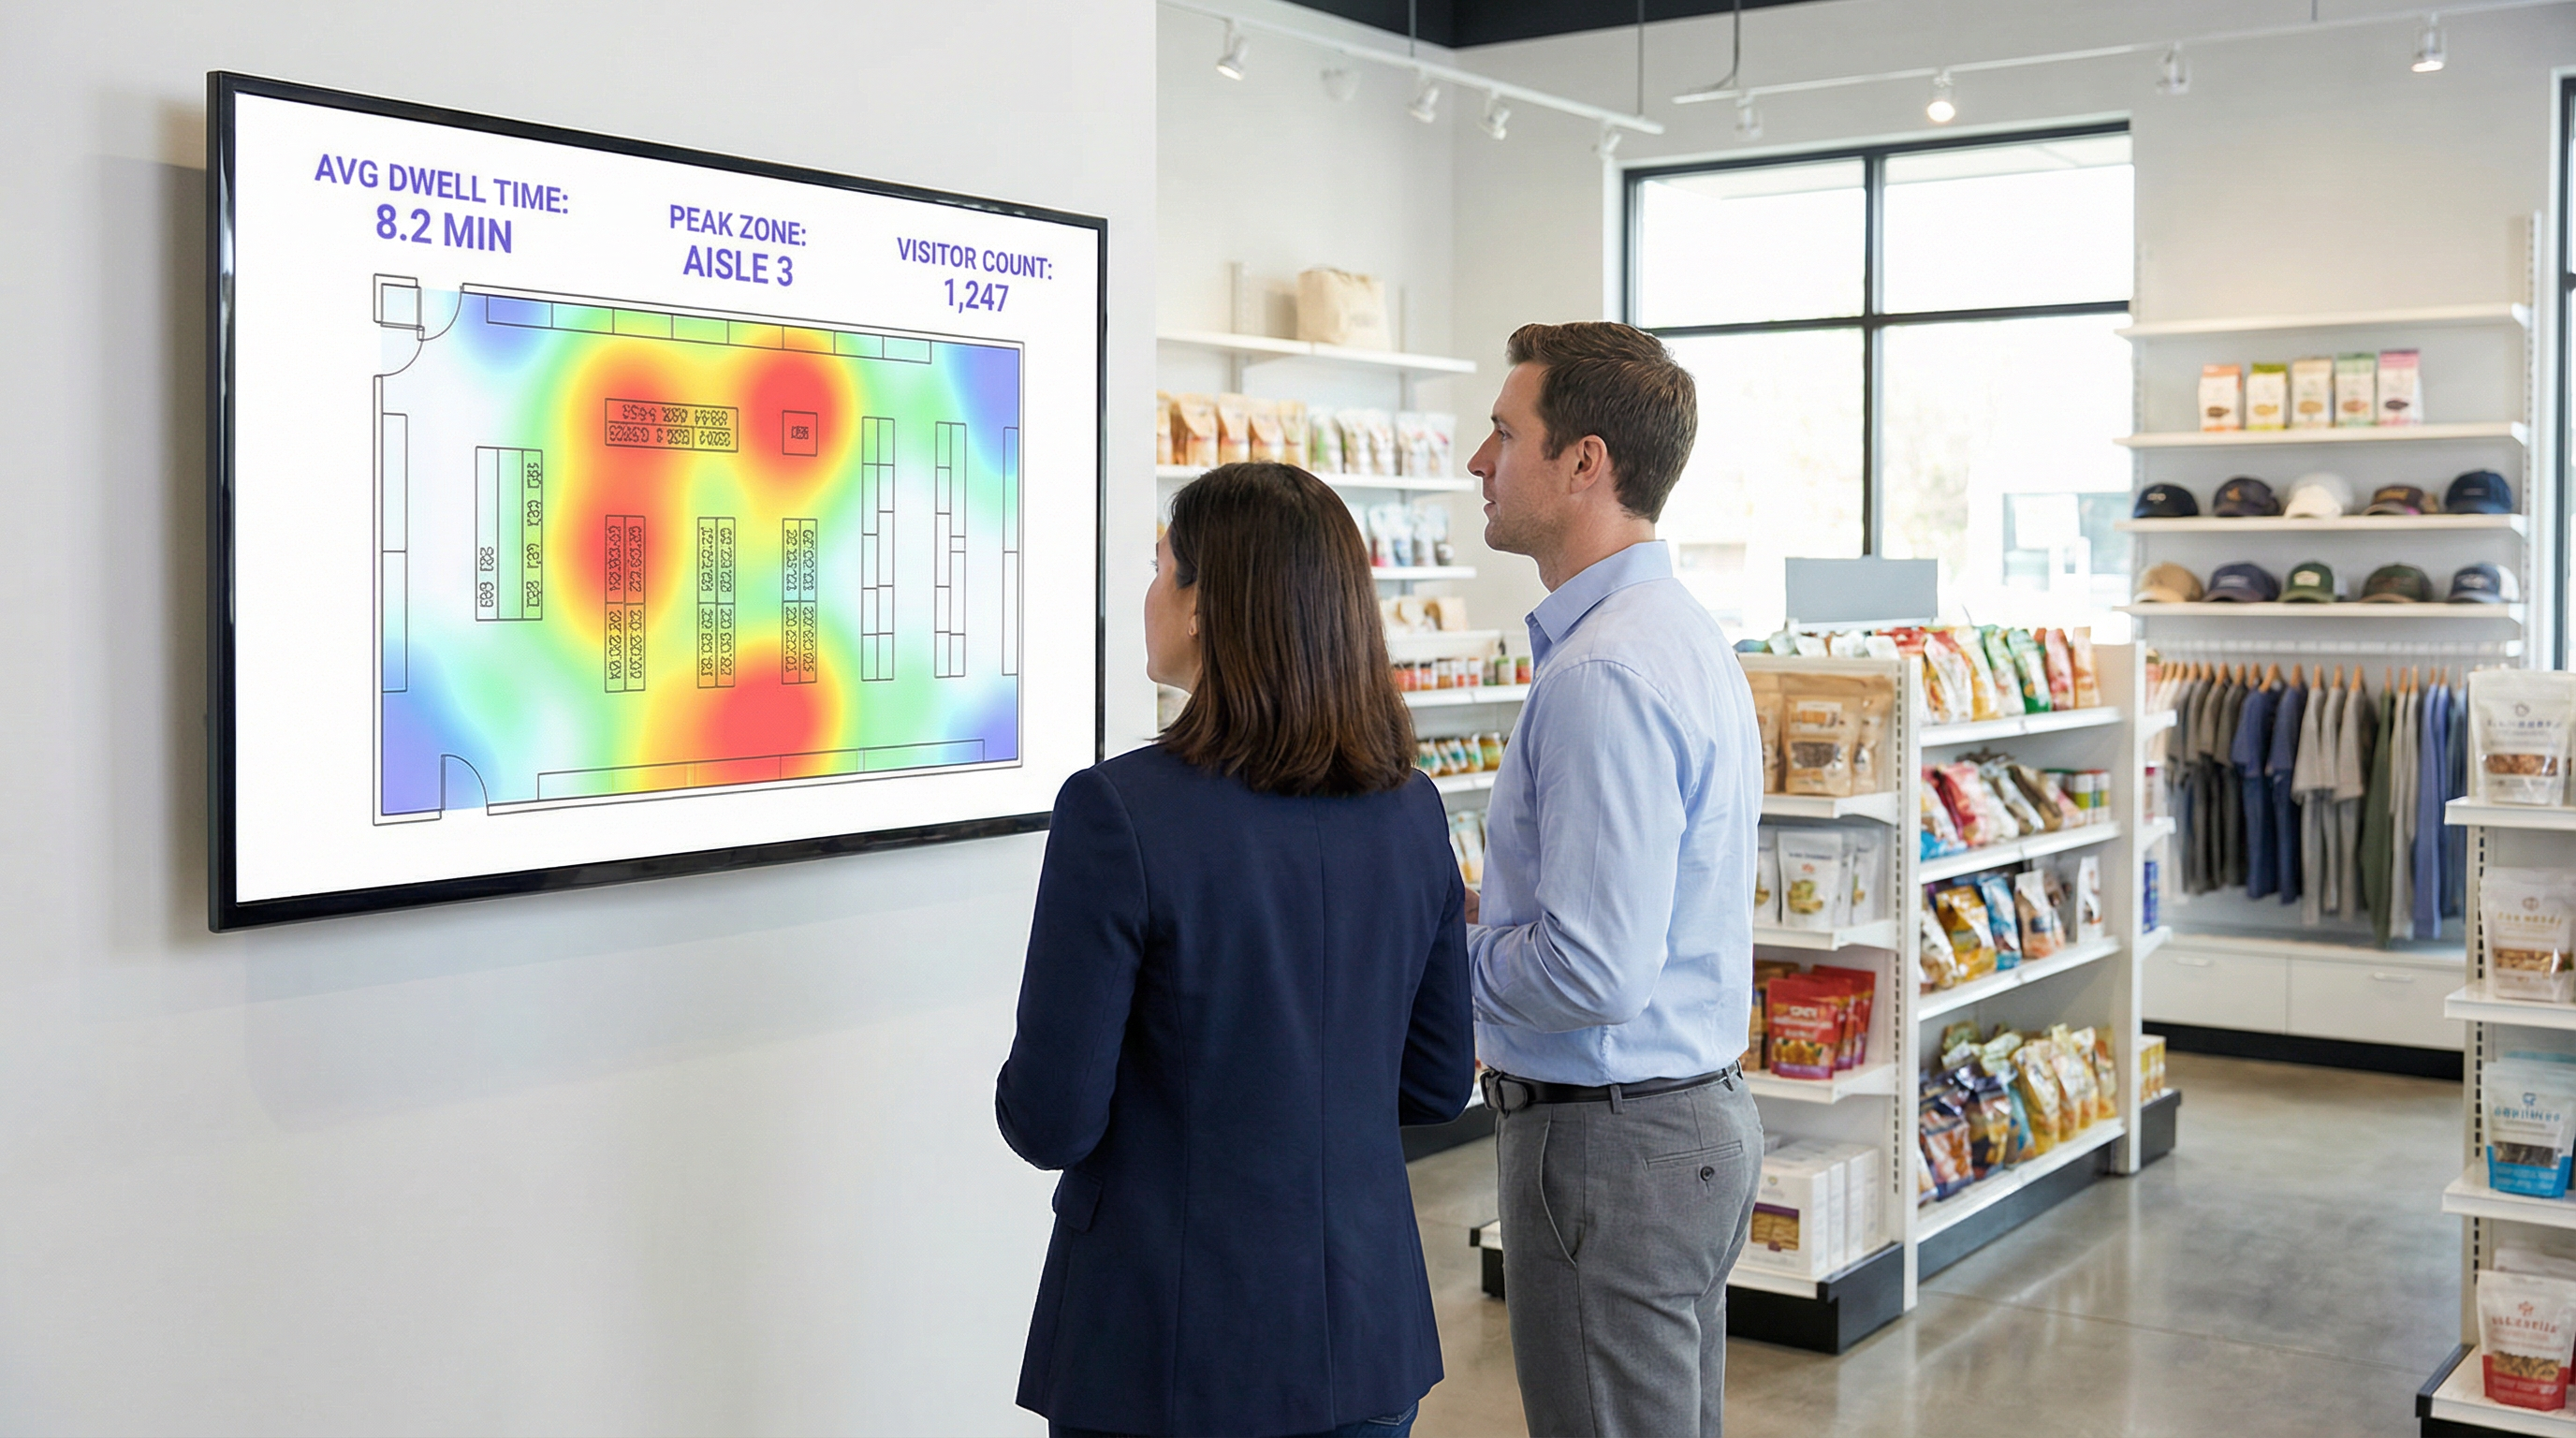
- Analyse de l'emplacement et des zones : une fois connecté, l'emplacement de l'appareil peut être suivi avec une plus grande précision. La plateforme surveille en permanence le RSSI des points d'accès avec lesquels l'appareil communique. Cela permet une analyse détaillée par zone : combien de personnes se trouvent dans le hall par rapport au café, combien de temps elles restent dans chaque zone, et le flux de trafic entre les zones. Ce sont ces données qui alimentent les cartes de chaleur (heatmaps) en temps réel et l'analyse des parcours.
- Enrichissement des données First-Party : le Captive Portal est un atout stratégique essentiel. En proposant une authentification via les réseaux sociaux (par ex. Facebook, LinkedIn), par e-mail ou via un simple formulaire, le site peut, avec le consentement explicite de l'utilisateur, lier l'adresse MAC anonyme à une identité réelle ou à un profil démographique. Cela transforme les données de comptage de fréquentation anonymes en données clients First-Party riches, utilisables pour le marketing personnalisé et l'intégration CRM, en totale conformité avec les normes telles que le GDPR. [2]
Guide de mise en œuvre
Le succès du déploiement de l'analyse WiFi repose tout autant sur la conception physique du réseau et la stratégie de données que sur la configuration logicielle.
Étape 1 : Audit de placement et de densité des points d'accès (AP)
La disposition actuelle de vos points d'accès peut être optimisée pour la couverture, et non pour l'analyse. Pour un suivi précis de l'emplacement, une plus grande densité de points d'accès est requise afin de permettre une triangulation efficace.
- Conception axée sur la couverture : les points d'accès sont placés pour maximiser la portée du signal, ce qui entraîne souvent un chevauchement minimal entre les zones de couverture des AP.
- Conception prête pour l'analyse : les points d'accès sont placés de manière à créer un chevauchement significatif. Un appareil situé à un endroit donné doit pouvoir être détecté par au moins trois points d'accès pour un calcul d'emplacement fiable. Une bonne pratique générale consiste à viser un point d'accès pour 150 à 200 mètres carrés dans les espaces ouverts.
Étape 2 : Configuration de l'ingestion des données
La plateforme d'analyse doit recevoir les données de votre contrôleur réseau ou directement des points d'accès. Cela implique généralement de configurer le réseau pour transférer les données syslog ou les traps SNMP contenant les requêtes Probe et les informations de session pertinentes vers le point de terminaison cloud d'analyse. Assurez-vous que les règles de votre pare-feu autorisent ce trafic sortant.
Étape 3 : Définition des zones et des plans d'étage
Téléchargez les plans de votre site dans la plateforme d'analyse. Ensuite, à l'aide des outils fournis, dessinez des « zones » polygonales sur la carte correspondant à des zones opérationnelles distinctes (par ex. « Entrée principale », « Allée 3 », « Espace bar », « Salle de réunion 1 »). Il s'agit de l'étape de configuration la plus critique pour générer des rapports pertinents et spécifiques au contexte.
Étape 4 : Conception du Captive Portal et du flux de consentement
Concevez votre Captive Portal non seulement comme une passerelle de connexion, mais aussi comme un outil de gouvernance des données. En collaboration avec vos équipes juridiques et marketing :
- Rédigez un avis de confidentialité clair : expliquez en termes simples quelles données sont collectées (adresse MAC, emplacement, temps de session) et dans quel but (pour améliorer les opérations du site, pour le marketing).
- Mettez en place un consentement granulaire : fournissez des cases à cocher distinctes et explicites pour (a) accepter les conditions d'accès au réseau, et (b) consentir à la collecte de données à des fins d'analyse et de marketing. Il s'agit d'une exigence fondamentale pour la conformité au GDPR.
- Proposez un échange de valeur : augmentez les taux d'adhésion (opt-in) en offrant une incitation au partage des données, comme un bon de réduction ou l'accès à du contenu premium.
Meilleures pratiques
- Filtrez le personnel et les appareils statiques : assurez-vous de disposer d'un processus pour exclure les adresses MAC des appareils du personnel et des équipements fixes (comme les téléviseurs intelligents ou les terminaux de paiement) de vos analyses. La plupart des plateformes vous permettent de télécharger une liste d'adresses MAC à ignorer, évitant ainsi que vos propres opérations ne faussent les données des visiteurs.
- Intégrez à d'autres systèmes : la véritable puissance de l'analyse WiFi se révèle lorsqu'elle est combinée à d'autres sources de données. L'intégration aux systèmes de point de vente (POS) vous permet de corréler le temps de séjour avec les dépenses. L'intégration à votre CRM vous permet de lier l'historique des visites aux profils clients. Privilégiez les plateformes dotées d'API REST robustes et bien documentées.
- Respectez les politiques de conservation des données : établissez une politique claire de conservation des données basée sur les exigences légales (comme le principe de limitation de conservation du GDPR) et les besoins de l'entreprise. Les données anonymisées et agrégées peuvent être conservées indéfiniment, mais les informations personnellement identifiables (PII) doivent être automatiquement purgées ou anonymisées après une période définie (par ex. 24 mois).
Dépannage et atténuation des risques
- Problème : comptage inexact des visiteurs : cela est souvent dû à la randomisation MAC. Assurez-vous que votre plateforme dispose d'une fonctionnalité spécifique pour y remédier. Si les chiffres semblent toujours élevés, vérifiez si le personnel ou les appareils statiques sont inclus dans les données.
- Problème : mauvaise précision de l'emplacement : cela indique presque toujours une densité de points d'accès insuffisante ou un placement sous-optimal. Effectuez une étude de site pour identifier les lacunes de couverture et les zones où un appareil ne peut être « vu » que par un ou deux points d'accès.
- Risque : non-conformité au GDPR/CCPA : le risque le plus important est un processus de consentement mal configuré. Auditez régulièrement le flux de votre Captive Portal pour vous assurer qu'il répond aux dernières normes en matière de consentement explicite et éclairé. Assurez-vous que le fournisseur de votre plateforme peut fournir un addenda sur le traitement des données (DPA) qui l'engage à traiter les données de manière conforme. [3]
- Risque : violation de la sécurité des données : la connexion entre votre réseau et le cloud d'analyse doit être sécurisée. Vérifiez que les données sont chiffrées en transit (à l'aide de TLS 1.2 ou supérieur) et au repos. Votre plateforme doit également prendre en charge le contrôle d'accès basé sur les rôles (RBAC) pour garantir que les utilisateurs ne peuvent voir que les données pertinentes pour leurs fonctions.
ROI et impact commercial
Mesurer le retour sur investissement d'une plateforme d'analyse WiFi implique de suivre l'amélioration des métriques opérationnelles clés.
- Retail (Commerce de détail) : correlez le temps de séjour dans des rayons spécifiques avec les données de vente de votre POS. Une augmentation de 10 % du temps de séjour dans le rayon électronique qui correspond à une augmentation de 2 % des ventes pour cette catégorie offre un ROI clair. Utilisez les données de fréquentation pour effectuer des tests A/B sur l'agencement des magasins et mesurer l'impact sur le flux des visiteurs et la découverte des produits.
- Hôtellerie-restauration : optimisez les effectifs dans les halls, les bars et les restaurants en fonction des données d'occupation historiques et en temps réel. Un hôtel peut éviter le sureffectif pendant les périodes creuses et prévenir la dégradation du service lors de pics inattendus, ce qui entraîne des économies directes sur la masse salariale et une meilleure satisfaction des clients.
- Centres de conférence : fournissez aux sponsors des données vérifiables sur la fréquentation et le temps de séjour autour de leurs stands, créant ainsi une nouvelle source de revenus. Utilisez les données de session des salles de sous-commission pour orienter la programmation des futurs événements, en vous concentrant sur les sujets qui génèrent le plus d'engagement.
[1] IEEE Standards Association. (2020). IEEE 802.11-2020 - IEEE Standard for Information Technology. https://standards.ieee.org/standard/802_11-2020.html [2] Règlement général sur la protection des données (GDPR). (2018). Règlement (UE) 2016/679 du Parlement européen et du Conseil. https://gdpr-info.eu/ [3] Information Commissioner's Office (ICO). (2021). Guide to the General Data Protection Regulation (GDPR). https://ico.org.uk/for-organisations/guide-to-data-protection/guide-to-the-general-data-protection-regulation-gdpr/
Termes clés et définitions
Guest WiFi Analytics
The process of capturing, analysing, and interpreting data from guest WiFi networks to understand visitor behaviour in a physical space.
IT teams use this to transform the WiFi network from a cost centre into a source of business intelligence that informs operational decisions.
WiFi Footfall Tracking
The use of WiFi signals (specifically probe requests and session data) to measure the number of people entering a venue or specific zone and the paths they take.
Operations managers use this data to understand visitor journeys, identify bottlenecks, and optimise venue layouts without needing separate people-counting hardware.
Dwell Time
The total amount of time a visitor's device is detected within a venue or a specific predefined zone during a single visit.
This is a primary KPI for engagement. In retail, longer dwell time often correlates with higher spend. In hospitality, it helps measure the utilisation of amenities like bars and lounges.
MAC Address
A unique hardware identifier assigned to a device's network interface. It is the primary identifier used to track a device, even before it connects to a network.
While essential for tracking, IT teams must be aware of MAC randomisation and ensure their analytics platform can account for it to avoid inaccurate visitor counts.
RSSI (Received Signal Strength Indicator)
A measurement of the power present in a radio signal received by an access point from a device. The stronger the signal, the closer the device is assumed to be.
This is the core data point used for location triangulation. Network architects need to ensure sufficient AP density for reliable RSSI readings from multiple points.
Captive Portal
A web page that a user must view and interact with before being granted access to a public WiFi network.
For IT and marketing, this is the strategic point for enforcing terms, gaining GDPR-compliant consent for data collection, and capturing first-party data like email addresses.
MAC Randomisation
A privacy feature in modern operating systems (iOS, Android) that periodically changes the MAC address a device uses for WiFi scanning to prevent passive tracking.
This is the single biggest technical challenge for accurate footfall counting. A key task for network architects is to select an analytics platform that has a proven mechanism for mitigating its effects.
Zone Analytics
The analysis of visitor behaviour within predefined virtual areas (zones) of a venue, such as movement between zones and dwell time per zone.
Venue operators use this to get granular insights. Instead of just knowing total visitors, they can compare the performance of 'Aisle 1' vs. 'Aisle 2' or see how many lobby visitors proceed to the restaurant.
Études de cas
A 200-room hotel wants to reduce lobby congestion during the peak check-in window (3-5 PM) and improve the guest experience.
- Deploy WiFi Analytics: Ensure AP density in the lobby, entrance, and bar areas meets the 3-AP visibility rule. Define zones for 'Check-in Queue', 'Lobby Seating', and 'Bar Entrance'. 2. Data Collection (1 Week): Collect baseline data on visitor flow and dwell times during the 3-5 PM window. 3. Analysis: The analytics reveal that dwell time in the 'Check-in Queue' zone peaks at 15 minutes, and footfall from the entrance flows directly to the queue, bypassing the lobby bar. 4. Intervention: The hotel implements a mobile check-in station in the 'Lobby Seating' area and updates the captive portal to promote a 'skip the queue' message with a link to the hotel app. 5. Measure & Iterate: Post-intervention data shows queue dwell time has dropped to 8 minutes, and footfall to the bar area from the entrance has increased by 20%.
A retail chain is redesigning its flagship store and wants to validate that the new layout improves product discovery and customer engagement.
- Baseline Analysis: Before the redesign, use WiFi analytics to map the most common customer journeys and generate a footfall heatmap. Identify which zones have the highest and lowest dwell times. 2. Post-Redesign Analysis: After the new layout is implemented, conduct the same analysis. 3. Comparative Reporting: Compare the before-and-after heatmaps and journey flows. The new layout is successful if: (a) footfall is more evenly distributed, indicating better discovery; (b) dwell time has increased in high-margin product zones; and (c) the percentage of visitors who only visit the entrance zone (bouncing) has decreased. 4. POS Integration: Correlate the increase in dwell time in a specific zone (e.g., 'Premium Denim') with sales data for that category to calculate the direct revenue impact of the layout change.
Analyse de scénario
Q1. A large conference is experiencing complaints about overcrowding in the corridors between sessions. How would you use WiFi analytics to diagnose the problem and propose a data-driven solution?
💡 Astuce :Think about using time-series data for specific zones and correlating it with the event schedule.
Afficher l'approche recommandée
First, define the corridor areas as distinct zones in the analytics platform. Then, analyse the footfall and device density metrics for these zones, specifically in the 15-minute windows before and after major keynote sessions. This will quantify the congestion peaks. The solution would be to present this data to the event organisers and recommend staggering the session end times by 10-15 minutes for adjacent large halls to smooth out the flow of attendees. The success of this change can be measured by a reduction in peak device density in the corridor zones during the next event.
Q2. A retail store's marketing team wants to prove the ROI of a new in-store digital signage campaign. How can they use guest WiFi analytics to measure the campaign's impact on footfall and dwell time?
💡 Astuce :The key is to isolate the variable. You need to compare behaviour in the target zone before and during the campaign.
Afficher l'approche recommandée
Define a zone around the new digital signage. Establish a baseline by measuring the average dwell time and the percentage of total store visitors who enter that zone for a two-week period before the campaign starts. Once the campaign is active, continue to measure the same metrics. The ROI can be demonstrated by showing a statistically significant increase in either dwell time within the zone (people are stopping to watch) or the capture rate of the zone (more people are being drawn to the area). For a more advanced analysis, integrate with POS data to see if the increased engagement correlates with a sales lift for the promoted products.
Q3. A hotel manager has noticed a 15% drop in bar revenue over the last quarter but overall visitor numbers are stable. How could they use WiFi analytics to investigate potential causes related to visitor behaviour?
💡 Astuce :This requires looking at visitor journeys and flow patterns, not just isolated zone data.
Afficher l'approche recommandée
The investigation should focus on visitor journey analysis. Define zones for the lobby, reception, lifts, and the bar. Use the platform's flow analysis tools to answer two questions: 1. What percentage of visitors who enter the lobby also enter the bar zone? Is this percentage trending down over the last quarter? 2. Of the visitors who do enter the bar, is their average dwell time decreasing? A drop in the lobby-to-bar conversion rate might suggest an issue with signage or visibility. A decrease in dwell time for those who do enter the bar might suggest a problem with service, atmosphere, or offerings. The data pinpoints whether the problem is attracting guests or retaining them.
Points clés à retenir
- ✓Your guest WiFi is a powerful sensor network capable of generating deep business intelligence.
- ✓WiFi analytics captures both passive (probe requests) and active (connected sessions) data to build a complete picture of visitor behaviour.
- ✓Accurate footfall and dwell time analysis depends on strategic AP placement with sufficient density for triangulation (the '3-AP rule').
- ✓MAC randomisation is a critical technical challenge; your analytics platform must have a robust mechanism to handle it for accurate counting.
- ✓The captive portal is your gateway for gaining GDPR-compliant consent and enriching anonymous data with valuable first-party demographic information.
- ✓The highest ROI comes from integrating WiFi analytics data into core operational workflows for staffing, marketing, and space utilisation.
- ✓Compliance is non-negotiable. Your consent workflow must be explicit, and your data handling must adhere to GDPR/CCPA principles.
