गेस्ट WiFi वेन्यू एनालिटिक्स और फुटफॉल ट्रैकिंग में कैसे मदद करता है
This guide provides a technical and operational framework for leveraging guest WiFi to gain deep insights into visitor behaviour within physical venues. It details how to capture and analyse data for footfall tracking and dwell time calculation, enabling IT and operations leaders to make data-driven decisions that optimize staffing, enhance venue layout, and increase business ROI.
🎧 इस गाइड को सुनें
ट्रांसक्रिप्ट देखें
कार्यकारी सारांश
वेन्यू ऑपरेटरों और IT लीडरशिप के लिए, गेस्ट WiFi अब केवल एक सुविधा नहीं है; यह बिज़नेस इंटेलिजेंस का एक महत्वपूर्ण स्रोत है। इंटरनेट एक्सेस प्रदान करने के अलावा, एक आधुनिक WiFi इंफ्रास्ट्रक्चर डेटा की एक समृद्ध स्ट्रीम कैप्चर करता है जो यह बताता है कि आगंतुक किसी भौतिक स्थान में कैसे घूमते हैं और उसके साथ कैसे इंटरैक्ट करते हैं। यह गाइड उन्नत वेन्यू एनालिटिक्स के लिए गेस्ट WiFi का लाभ उठाने के तरीके को समझने के लिए एक तकनीकी और परिचालन ढांचा प्रदान करती है, जिसमें विशेष रूप से फुटफॉल ट्रैकिंग, ड्वेल टाइम (रुकने का समय) की गणना और आगंतुक व्यवहार विश्लेषण पर ध्यान केंद्रित किया गया है। रॉ WiFi डेटा को कार्रवाई योग्य इनसाइट्स में बदलकर, संगठन स्टाफिंग को अनुकूलित कर सकते हैं, वेन्यू लेआउट में सुधार कर सकते हैं, मार्केटिंग ROI बढ़ा सकते हैं और समग्र आगंतुक अनुभव को बेहतर बना सकते हैं। यह संदर्भ उन IT प्रबंधकों, नेटवर्क आर्किटेक्ट्स और संचालन निदेशकों के लिए डिज़ाइन किया गया है जिन्हें अपने WiFi इंटेलिजेंस प्लेटफ़ॉर्म को तैनात करने, प्रबंधित करने और उससे मूल्य निकालने की आवश्यकता है। यह अंतर्निहित तकनीक, कार्यान्वयन की सर्वोत्तम प्रथाओं, GDPR के तहत अनुपालन संबंधी विचारों और व्यावसायिक प्रभाव को मापने के तरीकों को कवर करता है, जो सैद्धांतिक अवधारणाओं से लेकर व्यावहारिक परिनियोजन मार्गदर्शन तक जाता है।
तकनीकी डीप-डाइव
WiFi एनालिटिक्स कैसे काम करता है, यह समझने के लिए नेटवर्क के साथ डिवाइस के इंटरैक्शन के विभिन्न चरणों में उत्पन्न डेटा को देखना आवश्यक है। यह प्रक्रिया उपयोगकर्ता के प्रमाणित होने से पहले ही शुरू हो जाती है, जो उपस्थिति और आवाजाही के डेटा की एक मूलभूत परत प्रदान करती है।
पैसिव डेटा कलेक्शन: प्रोब रिक्वेस्ट
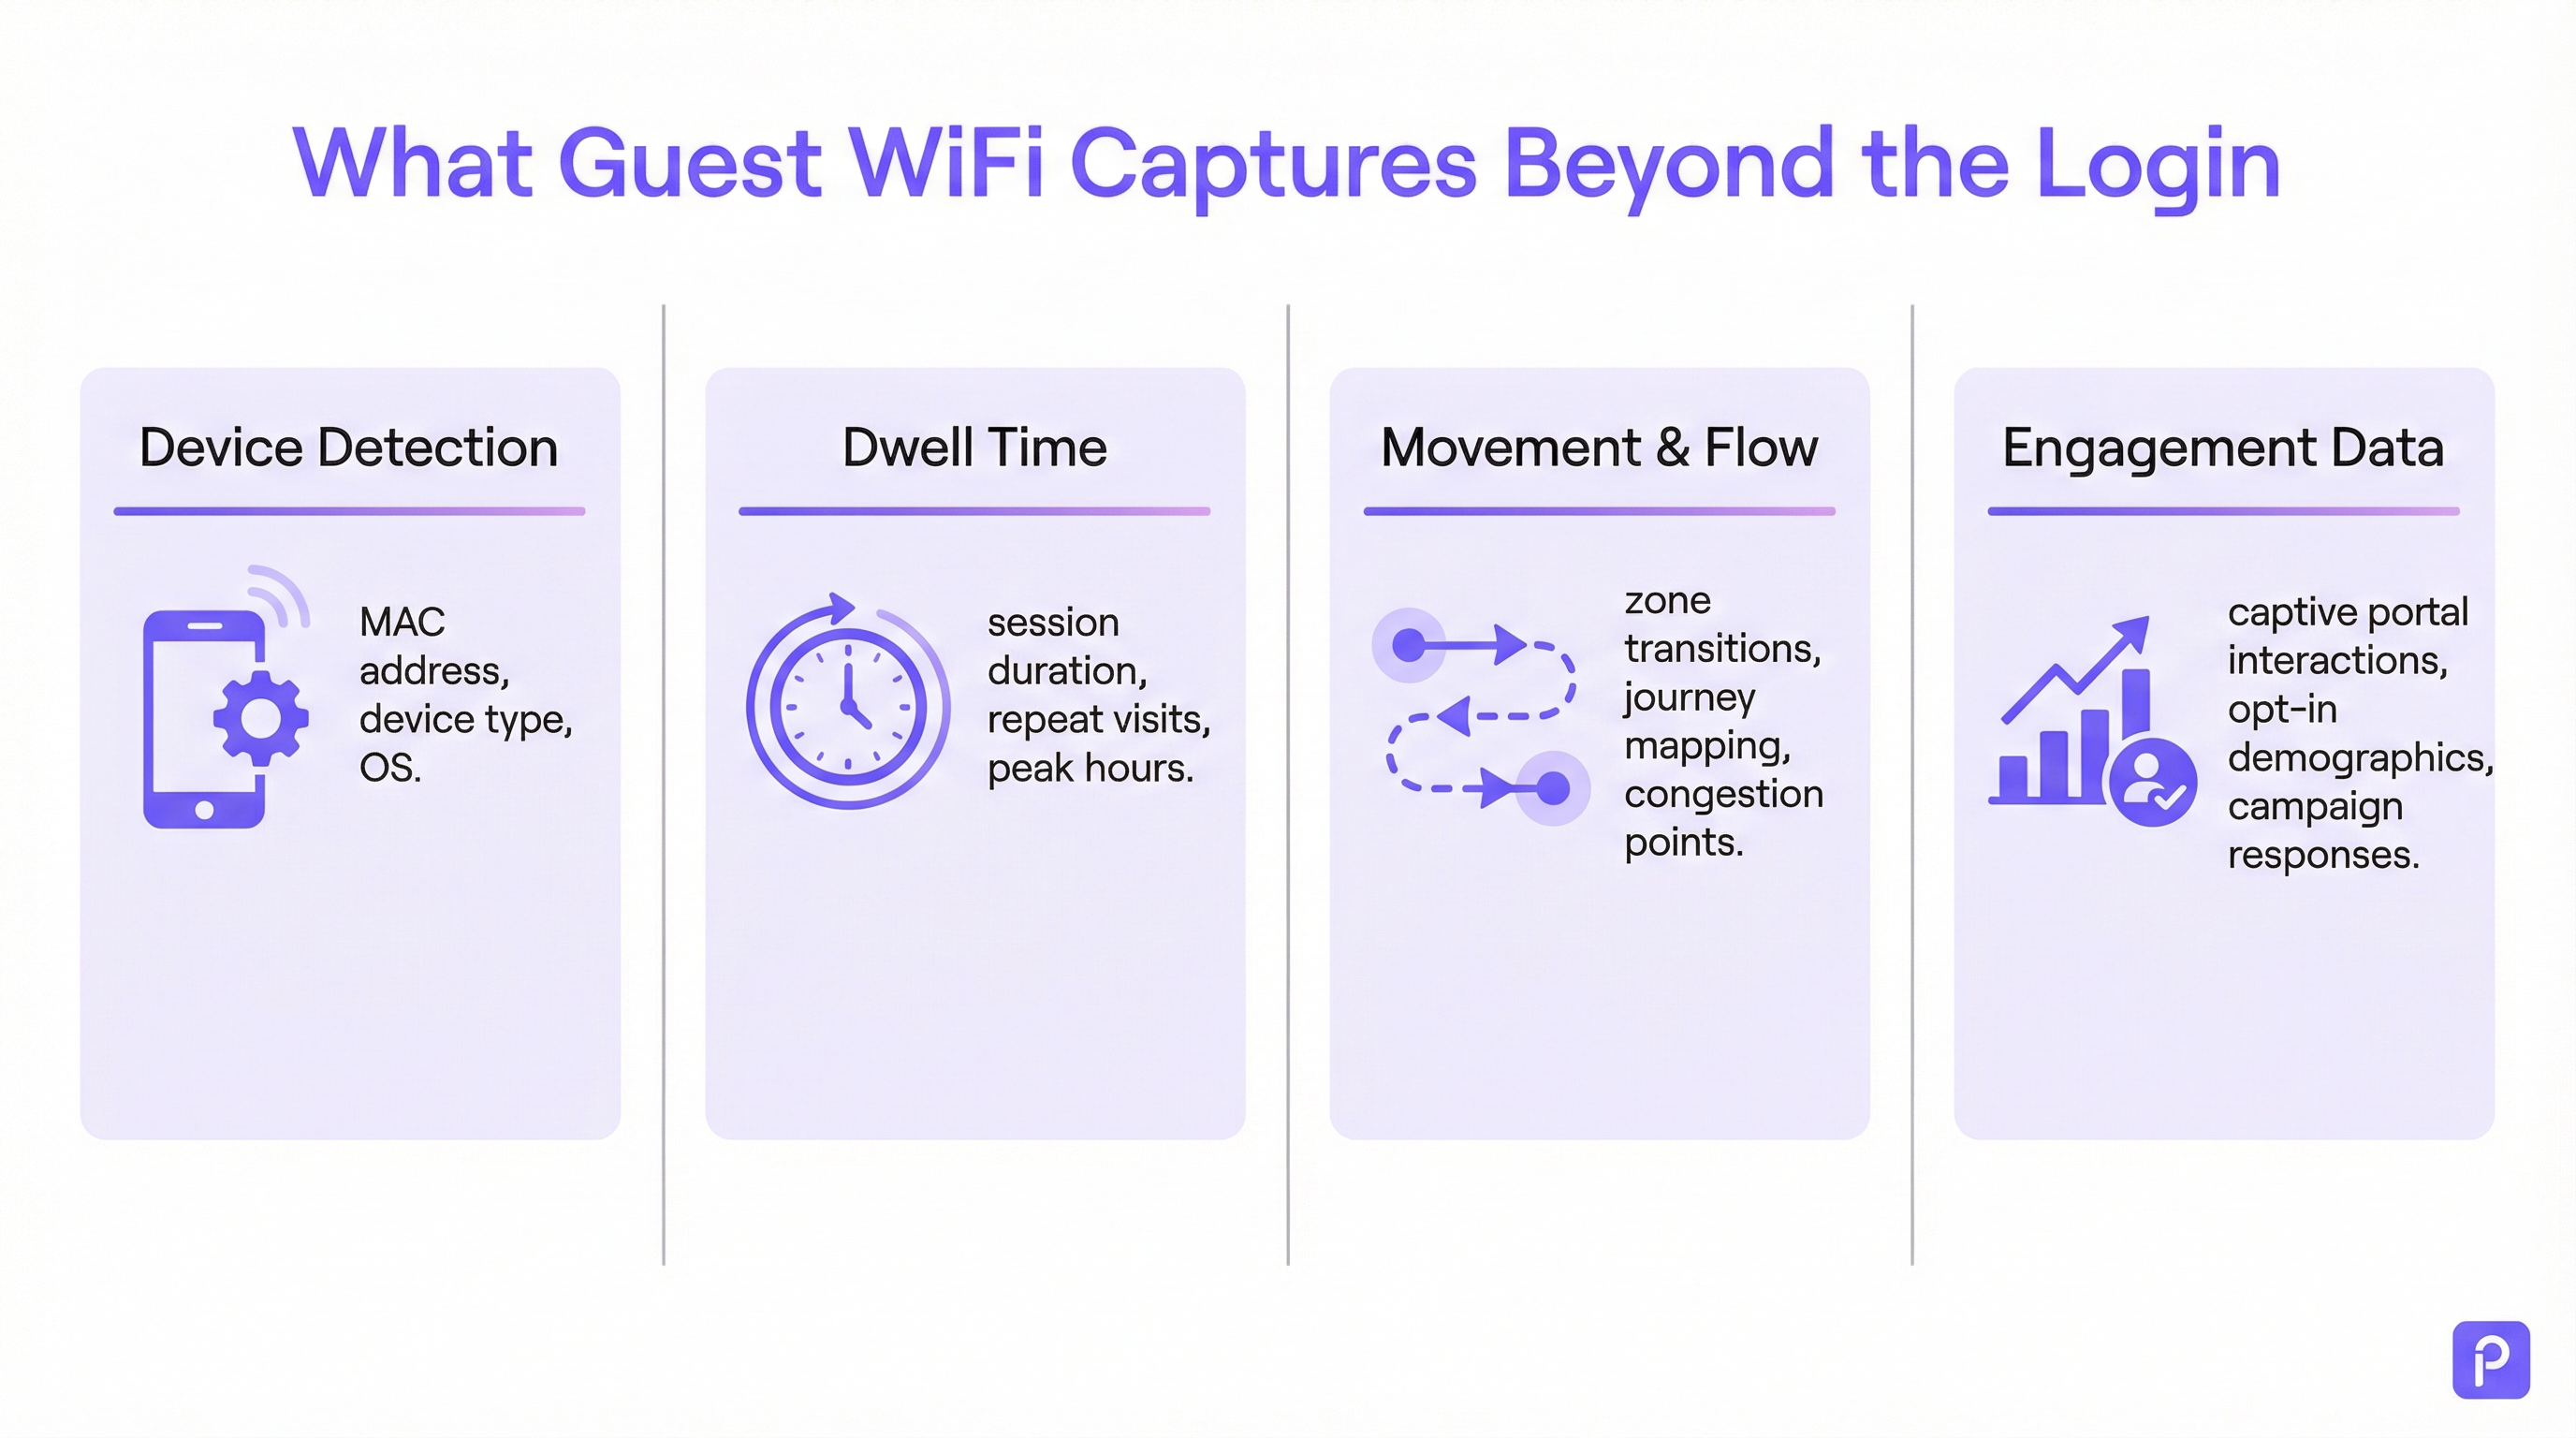
प्रत्येक WiFi-सक्षम डिवाइस (स्मार्टफोन, टैबलेट, लैपटॉप) समय-समय पर "प्रोब रिक्वेस्ट" ब्रॉडकास्ट करता है। ये छोटे डेटा पैकेट होते हैं जो डिवाइस द्वारा आस-पास के WiFi नेटवर्क खोजने के लिए भेजे जाते हैं। महत्वपूर्ण रूप से, प्रत्येक प्रोब रिक्वेस्ट में डिवाइस का विशिष्ट मीडिया एक्सेस कंट्रोल (MAC) पता होता है। भले ही कोई डिवाइस कभी नेटवर्क से कनेक्ट न हो, वेन्यू के भीतर मौजूद एक्सेस पॉइंट (APs) इन प्रोब रिक्वेस्ट का पता लगा सकते हैं और उन्हें लॉग कर सकते हैं।
- क्या कैप्चर किया जाता है: MAC पता, रिसीव्ड सिग्नल स्ट्रेंथ इंडिकेटर (RSSI), और पहचान का टाइमस्टैम्प।
- इसका उपयोग कैसे किया जाता है: कई APs से RSSI को ट्राइएंगुलेट करके, सिस्टम डिवाइस के स्थान का अनुमान लगा सकता है। इन पहचानों की एक निरंतर स्ट्रीम प्लेटफ़ॉर्म को वेन्यू के माध्यम से डिवाइस के पथ को ट्रेस करने की अनुमति देती है। यह रेंज में मौजूद सभी WiFi-सक्षम डिवाइसों के लिए फुटफॉल विश्लेषण का आधार बनता है, न कि केवल नेटवर्क से जुड़े डिवाइसों के लिए।
- MAC रैंडमाइज़ेशन की चुनौती: iOS 14 और Android 10 के बाद से, डिवाइस अब उपयोगकर्ता की गोपनीयता की रक्षा के लिए प्रोब रिक्वेस्ट के लिए अक्सर रैंडमाइज़्ड या निजी MAC पते का उपयोग करते हैं। इससे एक ही डिवाइस को कई बार गिना जा सकता है। एंटरप्राइज़-ग्रेड एनालिटिक्स प्लेटफ़ॉर्म इन रैंडमाइज़्ड पतों को डी-डुप्लिकेट करने के लिए परिष्कृत एल्गोरिदम का उपयोग करते हैं, जो एक ही डिवाइस के लिए संभावित यात्रा को एक साथ जोड़ने के लिए अन्य सिग्नल विशेषताओं और अस्थायी विश्लेषण का उपयोग करते हैं। [1]
एक्टिव डेटा कलेक्शन: कनेक्टेड सेशन
जब कोई आगंतुक सक्रिय रूप से गेस्ट WiFi से जुड़ता है, आमतौर पर Captive Portal के माध्यम से, तो एक बहुत अधिक समृद्ध डेटासेट उपलब्ध हो जाता है। प्रमाणीकरण प्रक्रिया एक परिभाषित शुरुआत और अंत के साथ एक औपचारिक सेशन बनाती है。
- ड्वेल टाइम की गणना: कनेक्टेड सेशन से प्राप्त सबसे बुनियादी मीट्रिक ड्वेल टाइम है। इसकी गणना सेशन के शुरू होने (प्रमाणीकरण) और सेशन के समाप्त होने (डिस्कनेक्शन या टाइमआउट) के बीच के समय के अंतर के रूप में की जाती है। एक मजबूत प्लेटफ़ॉर्म इससे भी आगे जाएगा, एक निश्चित समय सीमा के भीतर एक ही डिवाइस से कई छोटे सेशन को एक ही "विज़िट" में मिला देगा, जिससे वेन्यू में बिताए गए कुल समय की अधिक सटीक तस्वीर मिलेगी।
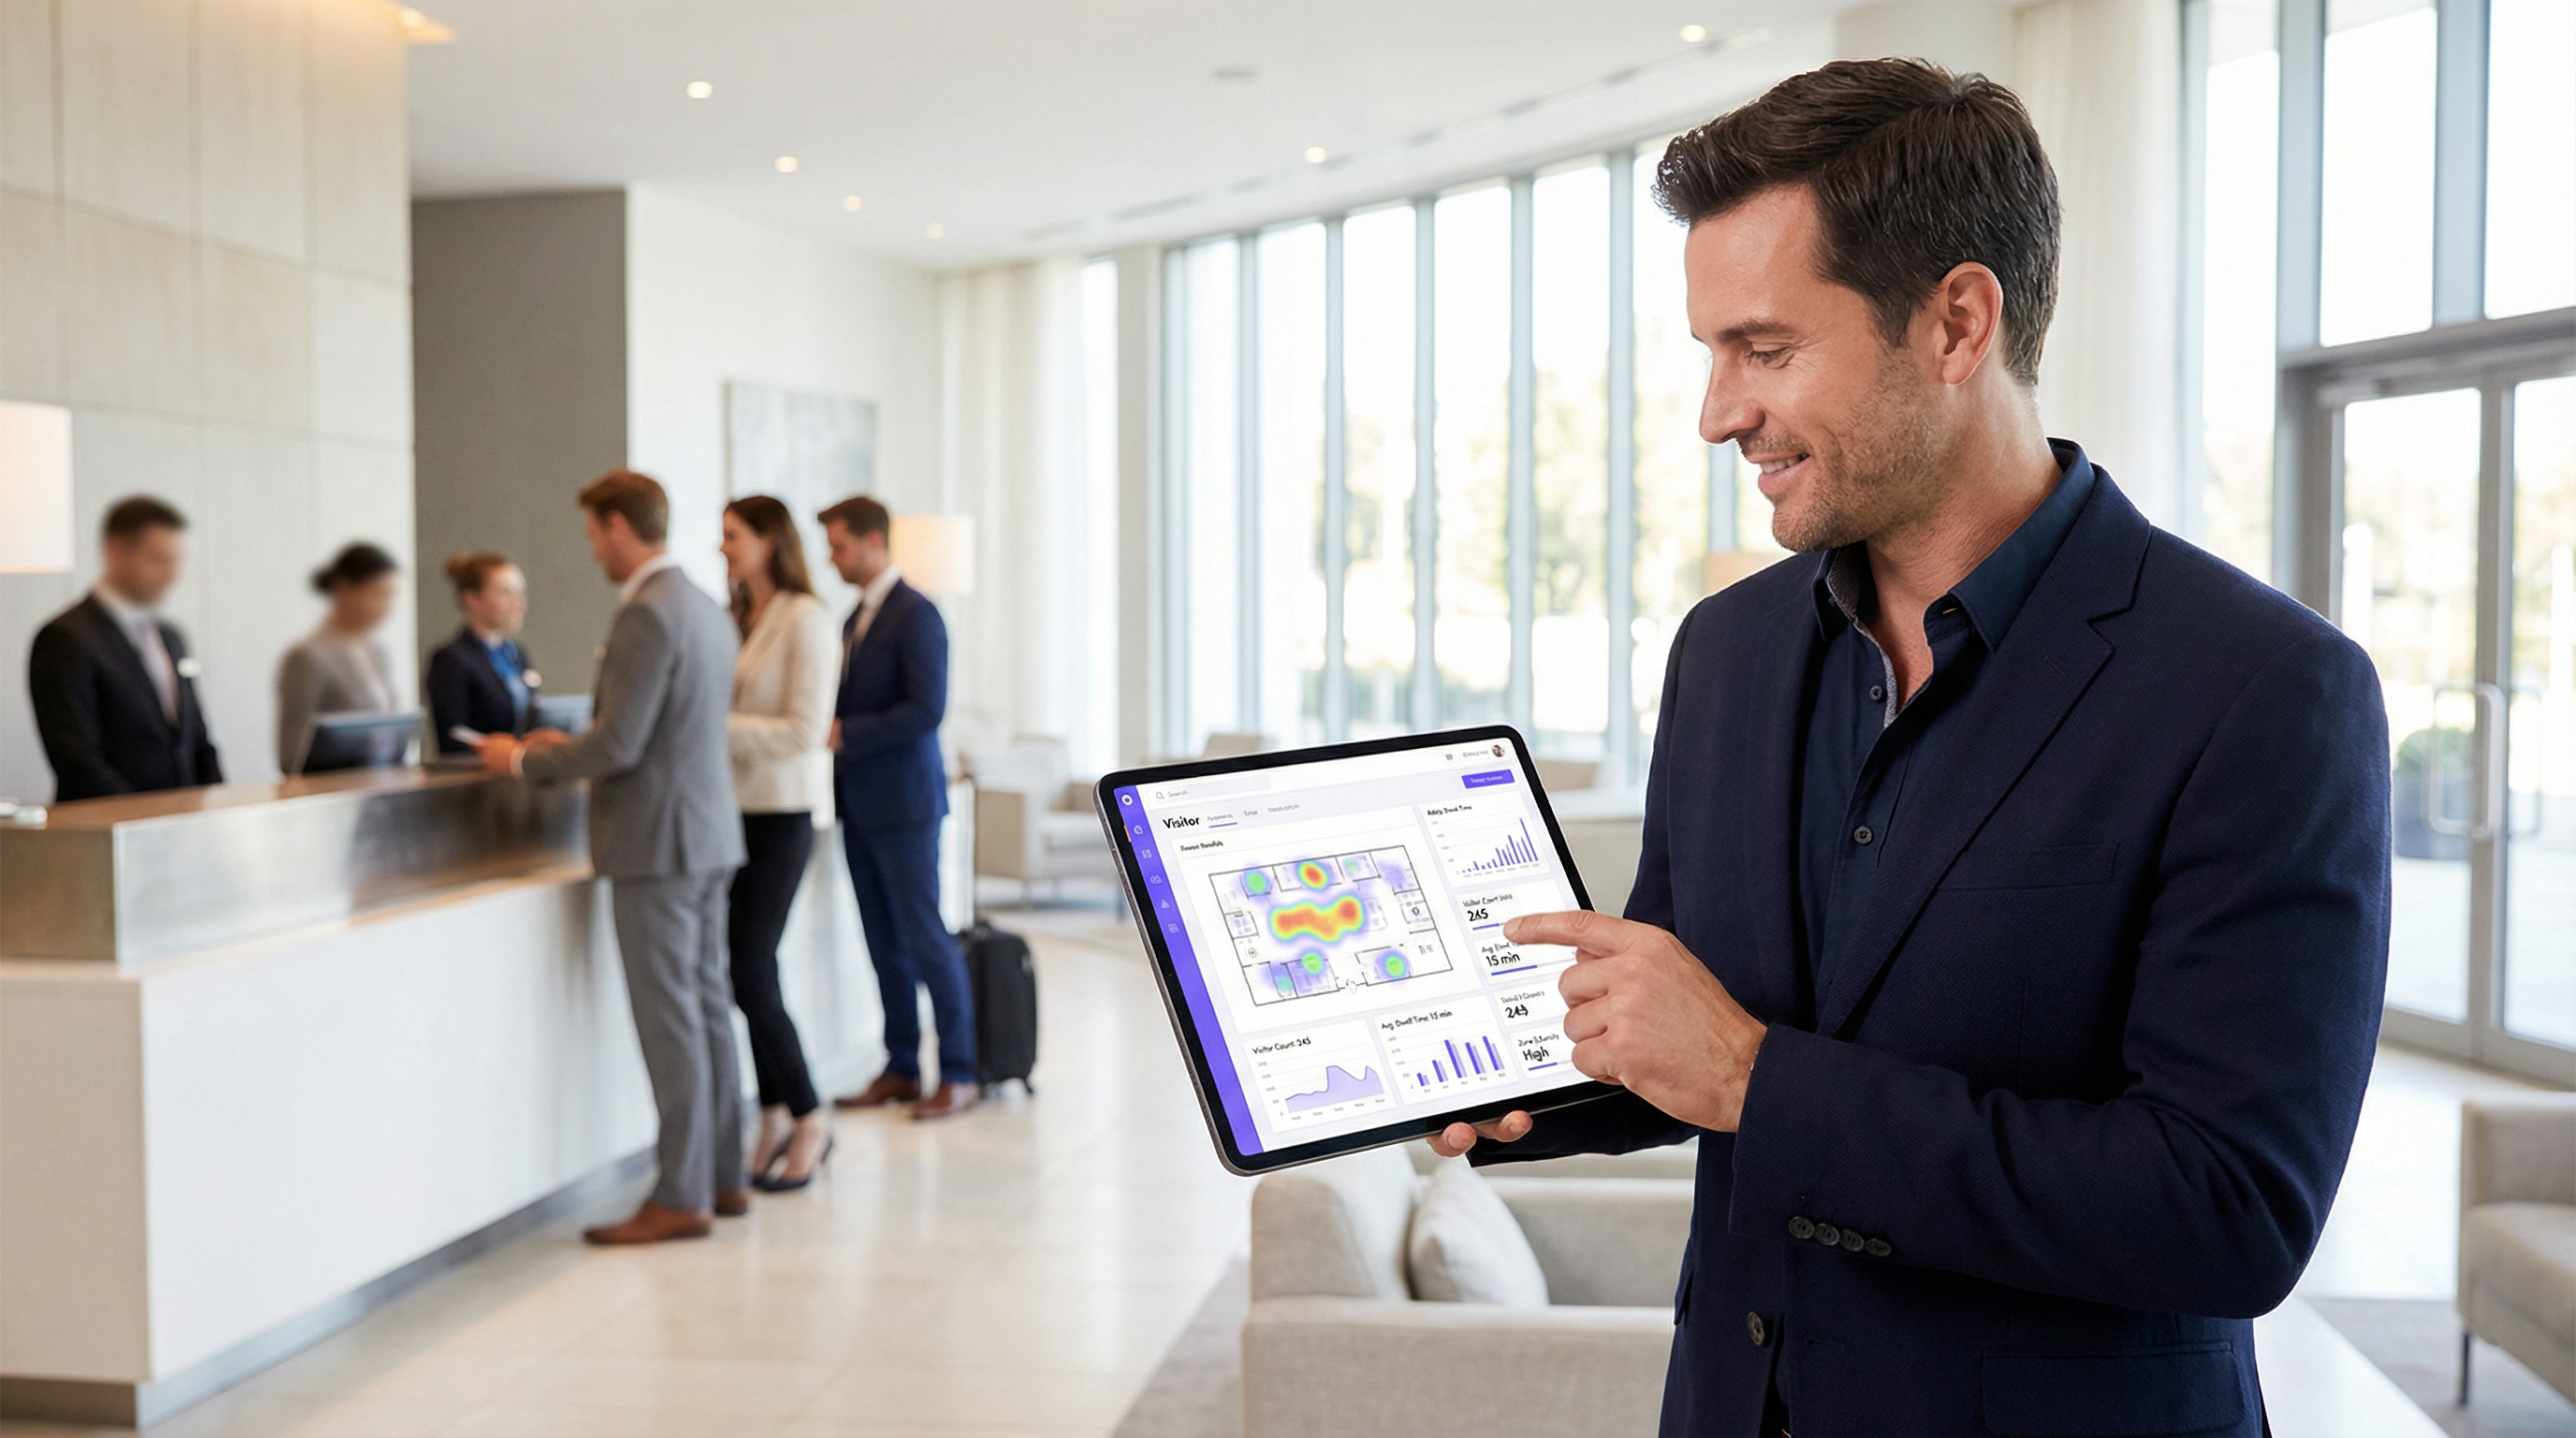
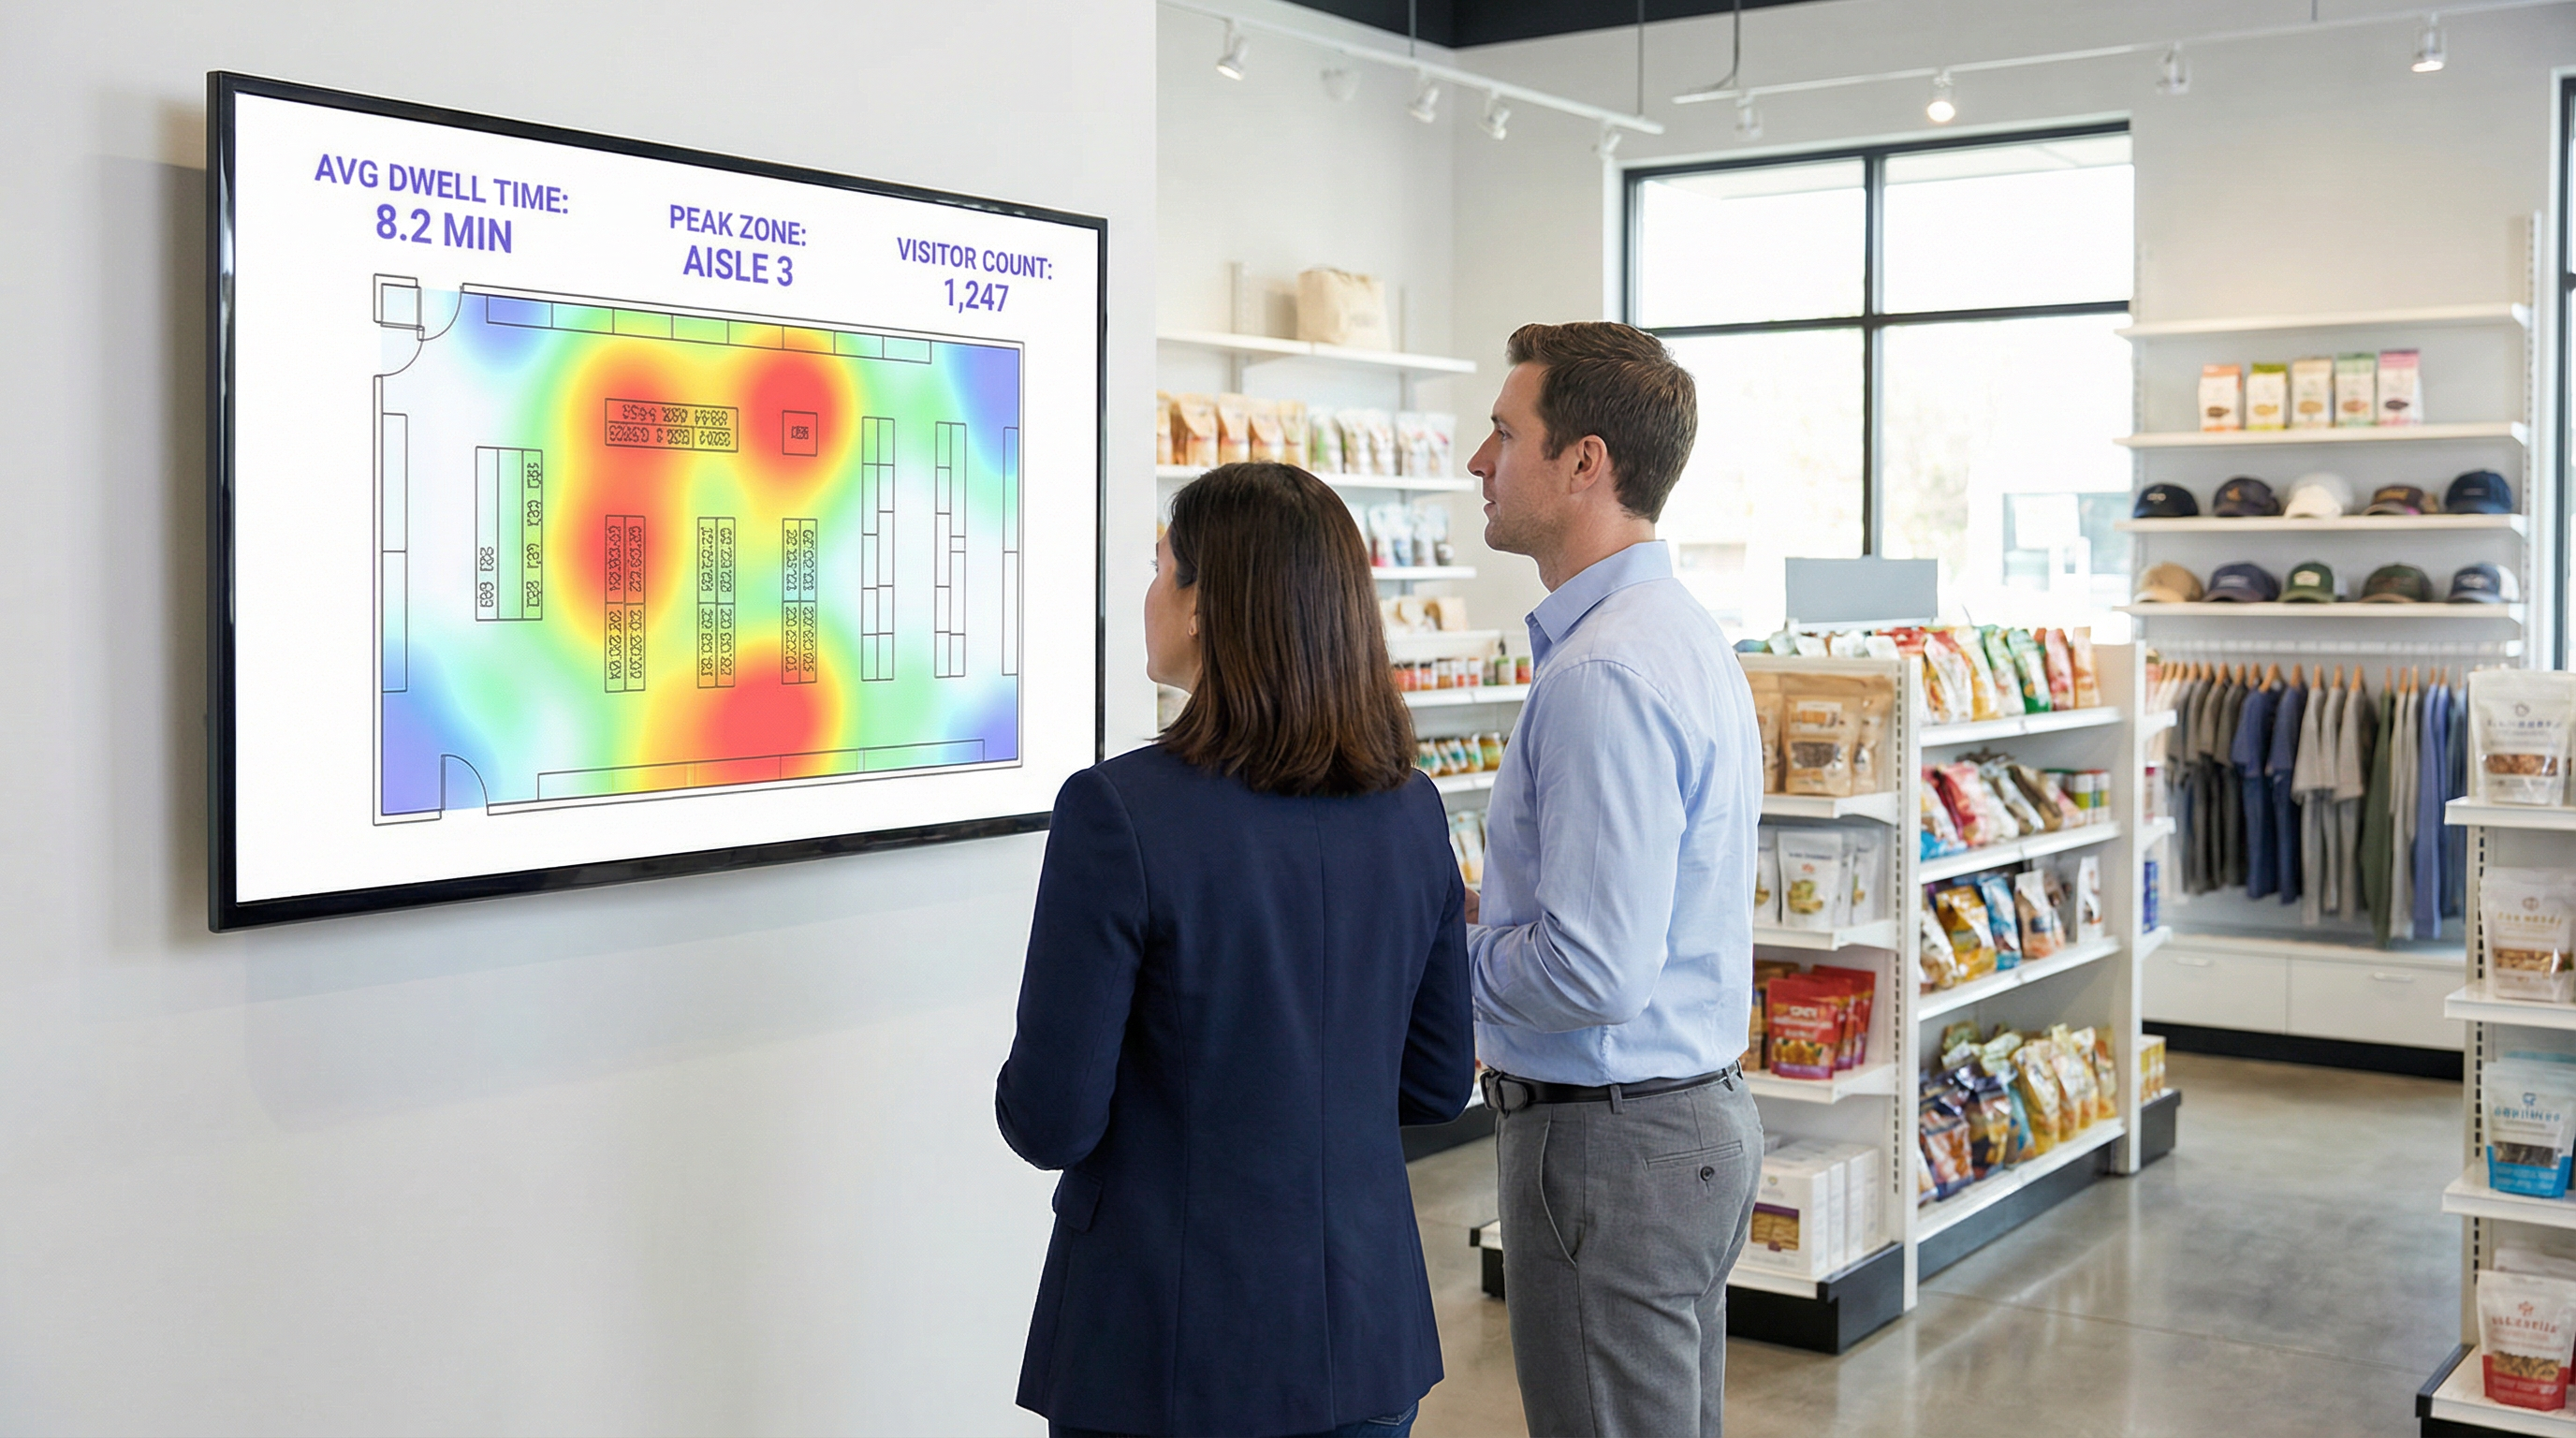
- लोकेशन और ज़ोन एनालिटिक्स: एक बार कनेक्ट होने के बाद, डिवाइस के स्थान को अधिक सटीकता के साथ ट्रैक किया जा सकता है। प्लेटफ़ॉर्म लगातार उन APs से RSSI की निगरानी करता है जिनके साथ डिवाइस संचार कर रहा है। यह विस्तृत ज़ोन-आधारित एनालिटिक्स की अनुमति देता है: लॉबी बनाम कैफे में कितने लोग हैं, वे प्रत्येक क्षेत्र में कितनी देर तक रुकते हैं, और ज़ोन के बीच ट्रैफ़िक का प्रवाह कैसा है। यह वह डेटा है जो रीयल-टाइम हीटमैप और जर्नी विश्लेषण को शक्ति प्रदान करता है।
- फर्स्ट-पार्टी डेटा एनरिचमेंट: Captive Portal एक महत्वपूर्ण रणनीतिक संपत्ति है। सोशल लॉगिन (उदा., Facebook, LinkedIn), ईमेल या एक साधारण फॉर्म के माध्यम से प्रमाणीकरण की पेशकश करके, वेन्यू स्पष्ट उपयोगकर्ता सहमति के साथ, अनाम MAC पते को वास्तविक दुनिया की पहचान या जनसांख्यिकीय प्रोफ़ाइल से जोड़ सकता है। यह डेटा को अनाम फुटफॉल काउंट से समृद्ध, फर्स्ट-पार्टी ग्राहक डेटा में बदल देता है जिसका उपयोग वैयक्तिकृत मार्केटिंग और CRM एकीकरण के लिए किया जा सकता है, जो GDPR जैसे मानकों के पूरी तरह से अनुपालन में है। [2]
कार्यान्वयन गाइड
एक सफल WiFi एनालिटिक्स परिनियोजन जितना भौतिक नेटवर्क डिज़ाइन और डेटा रणनीति के बारे में है, उतना ही सॉफ़्टवेयर कॉन्फ़िगरेशन के बारे में भी है।
चरण 1: AP प्लेसमेंट और डेंसिटी ऑडिट
आपका मौजूदा AP लेआउट कवरेज के लिए अनुकूलित हो सकता है, एनालिटिक्स के लिए नहीं। सटीक लोकेशन ट्रैकिंग के लिए, प्रभावी ट्राइएंगुलेशन को सक्षम करने के लिए APs की उच्च डेंसिटी (घनत्व) की आवश्यकता होती है।
- कवरेज-ओनली डिज़ाइन: APs को सिग्नल की पहुंच को अधिकतम करने के लिए रखा जाता है, जिसके परिणामस्वरूप अक्सर AP कवरेज ज़ोन के बीच न्यूनतम ओवरलैप होता है।
- एनालिटिक्स-रेडी डिज़ाइन: APs को महत्वपूर्ण ओवरलैप बनाने के लिए रखा जाता है। किसी भी दिए गए स्थान पर एक डिवाइस विश्वसनीय स्थान गणना के लिए कम से कम तीन APs द्वारा पता लगाने योग्य होना चाहिए। एक सामान्य सर्वोत्तम अभ्यास खुले क्षेत्रों में प्रति 150-200 वर्ग मीटर में एक AP का लक्ष्य रखना है।
चरण 2: डेटा इनजेशन कॉन्फ़िगर करना
एनालिटिक्स प्लेटफ़ॉर्म को आपके नेटवर्क कंट्रोलर से या सीधे APs से डेटा प्राप्त करने की आवश्यकता होती है। इसमें आमतौर पर एनालिटिक्स क्लाउड एंडपॉइंट पर प्रासंगिक प्रोब रिक्वेस्ट और सेशन की जानकारी वाले सिसलॉग (syslog) या SNMP ट्रैप डेटा को अग्रेषित करने के लिए नेटवर्क को कॉन्फ़िगर करना शामिल होता है। सुनिश्चित करें कि आपके फ़ायरवॉल नियम इस आउटबाउंड ट्रैफ़िक की अनुमति देते हैं।
चरण 3: ज़ोन और फ़्लोर प्लान परिभाषित करना
अपने वेन्यू के फ़्लोर प्लान को एनालिटिक्स प्लेटफ़ॉर्म पर अपलोड करें। फिर, दिए गए टूल का उपयोग करके, विशिष्ट परिचालन क्षेत्रों (उदा., 'मुख्य प्रवेश द्वार', 'आइल 3', 'बार क्षेत्र', 'मीटिंग रूम 1') के अनुरूप मानचित्र पर बहुभुज (polygonal) "ज़ोन" बनाएं। सार्थक, संदर्भ-विशिष्ट रिपोर्ट तैयार करने के लिए यह सबसे महत्वपूर्ण कॉन्फ़िगरेशन चरण है।
चरण 4: Captive Portal और सहमति वर्कफ़्लो डिज़ाइन
अपने Captive Portal को केवल लॉगिन गेट के रूप में नहीं, बल्कि डेटा गवर्नेंस टूल के रूप में डिज़ाइन करें। अपनी कानूनी और मार्केटिंग टीमों के सहयोग से:
- एक स्पष्ट गोपनीयता नोटिस तैयार करें: सरल भाषा में समझाएं कि कौन सा डेटा एकत्र किया जा रहा है (MAC पता, स्थान, सेशन का समय) और किस उद्देश्य के लिए (वेन्यू संचालन में सुधार करने के लिए, मार्केटिंग के लिए)।
- ग्रैन्युलर सहमति लागू करें: (a) नेटवर्क एक्सेस के लिए शर्तों को स्वीकार करने, और (b) एनालिटिक्स और मार्केटिंग के लिए डेटा संग्रह के लिए सहमति देने के लिए अलग, स्पष्ट चेकबॉक्स प्रदान करें। यह GDPR अनुपालन के लिए एक मुख्य आवश्यकता है।
- वैल्यू एक्सचेंज की पेशकश करें: डेटा साझा करने के लिए प्रोत्साहन देकर ऑप्ट-इन दरों को बढ़ाएं, जैसे कि डिस्काउंट वाउचर या प्रीमियम सामग्री तक पहुंच।
सर्वोत्तम प्रथाएं
- स्टाफ़ और स्टैटिक डिवाइसों को फ़िल्टर करें: सुनिश्चित करें कि आपके पास अपने एनालिटिक्स से स्टाफ़ के डिवाइसों और निश्चित उपकरणों (जैसे स्मार्ट टीवी या भुगतान टर्मिनल) के MAC पतों को बाहर करने की प्रक्रिया है। अधिकांश प्लेटफ़ॉर्म आपको अनदेखा करने के लिए MAC की सूची अपलोड करने की अनुमति देते हैं, जिससे आपके स्वयं के संचालन आगंतुक डेटा को प्रभावित करने से बचते हैं।
- अन्य सिस्टम के साथ एकीकृत करें: WiFi एनालिटिक्स की वास्तविक शक्ति तब महसूस होती है जब इसे अन्य डेटा स्रोतों के साथ जोड़ा जाता है। पॉइंट-ऑफ़-सेल (POS) सिस्टम के साथ एकीकरण आपको खर्च के साथ ड्वेल टाइम को सहसंबंधित करने की अनुमति देता है। आपके CRM के साथ एकीकरण आपको विज़िट इतिहास को ग्राहक प्रोफ़ाइल से जोड़ने की अनुमति देता है। मजबूत, अच्छी तरह से प्रलेखित REST API वाले प्लेटफ़ॉर्म को प्राथमिकता दें।
- डेटा प्रतिधारण नीतियों का पालन करें: कानूनी आवश्यकताओं (जैसे GDPR के स्टोरेज सीमा के सिद्धांत) और व्यावसायिक आवश्यकताओं के आधार पर एक स्पष्ट डेटा प्रतिधारण नीति स्थापित करें। अनाम, एकत्रित डेटा को अनिश्चित काल तक रखा जा सकता है, लेकिन व्यक्तिगत रूप से पहचान योग्य जानकारी (PII) को एक निर्धारित अवधि (उदा., 24 महीने) के बाद स्वचालित रूप से हटा दिया जाना चाहिए या अनाम कर दिया जाना चाहिए।
समस्या निवारण और जोखिम न्यूनीकरण
- समस्या: गलत आगंतुक गणना: यह अक्सर MAC रैंडमाइज़ेशन के कारण होता है। सुनिश्चित करें कि आपके प्लेटफ़ॉर्म में इसे संबोधित करने के लिए एक विशिष्ट सुविधा है। यदि गणना अभी भी अधिक लगती है, तो जांच करें कि क्या स्टाफ़ या स्टैटिक डिवाइस डेटा में शामिल किए जा रहे हैं।
- समस्या: खराब लोकेशन सटीकता: यह लगभग हमेशा अपर्याप्त AP डेंसिटी या सबऑप्टिमल प्लेसमेंट की ओर इशारा करता है। कवरेज अंतराल और उन क्षेत्रों की पहचान करने के लिए साइट सर्वेक्षण करें जहां किसी डिवाइस को केवल एक या दो APs द्वारा 'देखा' जा सकता है।
- जोखिम: GDPR/CCPA अनुपालन विफलता: सबसे बड़ा जोखिम खराब तरीके से कॉन्फ़िगर की गई सहमति प्रक्रिया है। यह सुनिश्चित करने के लिए कि यह स्पष्ट और सूचित सहमति के नवीनतम मानकों को पूरा करता है, नियमित रूप से अपने Captive Portal वर्कफ़्लो का ऑडिट करें। सुनिश्चित करें कि आपका प्लेटफ़ॉर्म वेंडर एक डेटा प्रोसेसिंग परिशिष्ट (DPA) प्रदान कर सकता है जो उन्हें अनुपालन डेटा हैंडलिंग के लिए प्रतिबद्ध करता है। [3]
- जोखिम: डेटा सुरक्षा उल्लंघन: आपके नेटवर्क और एनालिटिक्स क्लाउड के बीच कनेक्शन सुरक्षित होना चाहिए। सत्यापित करें कि डेटा ट्रांज़िट में (TLS 1.2 या उच्चतर का उपयोग करके) और रेस्ट पर एन्क्रिप्ट किया गया है। आपके प्लेटफ़ॉर्म को भूमिका-आधारित एक्सेस कंट्रोल (RBAC) का भी समर्थन करना चाहिए ताकि यह सुनिश्चित हो सके कि उपयोगकर्ता केवल अपनी भूमिकाओं के लिए प्रासंगिक डेटा देख सकें।
ROI और व्यावसायिक प्रभाव
WiFi एनालिटिक्स प्लेटफ़ॉर्म से निवेश पर रिटर्न (ROI) मापने में प्रमुख परिचालन मीट्रिक में सुधार को ट्रैक करना शामिल है।
- रिटेल: विशिष्ट विभागों में ड्वेल टाइम को अपने POS के बिक्री डेटा के साथ सहसंबंधित करें। इलेक्ट्रॉनिक्स विभाग में ड्वेल टाइम में 10% की वृद्धि जो उस श्रेणी की बिक्री में 2% की वृद्धि के साथ सहसंबंधित है, एक स्पष्ट ROI प्रदान करती है। स्टोर लेआउट का A/B परीक्षण करने और आगंतुक प्रवाह और उत्पाद खोज पर प्रभाव को मापने के लिए फुटफॉल डेटा का उपयोग करें।
- हॉस्पिटैलिटी: ऐतिहासिक और रीयल-टाइम ऑक्यूपेंसी डेटा के आधार पर लॉबी, बार और रेस्तरां में स्टाफिंग को अनुकूलित करें। एक होटल शांत अवधि के दौरान ओवरस्टाफिंग से बच सकता है और अप्रत्याशित पीक के दौरान सेवा में गिरावट को रोक सकता है, जिससे सीधे पेरोल बचत होती है और अतिथि संतुष्टि में सुधार होता है।
- सम्मेलन केंद्र: प्रायोजकों को उनके बूथों के आसपास फुटफॉल और ड्वेल टाइम पर सत्यापन योग्य डेटा प्रदान करें, जिससे एक नई राजस्व स्ट्रीम तैयार हो सके। भविष्य के इवेंट प्रोग्रामिंग को सूचित करने के लिए ब्रेकआउट रूम से सेशन डेटा का उपयोग करें, उन विषयों पर ध्यान केंद्रित करें जो सबसे अधिक जुड़ाव उत्पन्न करते हैं।
[1] IEEE स्टैंडर्ड्स एसोसिएशन। (2020)। IEEE 802.11-2020 - सूचना प्रौद्योगिकी के लिए IEEE मानक। https://standards.ieee.org/standard/802_11-2020.html [2] जनरल डेटा प्रोटेक्शन रेगुलेशन (GDPR)। (2018)। यूरोपीय संसद और परिषद का विनियमन (EU) 2016/679। https://gdpr-info.eu/ [3] सूचना आयुक्त कार्यालय (ICO)। (2021)। जनरल डेटा प्रोटेक्शन रेगुलेशन (GDPR) के लिए गाइड। https://ico.org.uk/for-organisations/guide-to-data-protection/guide-to-the-general-data-protection-regulation-gdpr/
मुख्य शब्द और परिभाषाएं
Guest WiFi Analytics
The process of capturing, analysing, and interpreting data from guest WiFi networks to understand visitor behaviour in a physical space.
IT teams use this to transform the WiFi network from a cost centre into a source of business intelligence that informs operational decisions.
WiFi Footfall Tracking
The use of WiFi signals (specifically probe requests and session data) to measure the number of people entering a venue or specific zone and the paths they take.
Operations managers use this data to understand visitor journeys, identify bottlenecks, and optimise venue layouts without needing separate people-counting hardware.
Dwell Time
The total amount of time a visitor's device is detected within a venue or a specific predefined zone during a single visit.
This is a primary KPI for engagement. In retail, longer dwell time often correlates with higher spend. In hospitality, it helps measure the utilisation of amenities like bars and lounges.
MAC Address
A unique hardware identifier assigned to a device's network interface. It is the primary identifier used to track a device, even before it connects to a network.
While essential for tracking, IT teams must be aware of MAC randomisation and ensure their analytics platform can account for it to avoid inaccurate visitor counts.
RSSI (Received Signal Strength Indicator)
A measurement of the power present in a radio signal received by an access point from a device. The stronger the signal, the closer the device is assumed to be.
This is the core data point used for location triangulation. Network architects need to ensure sufficient AP density for reliable RSSI readings from multiple points.
Captive Portal
A web page that a user must view and interact with before being granted access to a public WiFi network.
For IT and marketing, this is the strategic point for enforcing terms, gaining GDPR-compliant consent for data collection, and capturing first-party data like email addresses.
MAC Randomisation
A privacy feature in modern operating systems (iOS, Android) that periodically changes the MAC address a device uses for WiFi scanning to prevent passive tracking.
This is the single biggest technical challenge for accurate footfall counting. A key task for network architects is to select an analytics platform that has a proven mechanism for mitigating its effects.
Zone Analytics
The analysis of visitor behaviour within predefined virtual areas (zones) of a venue, such as movement between zones and dwell time per zone.
Venue operators use this to get granular insights. Instead of just knowing total visitors, they can compare the performance of 'Aisle 1' vs. 'Aisle 2' or see how many lobby visitors proceed to the restaurant.
केस स्टडीज
A 200-room hotel wants to reduce lobby congestion during the peak check-in window (3-5 PM) and improve the guest experience.
- Deploy WiFi Analytics: Ensure AP density in the lobby, entrance, and bar areas meets the 3-AP visibility rule. Define zones for 'Check-in Queue', 'Lobby Seating', and 'Bar Entrance'. 2. Data Collection (1 Week): Collect baseline data on visitor flow and dwell times during the 3-5 PM window. 3. Analysis: The analytics reveal that dwell time in the 'Check-in Queue' zone peaks at 15 minutes, and footfall from the entrance flows directly to the queue, bypassing the lobby bar. 4. Intervention: The hotel implements a mobile check-in station in the 'Lobby Seating' area and updates the captive portal to promote a 'skip the queue' message with a link to the hotel app. 5. Measure & Iterate: Post-intervention data shows queue dwell time has dropped to 8 minutes, and footfall to the bar area from the entrance has increased by 20%.
A retail chain is redesigning its flagship store and wants to validate that the new layout improves product discovery and customer engagement.
- Baseline Analysis: Before the redesign, use WiFi analytics to map the most common customer journeys and generate a footfall heatmap. Identify which zones have the highest and lowest dwell times. 2. Post-Redesign Analysis: After the new layout is implemented, conduct the same analysis. 3. Comparative Reporting: Compare the before-and-after heatmaps and journey flows. The new layout is successful if: (a) footfall is more evenly distributed, indicating better discovery; (b) dwell time has increased in high-margin product zones; and (c) the percentage of visitors who only visit the entrance zone (bouncing) has decreased. 4. POS Integration: Correlate the increase in dwell time in a specific zone (e.g., 'Premium Denim') with sales data for that category to calculate the direct revenue impact of the layout change.
परिदृश्य विश्लेषण
Q1. A large conference is experiencing complaints about overcrowding in the corridors between sessions. How would you use WiFi analytics to diagnose the problem and propose a data-driven solution?
💡 संकेत:Think about using time-series data for specific zones and correlating it with the event schedule.
अनुशंसित दृष्टिकोण दिखाएं
First, define the corridor areas as distinct zones in the analytics platform. Then, analyse the footfall and device density metrics for these zones, specifically in the 15-minute windows before and after major keynote sessions. This will quantify the congestion peaks. The solution would be to present this data to the event organisers and recommend staggering the session end times by 10-15 minutes for adjacent large halls to smooth out the flow of attendees. The success of this change can be measured by a reduction in peak device density in the corridor zones during the next event.
Q2. A retail store's marketing team wants to prove the ROI of a new in-store digital signage campaign. How can they use guest WiFi analytics to measure the campaign's impact on footfall and dwell time?
💡 संकेत:The key is to isolate the variable. You need to compare behaviour in the target zone before and during the campaign.
अनुशंसित दृष्टिकोण दिखाएं
Define a zone around the new digital signage. Establish a baseline by measuring the average dwell time and the percentage of total store visitors who enter that zone for a two-week period before the campaign starts. Once the campaign is active, continue to measure the same metrics. The ROI can be demonstrated by showing a statistically significant increase in either dwell time within the zone (people are stopping to watch) or the capture rate of the zone (more people are being drawn to the area). For a more advanced analysis, integrate with POS data to see if the increased engagement correlates with a sales lift for the promoted products.
Q3. A hotel manager has noticed a 15% drop in bar revenue over the last quarter but overall visitor numbers are stable. How could they use WiFi analytics to investigate potential causes related to visitor behaviour?
💡 संकेत:This requires looking at visitor journeys and flow patterns, not just isolated zone data.
अनुशंसित दृष्टिकोण दिखाएं
The investigation should focus on visitor journey analysis. Define zones for the lobby, reception, lifts, and the bar. Use the platform's flow analysis tools to answer two questions: 1. What percentage of visitors who enter the lobby also enter the bar zone? Is this percentage trending down over the last quarter? 2. Of the visitors who do enter the bar, is their average dwell time decreasing? A drop in the lobby-to-bar conversion rate might suggest an issue with signage or visibility. A decrease in dwell time for those who do enter the bar might suggest a problem with service, atmosphere, or offerings. The data pinpoints whether the problem is attracting guests or retaining them.
मुख्य निष्कर्ष
- ✓Your guest WiFi is a powerful sensor network capable of generating deep business intelligence.
- ✓WiFi analytics captures both passive (probe requests) and active (connected sessions) data to build a complete picture of visitor behaviour.
- ✓Accurate footfall and dwell time analysis depends on strategic AP placement with sufficient density for triangulation (the '3-AP rule').
- ✓MAC randomisation is a critical technical challenge; your analytics platform must have a robust mechanism to handle it for accurate counting.
- ✓The captive portal is your gateway for gaining GDPR-compliant consent and enriching anonymous data with valuable first-party demographic information.
- ✓The highest ROI comes from integrating WiFi analytics data into core operational workflows for staffing, marketing, and space utilisation.
- ✓Compliance is non-negotiable. Your consent workflow must be explicit, and your data handling must adhere to GDPR/CCPA principles.
