Come il Guest WiFi supporta l'analisi degli spazi e il monitoraggio dell'affluenza
This guide provides a technical and operational framework for leveraging guest WiFi to gain deep insights into visitor behaviour within physical venues. It details how to capture and analyse data for footfall tracking and dwell time calculation, enabling IT and operations leaders to make data-driven decisions that optimize staffing, enhance venue layout, and increase business ROI.
🎧 Ascolta questa guida
Visualizza trascrizione
Executive Summary
Per i gestori degli spazi e i responsabili IT, il Guest WiFi non è più solo un servizio; è una fonte fondamentale di business intelligence. Oltre a fornire l'accesso a Internet, una moderna infrastruttura WiFi acquisisce un ricco flusso di dati che rivela come i visitatori si muovono e interagiscono con uno spazio fisico. Questa guida fornisce un framework tecnico e operativo per comprendere come sfruttare il Guest WiFi per un'analisi avanzata degli spazi, concentrandosi in particolare sul monitoraggio dell'affluenza, sul calcolo del tempo di permanenza e sull'analisi del comportamento dei visitatori. Trasformando i dati WiFi grezzi in insight fruibili, le organizzazioni possono ottimizzare il personale, migliorare il layout degli spazi, aumentare il ROI del marketing e arricchire l'esperienza complessiva dei visitatori. Questo riferimento è pensato per responsabili IT, architetti di rete e direttori operativi che devono implementare, gestire ed estrarre valore dalla propria piattaforma di WiFi intelligence. Copre la tecnologia sottostante, le best practice di implementazione, le considerazioni sulla conformità ai sensi del GDPR e i metodi per misurare l'impatto sul business, passando dai concetti teorici a indicazioni pratiche per la distribuzione.
Approfondimento tecnico
Comprendere il funzionamento della WiFi analytics richiede l'esame dei dati generati nelle diverse fasi di interazione di un dispositivo con la rete. Il processo inizia ancor prima che un utente si autentichi, fornendo un livello base di dati sulla presenza e sul movimento.
Raccolta passiva dei dati: Probe Request
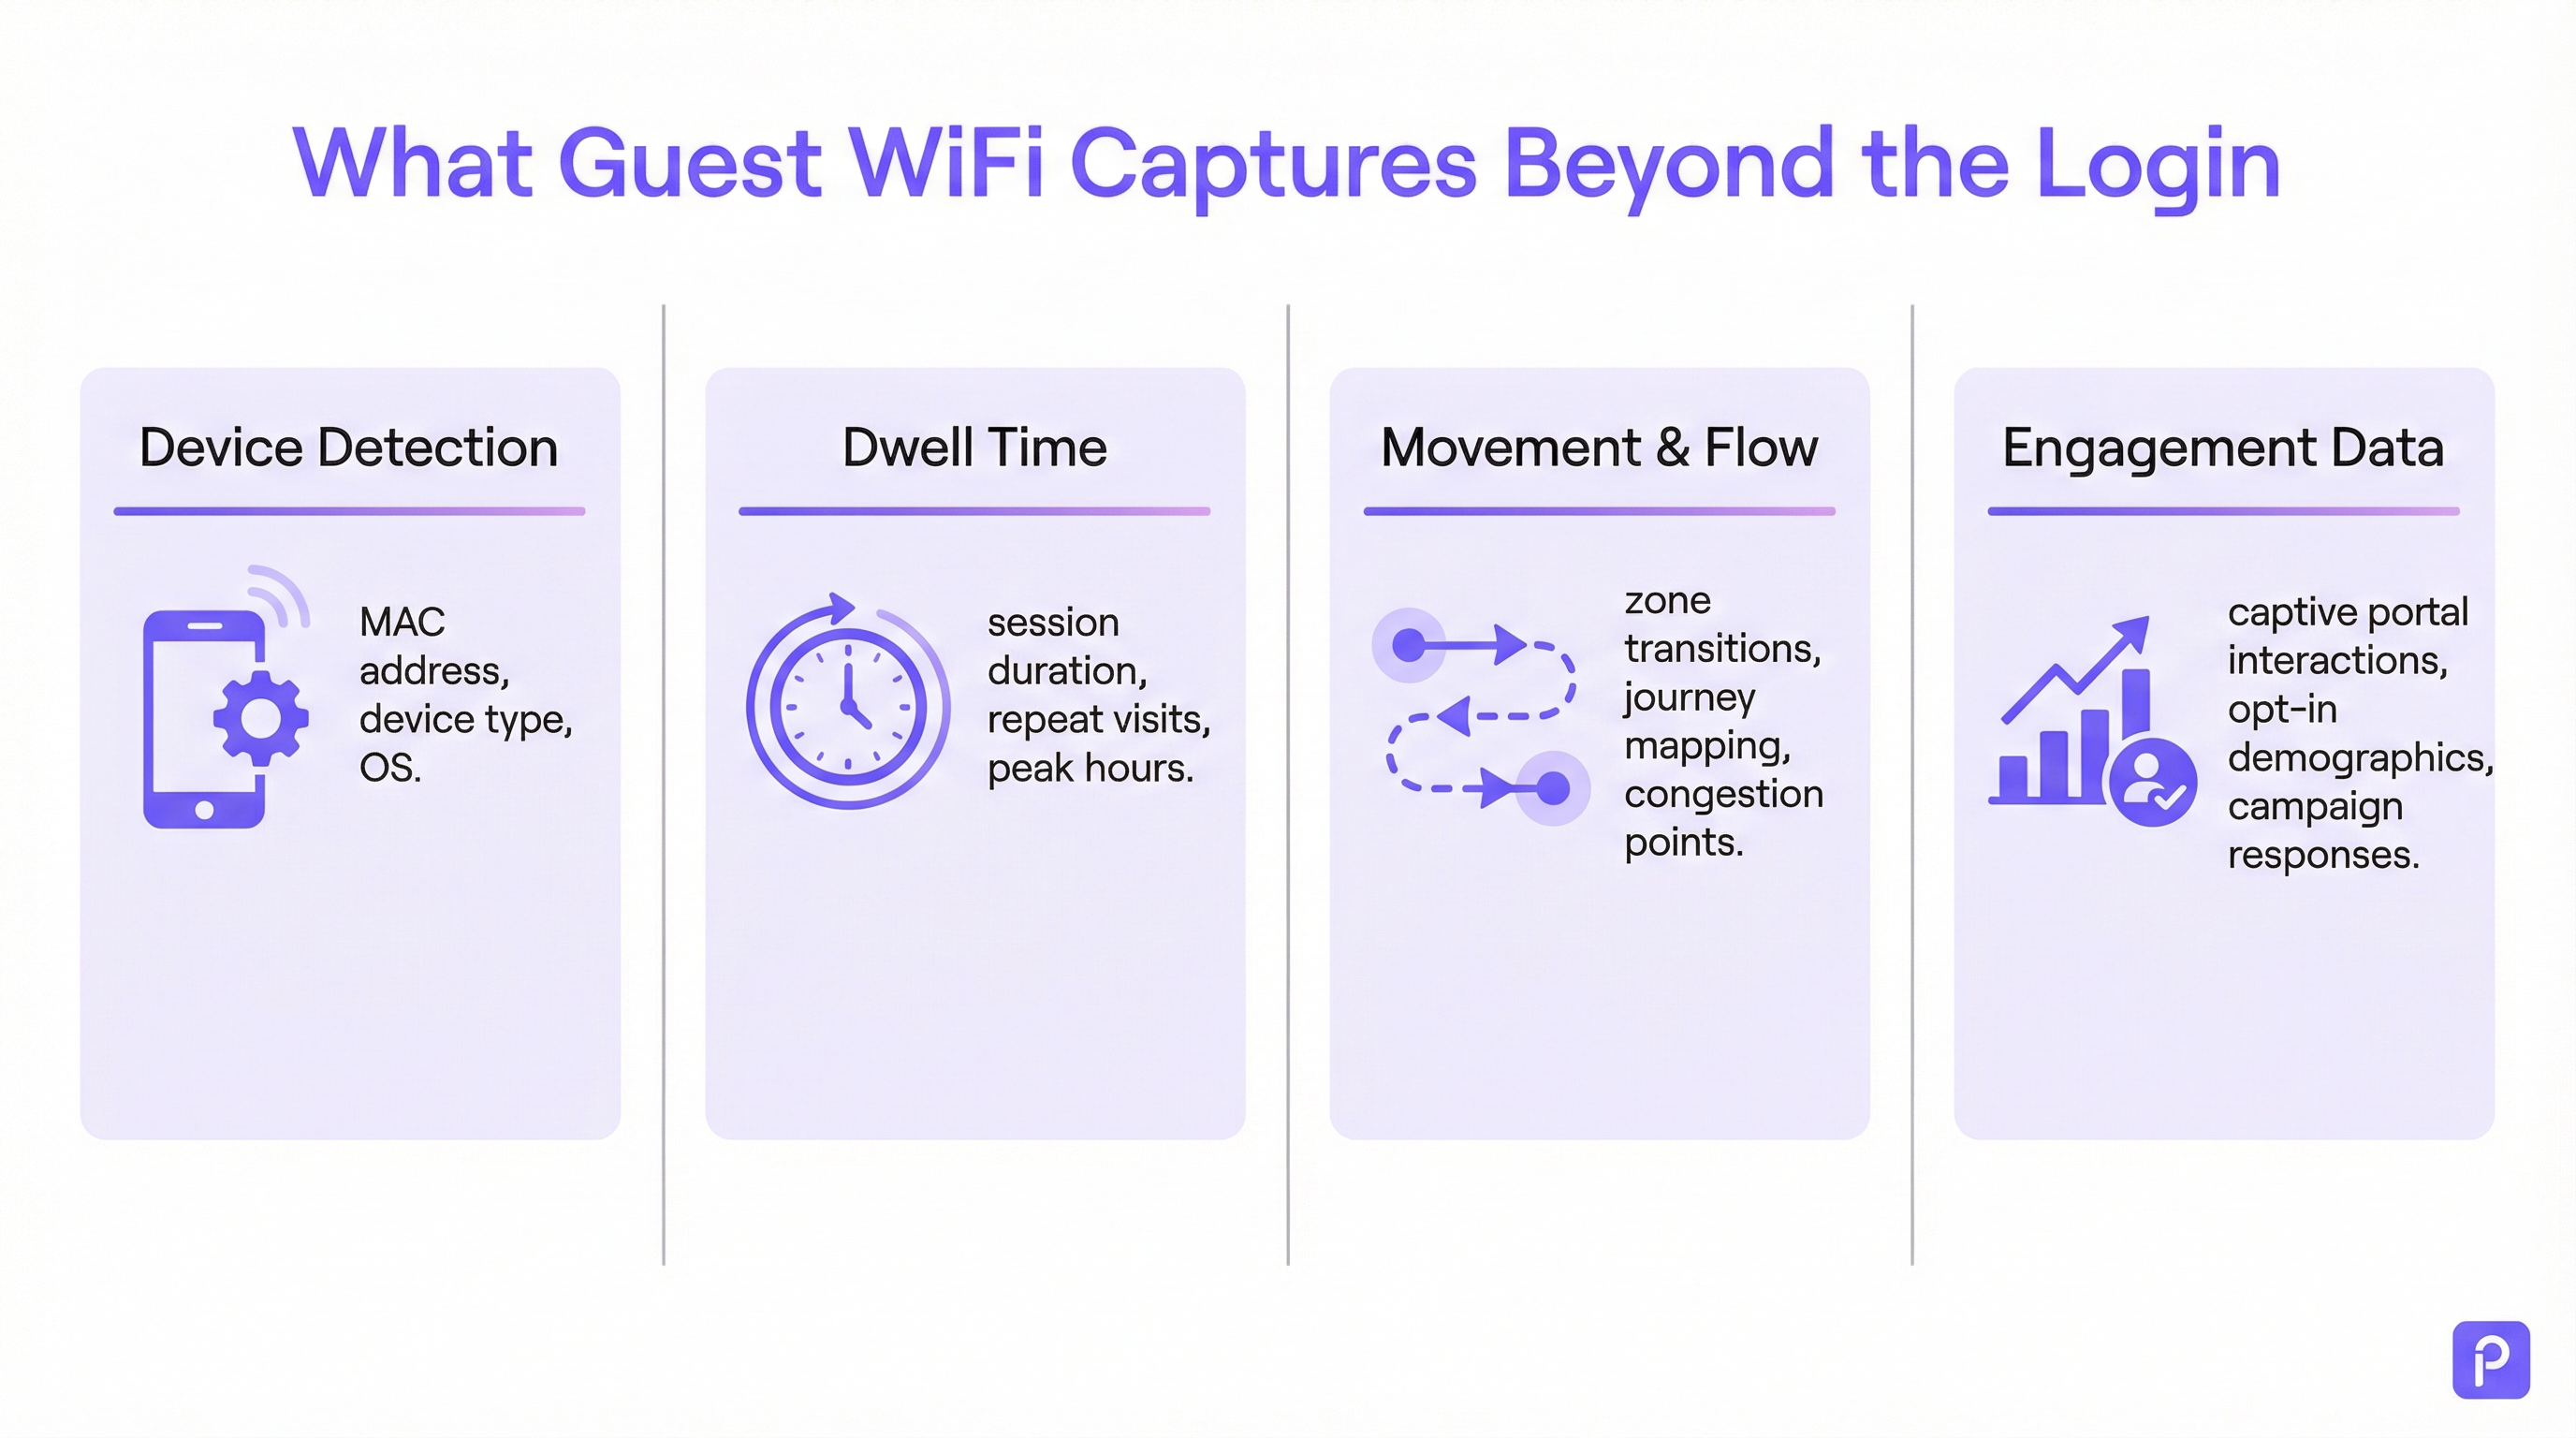
Ogni dispositivo dotato di WiFi (smartphone, tablet, laptop) trasmette periodicamente delle "probe request". Si tratta di piccoli pacchetti di dati inviati dal dispositivo per scoprire le reti WiFi nelle vicinanze. Fondamentalmente, ogni probe request contiene l'indirizzo MAC (Media Access Control) univoco del dispositivo. Anche se un dispositivo non si connette mai alla rete, gli access point (AP) all'interno della sede possono rilevare e registrare queste probe request.
- Cosa viene acquisito: indirizzo MAC, indicatore di potenza del segnale ricevuto (RSSI) e marca temporale (timestamp) del rilevamento.
- Come viene utilizzato: triangolando l'RSSI da più AP, il sistema può approssimare la posizione del dispositivo. Un flusso continuo di questi rilevamenti consente alla piattaforma di tracciare il percorso di un dispositivo all'interno dello spazio. Questo costituisce la base dell'analisi dell'affluenza per tutti i dispositivi con WiFi nel raggio d'azione, non solo per quelli connessi alla rete.
- La sfida della randomizzazione del MAC: a partire da iOS 14 e Android 10, i dispositivi utilizzano spesso un indirizzo MAC randomizzato o privato per le probe request al fine di proteggere la privacy dell'utente. Ciò può far sì che un singolo dispositivo venga conteggiato più volte. Le piattaforme di analytics di livello enterprise impiegano algoritmi sofisticati per deduplicare questi indirizzi randomizzati, utilizzando altre caratteristiche del segnale e l'analisi temporale per ricostruire un percorso probabile per un singolo dispositivo. [1]
Raccolta attiva dei dati: sessioni connesse
Quando un visitatore si connette attivamente al Guest WiFi, in genere tramite un Captive Portal, diventa disponibile un set di dati molto più ricco. Il processo di autenticazione crea una sessione formale con un inizio e una fine definiti.
- Calcolo del tempo di permanenza: la metrica fondamentale derivata da una sessione connessa è il tempo di permanenza. Viene calcolato come la differenza di tempo tra l'inizio della sessione (autenticazione) e la fine della sessione (disconnessione o timeout). Una piattaforma solida andrà oltre, unendo più sessioni brevi dello stesso dispositivo all'interno di una determinata finestra temporale in un'unica "visita", fornendo un quadro più accurato del tempo totale trascorso nella sede.
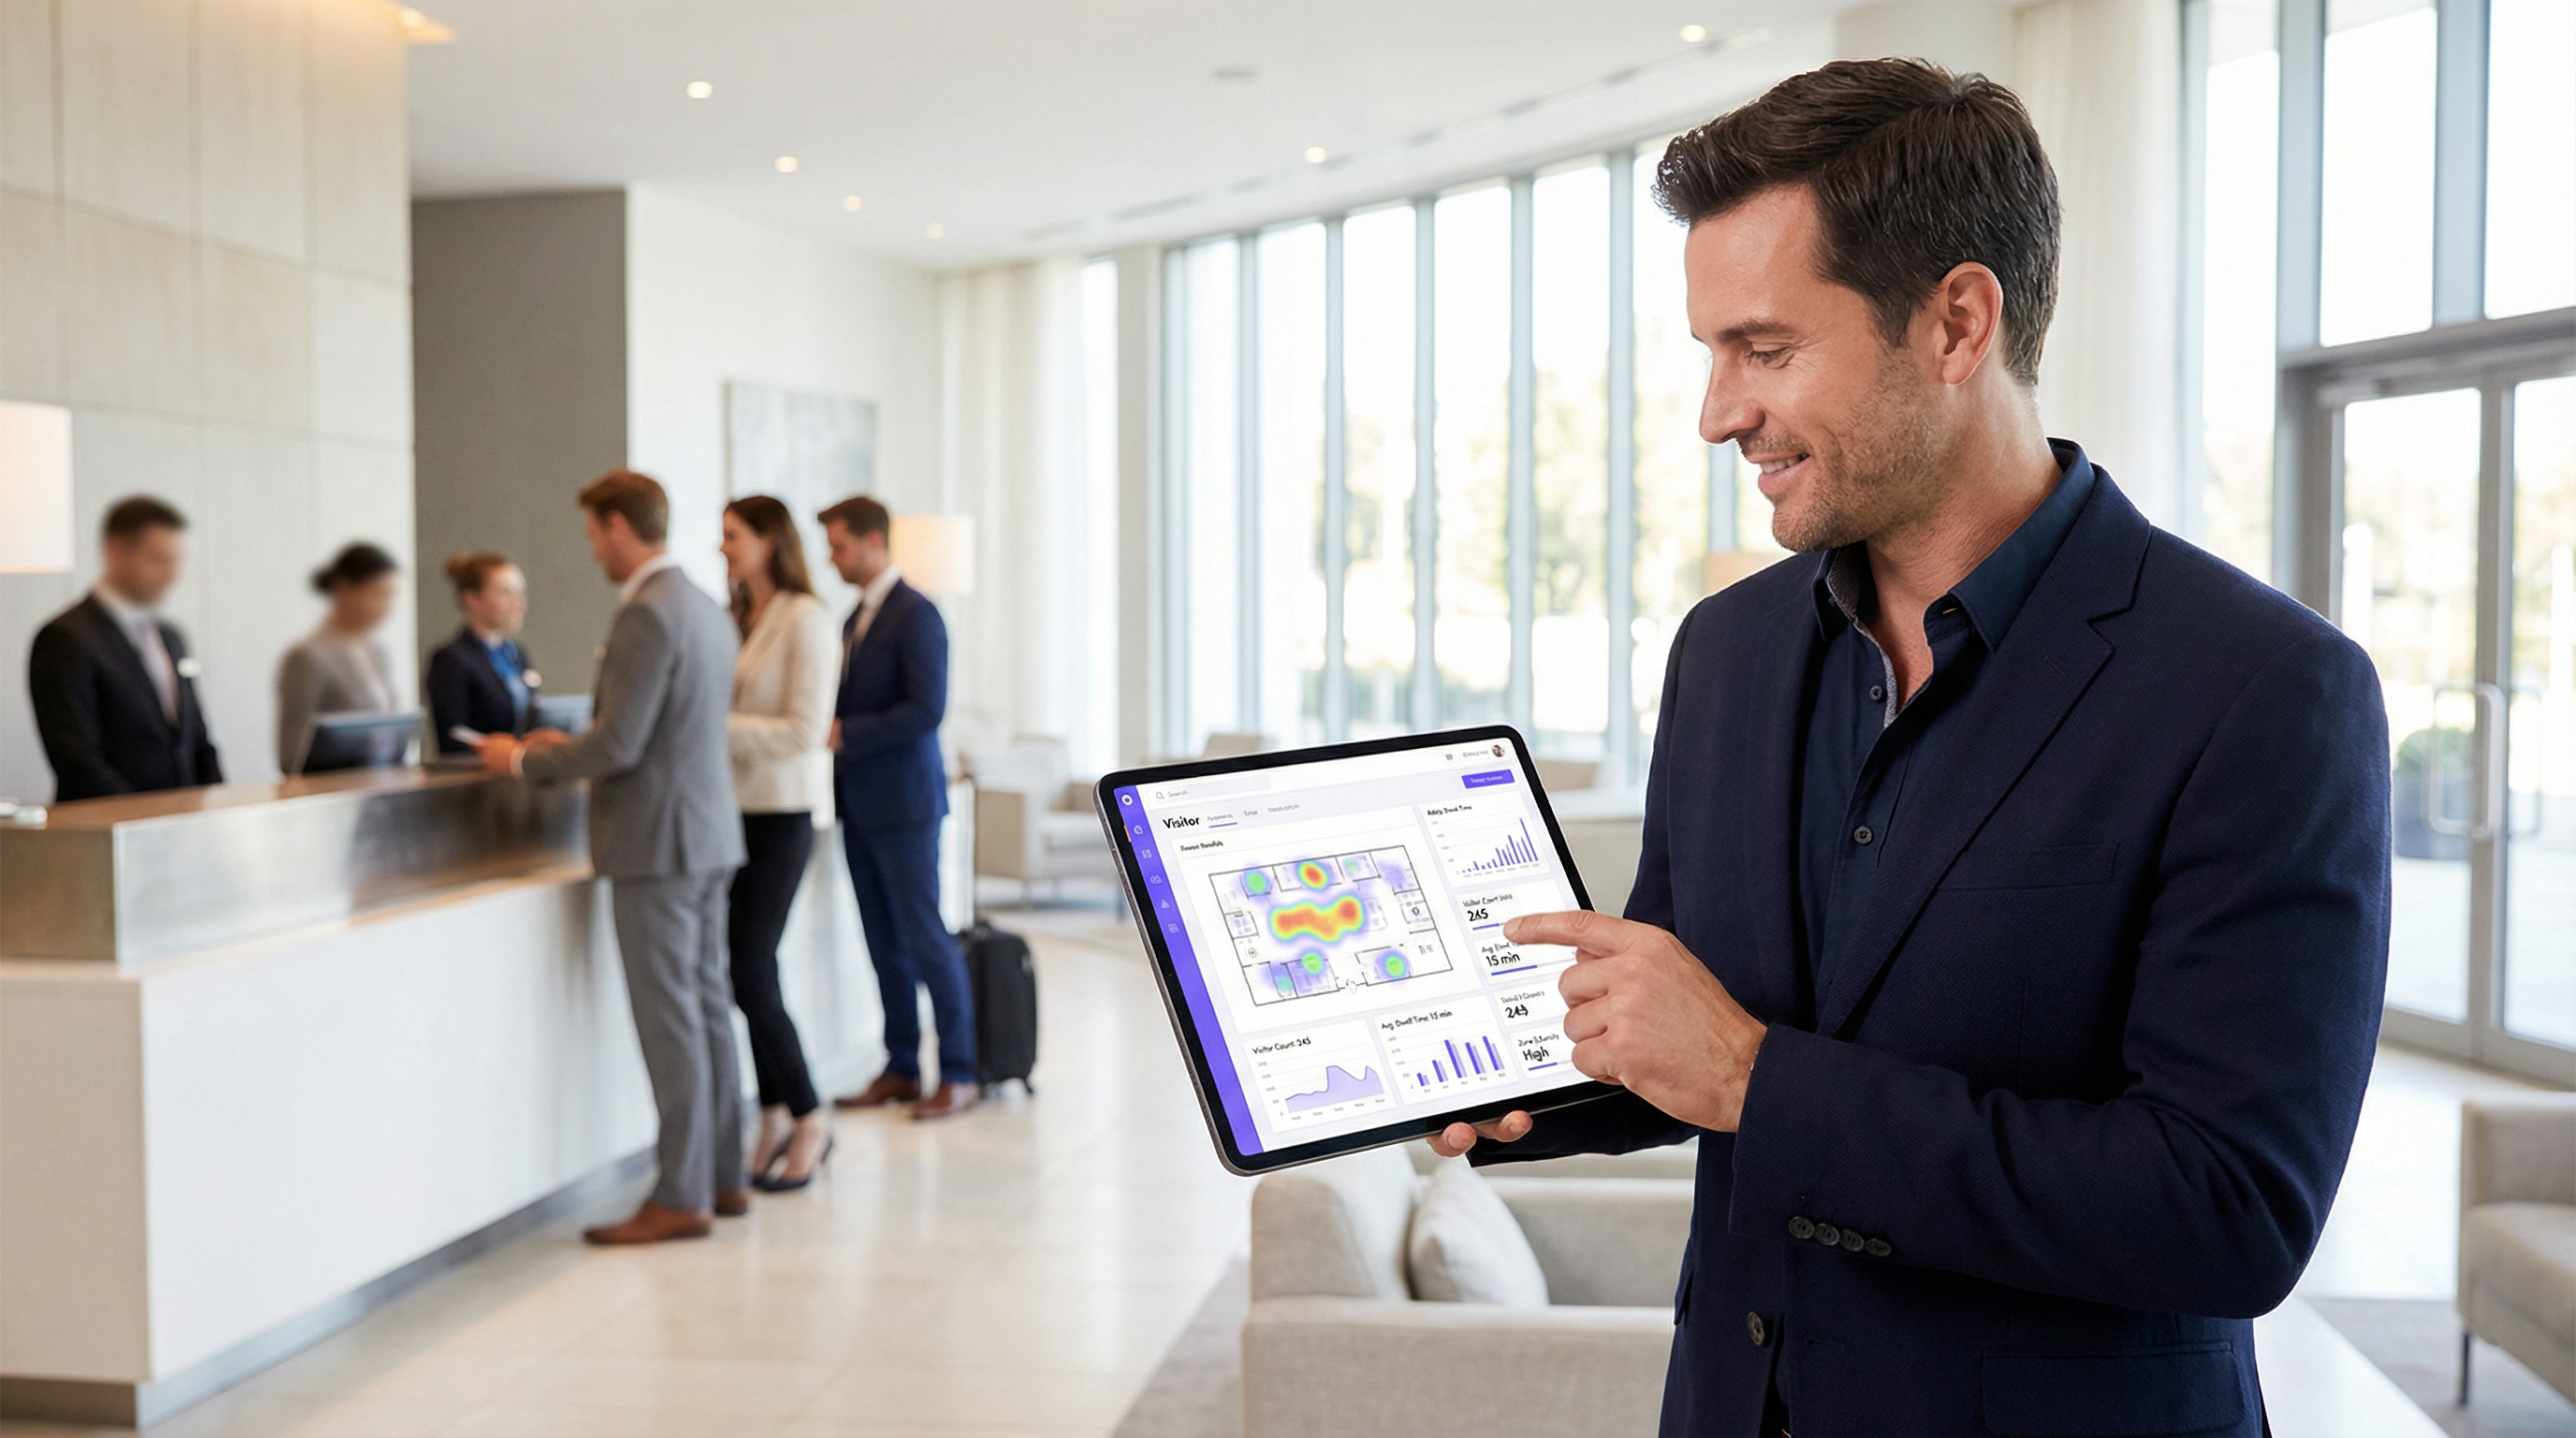
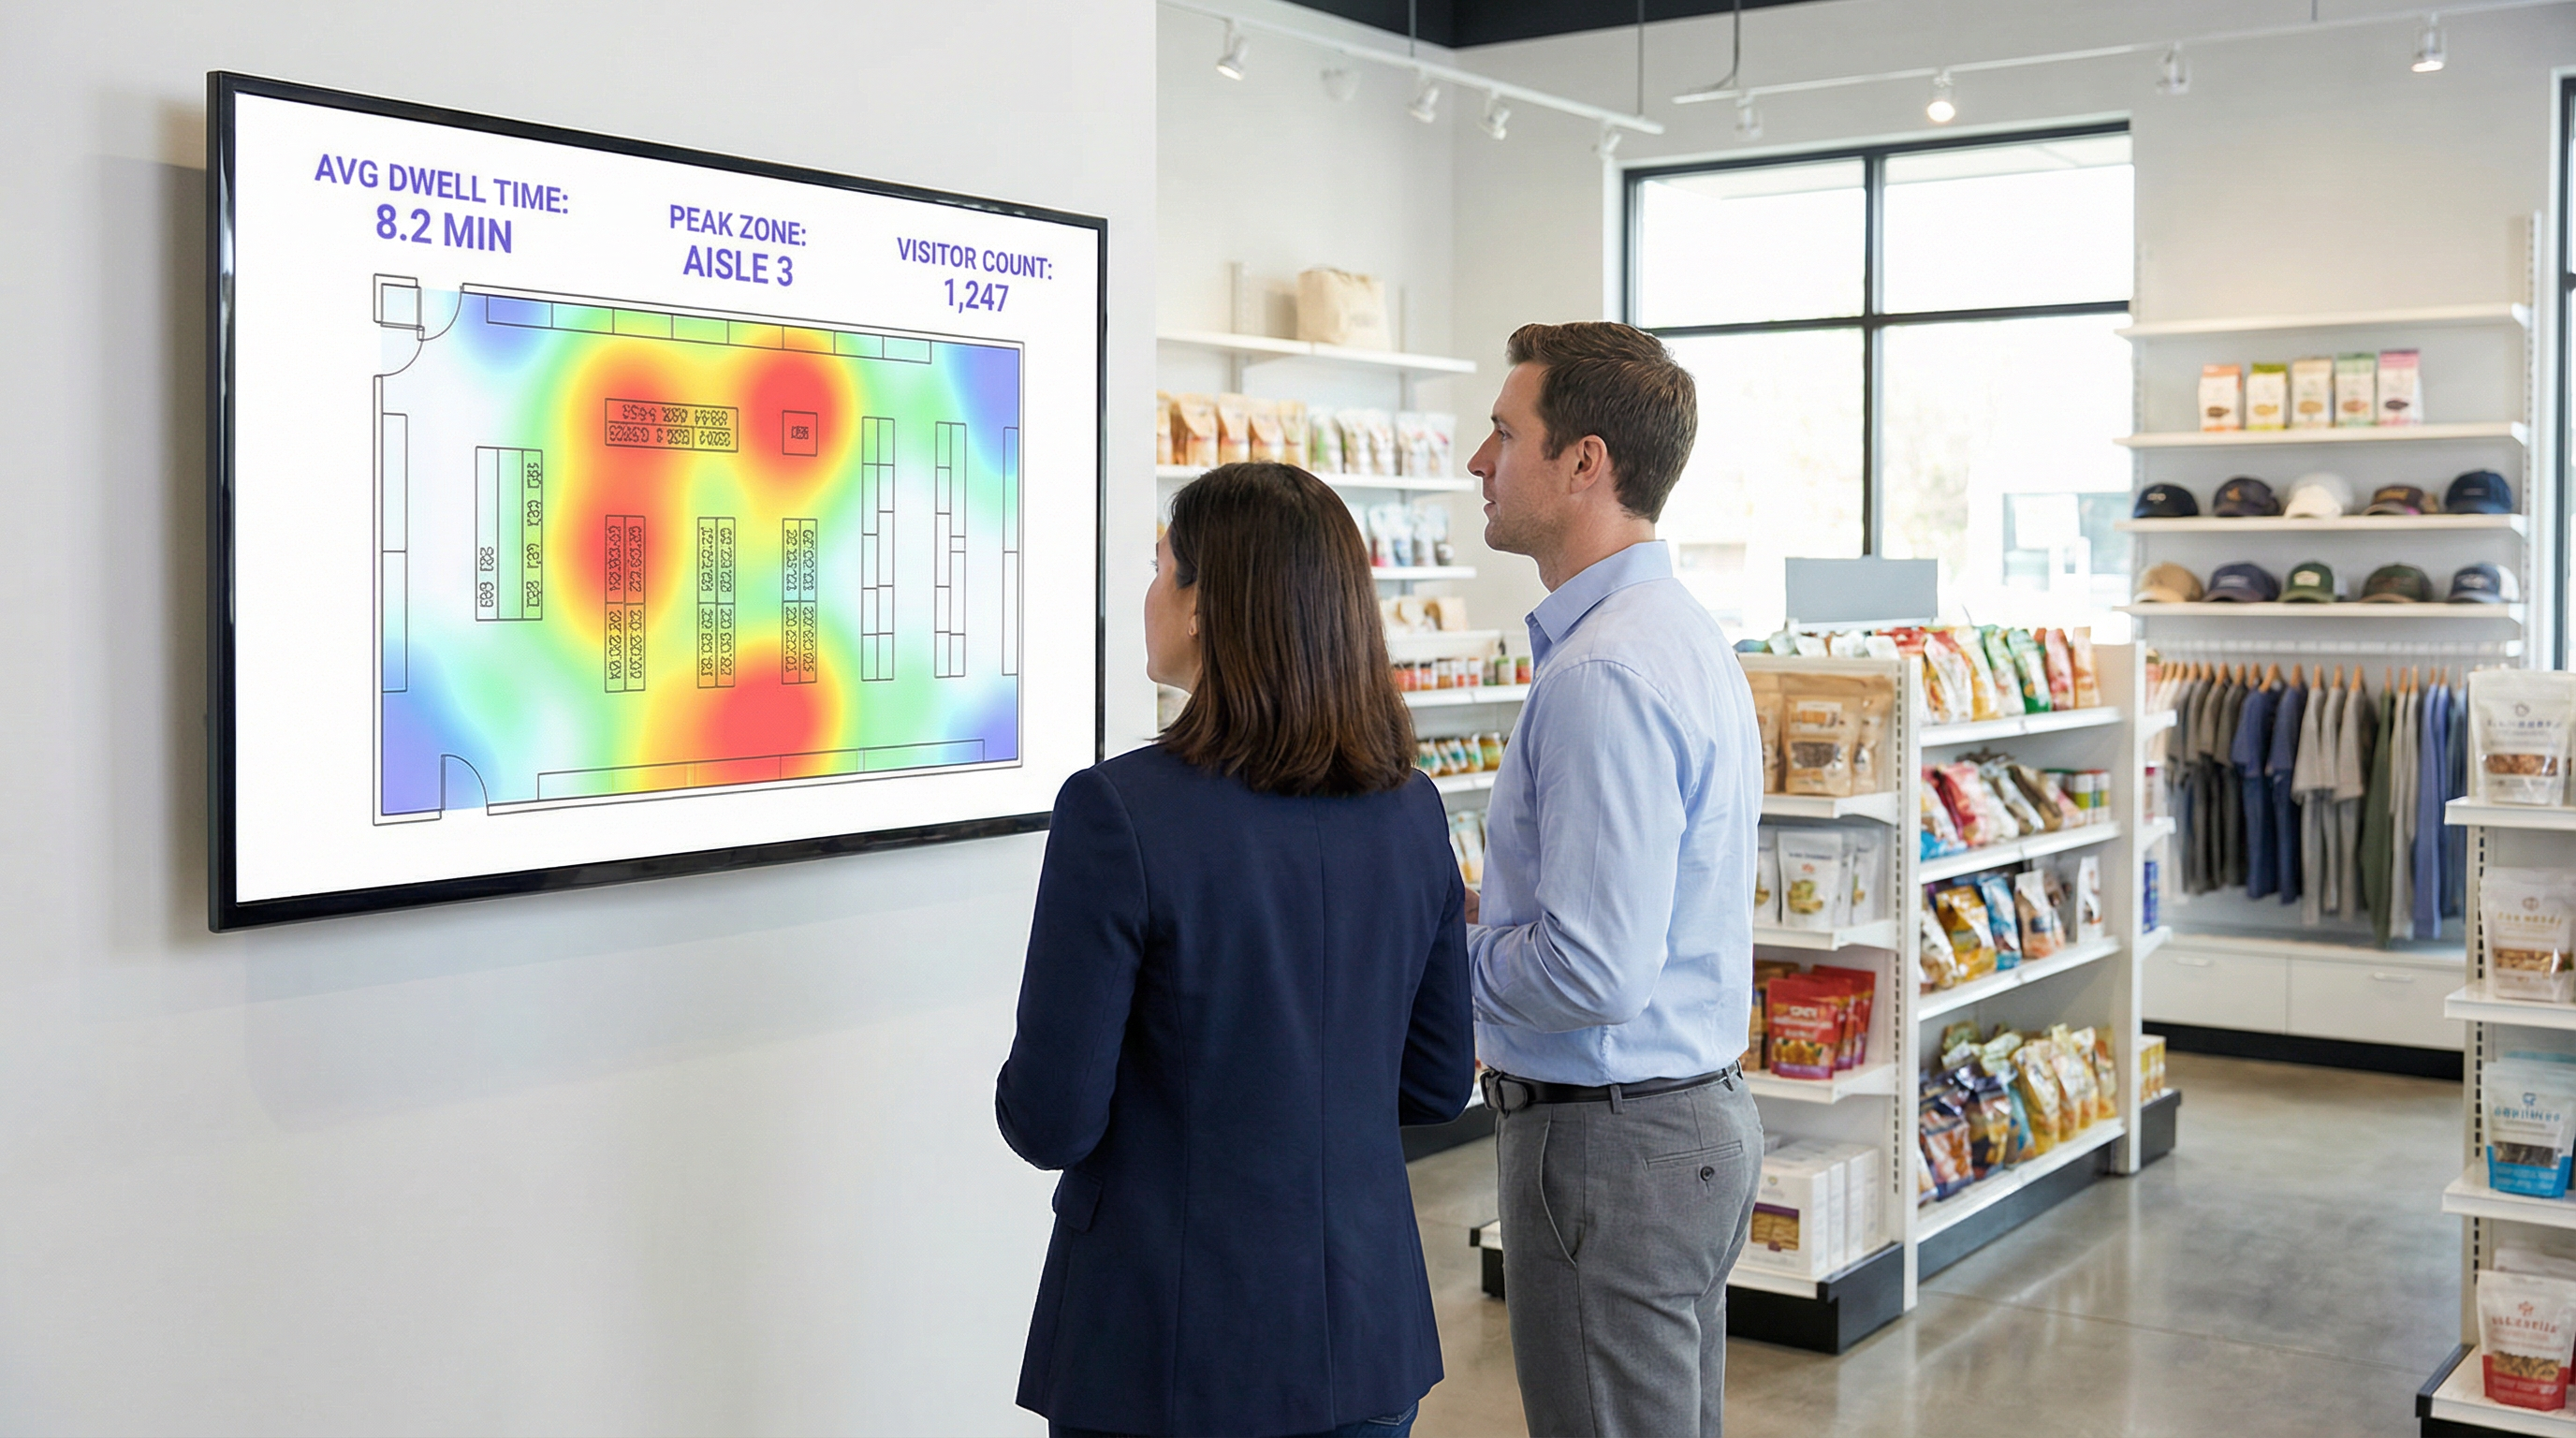
- Analisi della posizione e delle zone: una volta connesso, la posizione del dispositivo può essere tracciata con maggiore precisione. La piattaforma monitora continuamente l'RSSI dagli AP con cui il dispositivo sta comunicando. Ciò consente un'analisi dettagliata basata sulle zone: quante persone si trovano nella hall rispetto alla caffetteria, quanto tempo rimangono in ciascuna area e il flusso di traffico tra le zone. Questi sono i dati che alimentano le mappe di calore (heatmap) in tempo reale e l'analisi dei percorsi.
- Arricchimento dei dati di prima parte: il Captive Portal è un asset strategico fondamentale. Offrendo l'autenticazione tramite social login (es. Facebook, LinkedIn), e-mail o un semplice modulo, la sede può, con il consenso esplicito dell'utente, collegare l'indirizzo MAC anonimo a un'identità reale o a un profilo demografico. Questo trasforma i dati da conteggi anonimi dell'affluenza in ricchi dati di prima parte sui clienti, che possono essere utilizzati per il marketing personalizzato e l'integrazione CRM, in piena conformità con standard come il GDPR. [2]
Guida all'implementazione
Il successo dell'implementazione della WiFi analytics dipende tanto dalla progettazione fisica della rete e dalla strategia dei dati quanto dalla configurazione del software.
Fase 1: Posizionamento degli AP e audit della densità
Il layout degli AP esistente potrebbe essere ottimizzato per la copertura, non per l'analisi. Per un tracciamento accurato della posizione, è necessaria una maggiore densità di AP per consentire una triangolazione efficace.
- Progettazione basata solo sulla copertura: gli AP sono posizionati per massimizzare la portata del segnale, il che spesso si traduce in una sovrapposizione minima tra le zone di copertura degli AP.
- Progettazione pronta per l'analisi: gli AP sono posizionati in modo da creare una sovrapposizione significativa. Un dispositivo in qualsiasi posizione dovrebbe essere rilevabile da almeno tre AP per un calcolo affidabile della posizione. Una best practice generale è puntare a un AP ogni 150-200 metri quadrati in aree aperte.
Fase 2: Configurazione dell'acquisizione dei dati
La piattaforma di analytics deve ricevere i dati dal controller di rete o direttamente dagli AP. Ciò comporta in genere la configurazione della rete per inoltrare i dati syslog o trap SNMP contenenti le informazioni rilevanti sulle probe request e sulle sessioni all'endpoint cloud di analytics. Assicurati che le regole del firewall consentano questo traffico in uscita.
Fase 3: Definizione di zone e planimetrie
Carica le planimetrie della tua sede nella piattaforma di analytics. Quindi, utilizzando gli strumenti forniti, disegna "zone" poligonali sulla mappa corrispondenti a distinte aree operative (es. 'Ingresso principale', 'Corsia 3', 'Area bar', 'Sala riunioni 1'). Questo è il passaggio di configurazione più critico per generare report significativi e specifici per il contesto.
Fase 4: Progettazione del Captive Portal e del flusso di consenso
Progetta il tuo Captive Portal non solo come un portale di accesso, ma come uno strumento di governance dei dati. In collaborazione con i tuoi team legali e di marketing:
- Redigi un'informativa sulla privacy chiara: spiega con un linguaggio semplice quali dati vengono raccolti (indirizzo MAC, posizione, orari delle sessioni) e per quale scopo (per migliorare le operazioni della sede, per il marketing).
- Implementa un consenso granulare: fornisci caselle di controllo separate ed esplicite per (a) accettare i termini per l'accesso alla rete e (b) acconsentire alla raccolta dei dati per analisi e marketing. Questo è un requisito fondamentale per la conformità al GDPR.
- Offri uno scambio di valore: aumenta i tassi di adesione offrendo un incentivo per la condivisione dei dati, come un buono sconto o l'accesso a contenuti premium.
Best Practice
- Filtra il personale e i dispositivi statici: assicurati di avere un processo per escludere gli indirizzi MAC dei dispositivi del personale e delle apparecchiature fisse (come smart TV o terminali di pagamento) dalle tue analisi. La maggior parte delle piattaforme consente di caricare un elenco di MAC da ignorare, impedendo che le tue stesse operazioni alterino i dati dei visitatori.
- Integrazione con altri sistemi: la vera potenza della WiFi analytics si realizza quando viene combinata con altre fonti di dati. L'integrazione con i sistemi Point-of-Sale (POS) consente di correlare il tempo di permanenza con la spesa. L'integrazione con il tuo CRM ti consente di collegare la cronologia delle visite ai profili dei clienti. Dai priorità alle piattaforme con API REST solide e ben documentate.
- Rispetta le policy di conservazione dei dati: stabilisci una chiara policy di conservazione dei dati basata sui requisiti legali (come il principio di limitazione della conservazione del GDPR) e sulle esigenze aziendali. I dati anonimizzati e aggregati possono essere conservati a tempo indeterminato, ma le informazioni di identificazione personale (PII) dovrebbero essere eliminate o anonimizzate automaticamente dopo un periodo definito (es. 24 mesi).
Risoluzione dei problemi e mitigazione dei rischi
- Problema: conteggi dei visitatori imprecisi: questo è spesso dovuto alla randomizzazione del MAC. Assicurati che la tua piattaforma disponga di una funzionalità specifica per affrontare questo problema. Se i conteggi sembrano ancora elevati, verifica se nei dati sono inclusi dispositivi del personale o statici.
- Problema: scarsa precisione della posizione: questo indica quasi sempre una densità di AP insufficiente o un posizionamento non ottimale. Conduci un sopralluogo per identificare le lacune di copertura e le aree in cui un dispositivo può essere 'visto' solo da uno o due AP.
- Rischio: mancata conformità al GDPR/CCPA: il rischio maggiore è un processo di consenso configurato in modo errato. Controlla regolarmente il flusso di lavoro del tuo Captive Portal per assicurarti che soddisfi gli standard più recenti per un consenso esplicito e informato. Assicurati che il fornitore della piattaforma possa fornire un Data Processing Addendum (DPA) che lo impegni a una gestione dei dati conforme. [3]
- Rischio: violazione della sicurezza dei dati: la connessione tra la tua rete e il cloud di analytics deve essere sicura. Verifica che i dati siano crittografati in transito (utilizzando TLS 1.2 o versioni successive) e a riposo. La tua piattaforma dovrebbe supportare anche il controllo degli accessi basato sui ruoli (RBAC) per garantire che gli utenti possano vedere solo i dati rilevanti per il loro ruolo.
ROI e impatto sul business
Misurare il ritorno sull'investimento di una piattaforma di WiFi analytics implica il monitoraggio dei miglioramenti nelle metriche operative chiave.
- Retail: correla il tempo di permanenza in reparti specifici con i dati di vendita del tuo POS. Un aumento del 10% del tempo di permanenza nel reparto elettronica che si correla a un aumento del 2% delle vendite per quella categoria fornisce un ROI chiaro. Utilizza i dati sull'affluenza per eseguire test A/B sui layout del negozio e misurare l'impatto sul flusso dei visitatori e sulla scoperta dei prodotti.
- Hospitality: ottimizza il personale in hall, bar e ristoranti in base ai dati di occupazione storici e in tempo reale. Un hotel può evitare un eccesso di personale durante i periodi di calma e prevenire il degrado del servizio durante i picchi imprevisti, portando a risparmi diretti sui costi del personale e a una maggiore soddisfazione degli ospiti.
- Centri congressi: fornisci agli sponsor dati verificabili sull'affluenza e sul tempo di permanenza intorno ai loro stand, creando un nuovo flusso di entrate. Utilizza i dati delle sessioni delle sale riunioni per orientare la programmazione di eventi futuri, concentrandoti sugli argomenti che generano il maggiore coinvolgimento.
[1] IEEE Standards Association. (2020). IEEE 802.11-2020 - IEEE Standard for Information Technology. https://standards.ieee.org/standard/802_11-2020.html [2] General Data Protection Regulation (GDPR). (2018). Regulation (EU) 2016/679 of the European Parliament and of the Council. https://gdpr-info.eu/ [3] Information Commissioner's Office (ICO). (2021). Guide to the General Data Protection Regulation (GDPR). https://ico.org.uk/for-organisations/guide-to-data-protection/guide-to-the-general-data-protection-regulation-gdpr/
Termini chiave e definizioni
Guest WiFi Analytics
The process of capturing, analysing, and interpreting data from guest WiFi networks to understand visitor behaviour in a physical space.
IT teams use this to transform the WiFi network from a cost centre into a source of business intelligence that informs operational decisions.
WiFi Footfall Tracking
The use of WiFi signals (specifically probe requests and session data) to measure the number of people entering a venue or specific zone and the paths they take.
Operations managers use this data to understand visitor journeys, identify bottlenecks, and optimise venue layouts without needing separate people-counting hardware.
Dwell Time
The total amount of time a visitor's device is detected within a venue or a specific predefined zone during a single visit.
This is a primary KPI for engagement. In retail, longer dwell time often correlates with higher spend. In hospitality, it helps measure the utilisation of amenities like bars and lounges.
MAC Address
A unique hardware identifier assigned to a device's network interface. It is the primary identifier used to track a device, even before it connects to a network.
While essential for tracking, IT teams must be aware of MAC randomisation and ensure their analytics platform can account for it to avoid inaccurate visitor counts.
RSSI (Received Signal Strength Indicator)
A measurement of the power present in a radio signal received by an access point from a device. The stronger the signal, the closer the device is assumed to be.
This is the core data point used for location triangulation. Network architects need to ensure sufficient AP density for reliable RSSI readings from multiple points.
Captive Portal
A web page that a user must view and interact with before being granted access to a public WiFi network.
For IT and marketing, this is the strategic point for enforcing terms, gaining GDPR-compliant consent for data collection, and capturing first-party data like email addresses.
MAC Randomisation
A privacy feature in modern operating systems (iOS, Android) that periodically changes the MAC address a device uses for WiFi scanning to prevent passive tracking.
This is the single biggest technical challenge for accurate footfall counting. A key task for network architects is to select an analytics platform that has a proven mechanism for mitigating its effects.
Zone Analytics
The analysis of visitor behaviour within predefined virtual areas (zones) of a venue, such as movement between zones and dwell time per zone.
Venue operators use this to get granular insights. Instead of just knowing total visitors, they can compare the performance of 'Aisle 1' vs. 'Aisle 2' or see how many lobby visitors proceed to the restaurant.
Casi di studio
A 200-room hotel wants to reduce lobby congestion during the peak check-in window (3-5 PM) and improve the guest experience.
- Deploy WiFi Analytics: Ensure AP density in the lobby, entrance, and bar areas meets the 3-AP visibility rule. Define zones for 'Check-in Queue', 'Lobby Seating', and 'Bar Entrance'. 2. Data Collection (1 Week): Collect baseline data on visitor flow and dwell times during the 3-5 PM window. 3. Analysis: The analytics reveal that dwell time in the 'Check-in Queue' zone peaks at 15 minutes, and footfall from the entrance flows directly to the queue, bypassing the lobby bar. 4. Intervention: The hotel implements a mobile check-in station in the 'Lobby Seating' area and updates the captive portal to promote a 'skip the queue' message with a link to the hotel app. 5. Measure & Iterate: Post-intervention data shows queue dwell time has dropped to 8 minutes, and footfall to the bar area from the entrance has increased by 20%.
A retail chain is redesigning its flagship store and wants to validate that the new layout improves product discovery and customer engagement.
- Baseline Analysis: Before the redesign, use WiFi analytics to map the most common customer journeys and generate a footfall heatmap. Identify which zones have the highest and lowest dwell times. 2. Post-Redesign Analysis: After the new layout is implemented, conduct the same analysis. 3. Comparative Reporting: Compare the before-and-after heatmaps and journey flows. The new layout is successful if: (a) footfall is more evenly distributed, indicating better discovery; (b) dwell time has increased in high-margin product zones; and (c) the percentage of visitors who only visit the entrance zone (bouncing) has decreased. 4. POS Integration: Correlate the increase in dwell time in a specific zone (e.g., 'Premium Denim') with sales data for that category to calculate the direct revenue impact of the layout change.
Analisi degli scenari
Q1. A large conference is experiencing complaints about overcrowding in the corridors between sessions. How would you use WiFi analytics to diagnose the problem and propose a data-driven solution?
💡 Suggerimento:Think about using time-series data for specific zones and correlating it with the event schedule.
Mostra l'approccio consigliato
First, define the corridor areas as distinct zones in the analytics platform. Then, analyse the footfall and device density metrics for these zones, specifically in the 15-minute windows before and after major keynote sessions. This will quantify the congestion peaks. The solution would be to present this data to the event organisers and recommend staggering the session end times by 10-15 minutes for adjacent large halls to smooth out the flow of attendees. The success of this change can be measured by a reduction in peak device density in the corridor zones during the next event.
Q2. A retail store's marketing team wants to prove the ROI of a new in-store digital signage campaign. How can they use guest WiFi analytics to measure the campaign's impact on footfall and dwell time?
💡 Suggerimento:The key is to isolate the variable. You need to compare behaviour in the target zone before and during the campaign.
Mostra l'approccio consigliato
Define a zone around the new digital signage. Establish a baseline by measuring the average dwell time and the percentage of total store visitors who enter that zone for a two-week period before the campaign starts. Once the campaign is active, continue to measure the same metrics. The ROI can be demonstrated by showing a statistically significant increase in either dwell time within the zone (people are stopping to watch) or the capture rate of the zone (more people are being drawn to the area). For a more advanced analysis, integrate with POS data to see if the increased engagement correlates with a sales lift for the promoted products.
Q3. A hotel manager has noticed a 15% drop in bar revenue over the last quarter but overall visitor numbers are stable. How could they use WiFi analytics to investigate potential causes related to visitor behaviour?
💡 Suggerimento:This requires looking at visitor journeys and flow patterns, not just isolated zone data.
Mostra l'approccio consigliato
The investigation should focus on visitor journey analysis. Define zones for the lobby, reception, lifts, and the bar. Use the platform's flow analysis tools to answer two questions: 1. What percentage of visitors who enter the lobby also enter the bar zone? Is this percentage trending down over the last quarter? 2. Of the visitors who do enter the bar, is their average dwell time decreasing? A drop in the lobby-to-bar conversion rate might suggest an issue with signage or visibility. A decrease in dwell time for those who do enter the bar might suggest a problem with service, atmosphere, or offerings. The data pinpoints whether the problem is attracting guests or retaining them.
Punti chiave
- ✓Your guest WiFi is a powerful sensor network capable of generating deep business intelligence.
- ✓WiFi analytics captures both passive (probe requests) and active (connected sessions) data to build a complete picture of visitor behaviour.
- ✓Accurate footfall and dwell time analysis depends on strategic AP placement with sufficient density for triangulation (the '3-AP rule').
- ✓MAC randomisation is a critical technical challenge; your analytics platform must have a robust mechanism to handle it for accurate counting.
- ✓The captive portal is your gateway for gaining GDPR-compliant consent and enriching anonymous data with valuable first-party demographic information.
- ✓The highest ROI comes from integrating WiFi analytics data into core operational workflows for staffing, marketing, and space utilisation.
- ✓Compliance is non-negotiable. Your consent workflow must be explicit, and your data handling must adhere to GDPR/CCPA principles.
