Wie Gäste-WiFi Standortanalysen und Besucherfrequenzmessung unterstützt
This guide provides a technical and operational framework for leveraging guest WiFi to gain deep insights into visitor behaviour within physical venues. It details how to capture and analyse data for footfall tracking and dwell time calculation, enabling IT and operations leaders to make data-driven decisions that optimize staffing, enhance venue layout, and increase business ROI.
🎧 Diesen Leitfaden anhören
Transkript anzeigen
Management Summary
Für Betreiber von Veranstaltungsorten und IT-Führungskräfte ist Gäste-WiFi nicht länger nur eine reine Einrichtung; es ist eine entscheidende Quelle für Business Intelligence. Über die Bereitstellung von Internetzugang hinaus erfasst eine moderne WiFi-Infrastruktur einen umfangreichen Datenstrom, der aufzeigt, wie sich Besucher durch einen physischen Raum bewegen und mit ihm interagieren. Dieser Leitfaden bietet einen technischen und operativen Rahmen, um zu verstehen, wie Gäste-WiFi für fortschrittliche Standortanalysen genutzt werden kann, mit besonderem Fokus auf Besucherfrequenzmessung (Footfall Tracking), Verweildauerberechnung und die Analyse des Besucherverhaltens. Durch die Umwandlung von WiFi-Rohdaten in verwertbare Erkenntnisse können Unternehmen ihre Personalplanung optimieren, das Layout des Standorts verbessern, den Marketing-ROI steigern und das gesamte Besuchererlebnis aufwerten. Diese Referenz richtet sich an IT-Manager, Netzwerkarchitekten und Operations Directors, die ihre WiFi-Intelligence-Plattform bereitstellen, verwalten und Mehrwert daraus schöpfen müssen. Sie behandelt die zugrunde liegende Technologie, Best Practices für die Implementierung, Compliance-Überlegungen gemäß GDPR sowie Methoden zur Messung der geschäftlichen Auswirkungen – von theoretischen Konzepten bis hin zu praktischen Bereitstellungsrichtlinien.
Technischer Deep-Dive
Um zu verstehen, wie WiFi-Analysen funktionieren, muss man die Daten betrachten, die in den verschiedenen Phasen der Interaktion eines Geräts mit dem Netzwerk generiert werden. Der Prozess beginnt bereits, bevor sich ein Benutzer authentifiziert, und liefert eine grundlegende Ebene von Präsenz- und Bewegungsdaten.
Passive Datenerfassung: Probe Requests
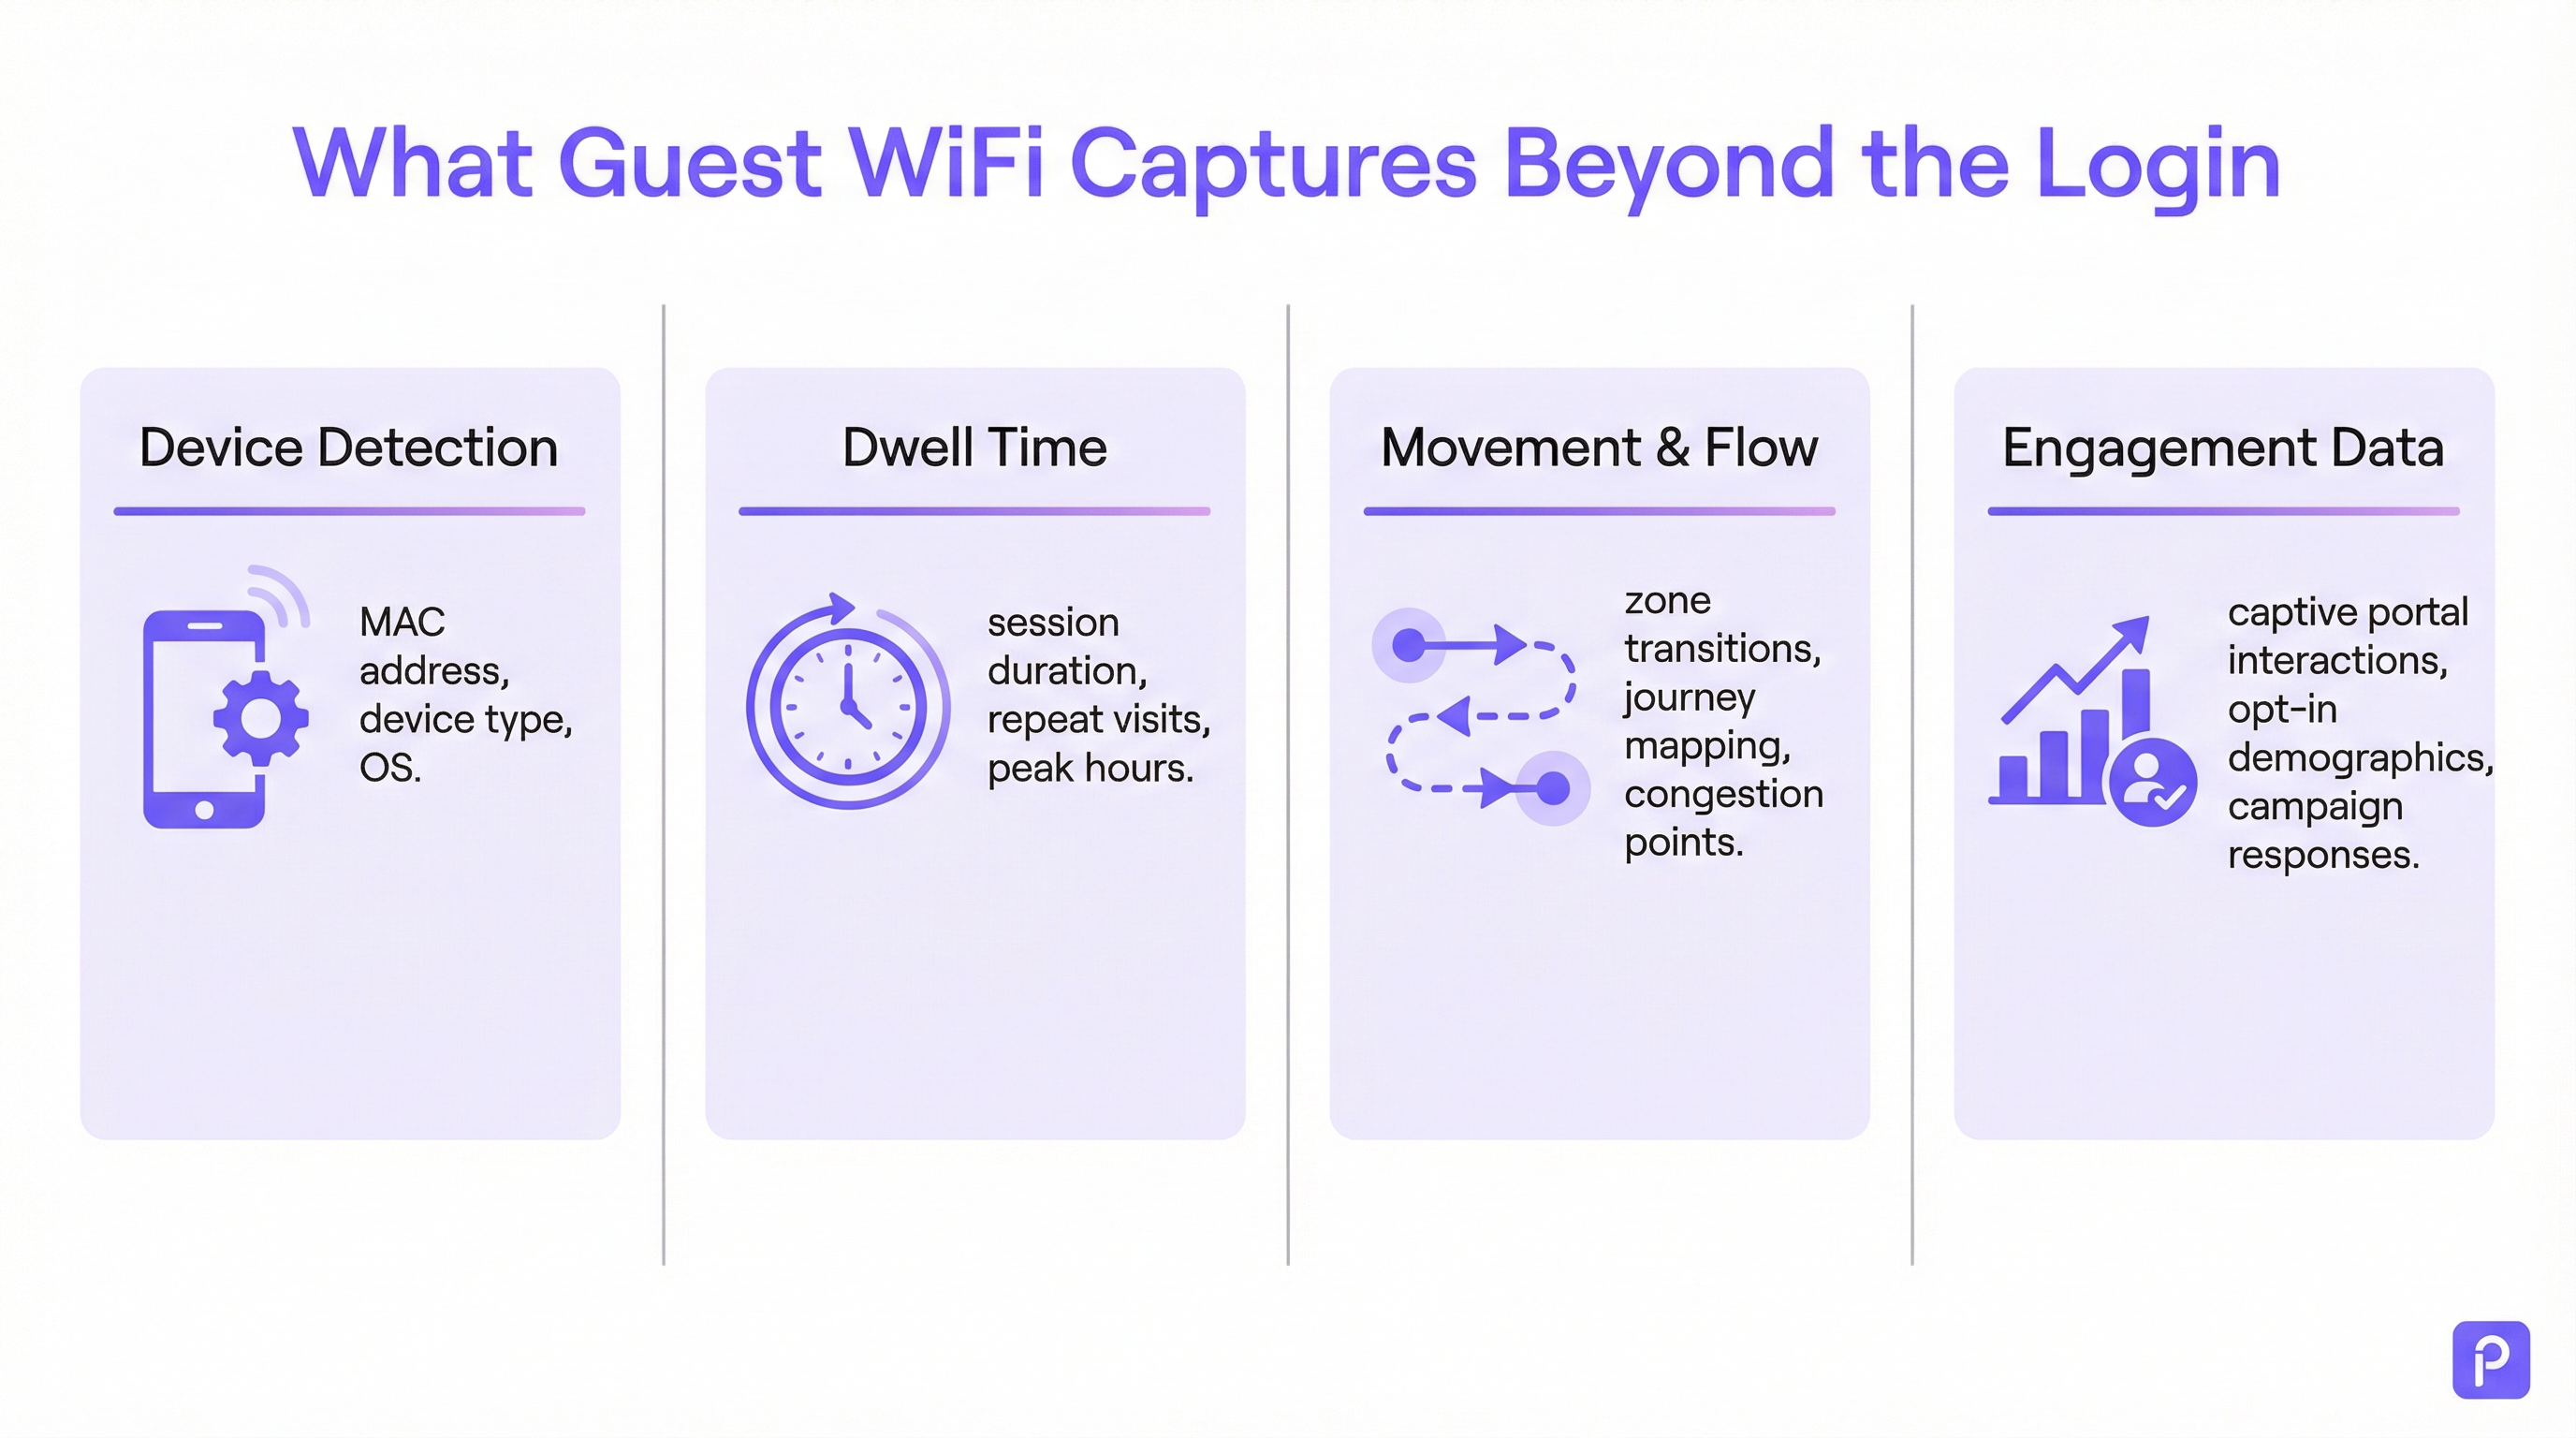
Jedes WiFi-fähige Gerät (Smartphone, Tablet, Laptop) sendet regelmäßig sogenannte „Probe Requests“ aus. Dies sind kleine Datenpakete, die vom Gerät gesendet werden, um WiFi-Netzwerke in der Nähe zu entdecken. Entscheidend ist, dass jeder Probe Request die eindeutige Media Access Control (MAC)-Adresse des Geräts enthält. Selbst wenn sich ein Gerät nie mit dem Netzwerk verbindet, können Access Points (APs) innerhalb des Standorts diese Probe Requests erkennen und protokollieren.
- Was erfasst wird: MAC-Adresse, Received Signal Strength Indicator (RSSI) und der Zeitstempel der Erkennung.
- Wie es genutzt wird: Durch die Triangulation des RSSI von mehreren APs kann das System den Standort des Geräts annähernd bestimmen. Ein kontinuierlicher Strom dieser Erkennungen ermöglicht es der Plattform, den Weg eines Geräts durch den Standort zu verfolgen. Dies bildet die Grundlage der Besucherfrequenzanalyse für alle WiFi-fähigen Geräte in Reichweite, nicht nur für diejenigen, die mit dem Netzwerk verbunden sind.
- Die Herausforderung der MAC-Randomisierung: Seit iOS 14 und Android 10 verwenden Geräte zum Schutz der Privatsphäre der Nutzer häufig eine randomisierte oder private MAC-Adresse für Probe Requests. Dies kann dazu führen, dass ein einzelnes Gerät mehrfach gezählt wird. Enterprise-Analytics-Plattformen setzen hochentwickelte Algorithmen ein, um diese randomisierten Adressen zu deduplizieren, indem sie andere Signaleigenschaften und zeitliche Analysen nutzen, um eine wahrscheinliche Journey für ein einzelnes Gerät zusammenzustellen. [1]
Aktive Datenerfassung: Verbundene Sitzungen
Wenn sich ein Besucher aktiv mit dem Gäste-WiFi verbindet, typischerweise über ein Captive Portal, wird ein wesentlich umfangreicherer Datensatz verfügbar. Der Authentifizierungsprozess erstellt eine formelle Sitzung mit einem definierten Anfang und Ende.
- Berechnung der Verweildauer: Die grundlegendste Metrik, die aus einer verbundenen Sitzung abgeleitet wird, ist die Verweildauer. Sie wird als Zeitdifferenz zwischen dem Sitzungsbeginn (Authentifizierung) und dem Sitzungsende (Trennung oder Timeout) berechnet. Eine robuste Plattform geht noch weiter und fasst mehrere kurze Sitzungen desselben Geräts innerhalb eines bestimmten Zeitfensters zu einem einzigen „Besuch“ zusammen, was ein genaueres Bild der insgesamt am Standort verbrachten Zeit liefert.
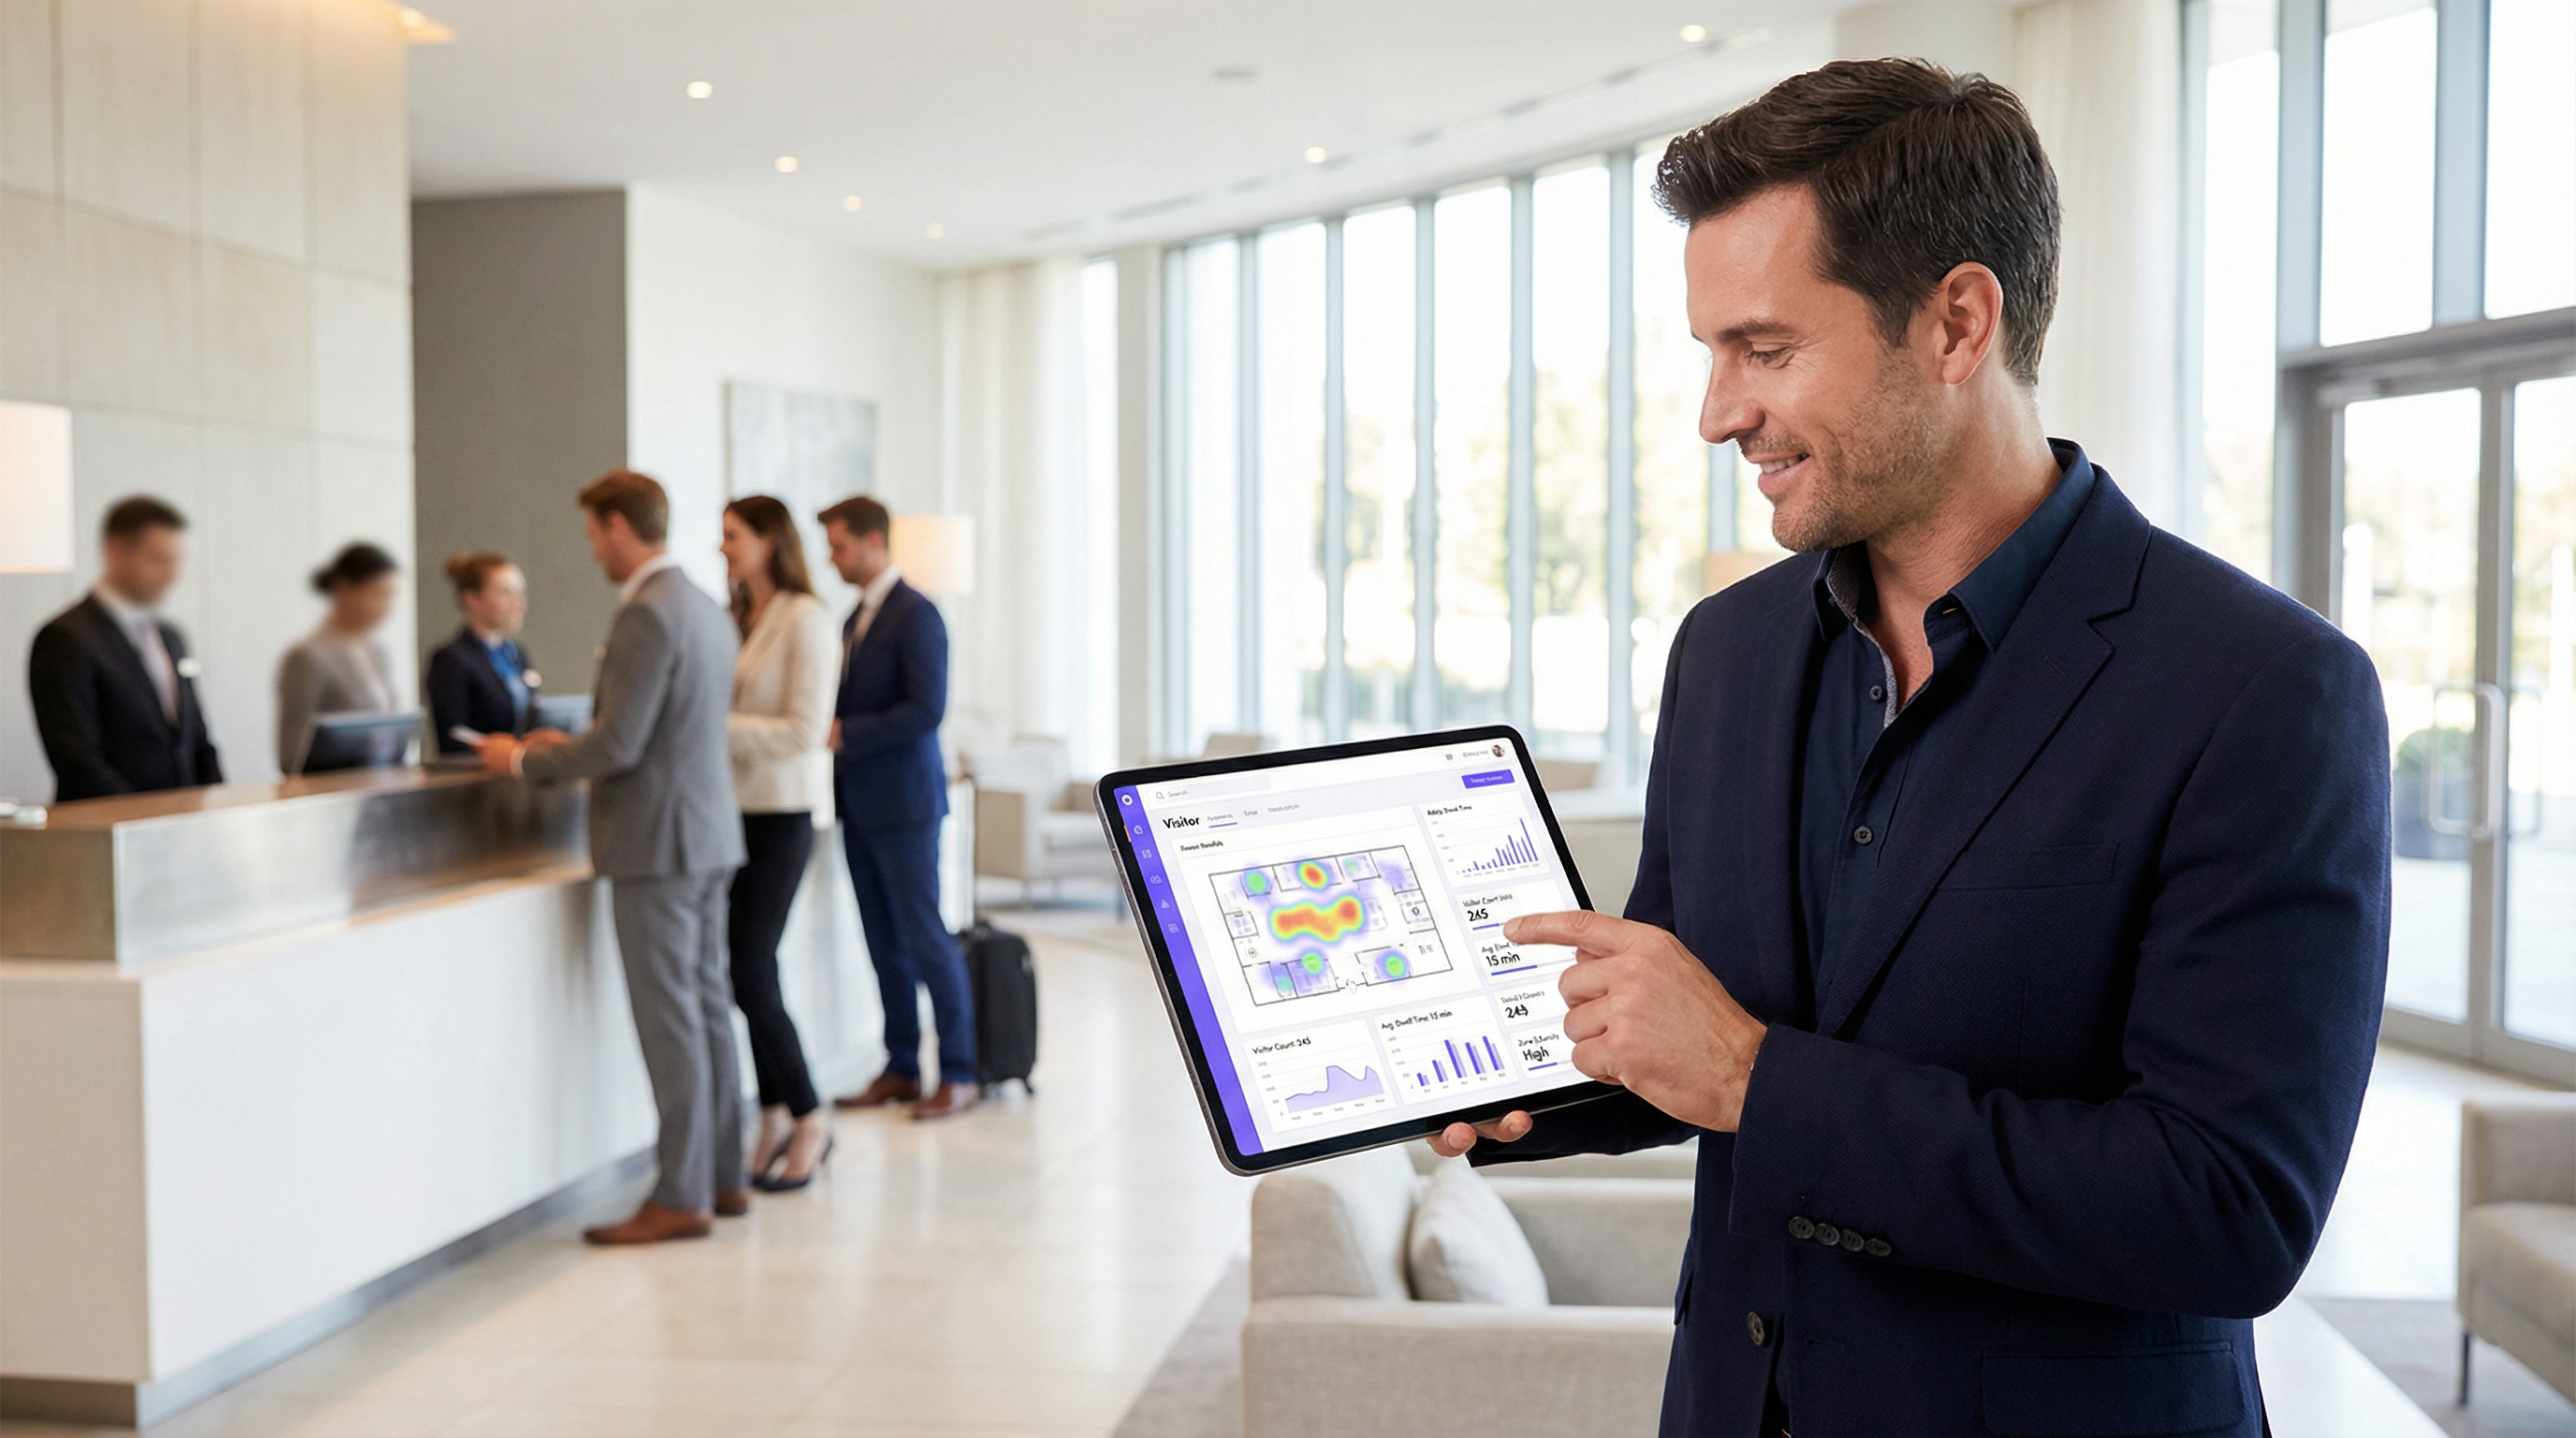
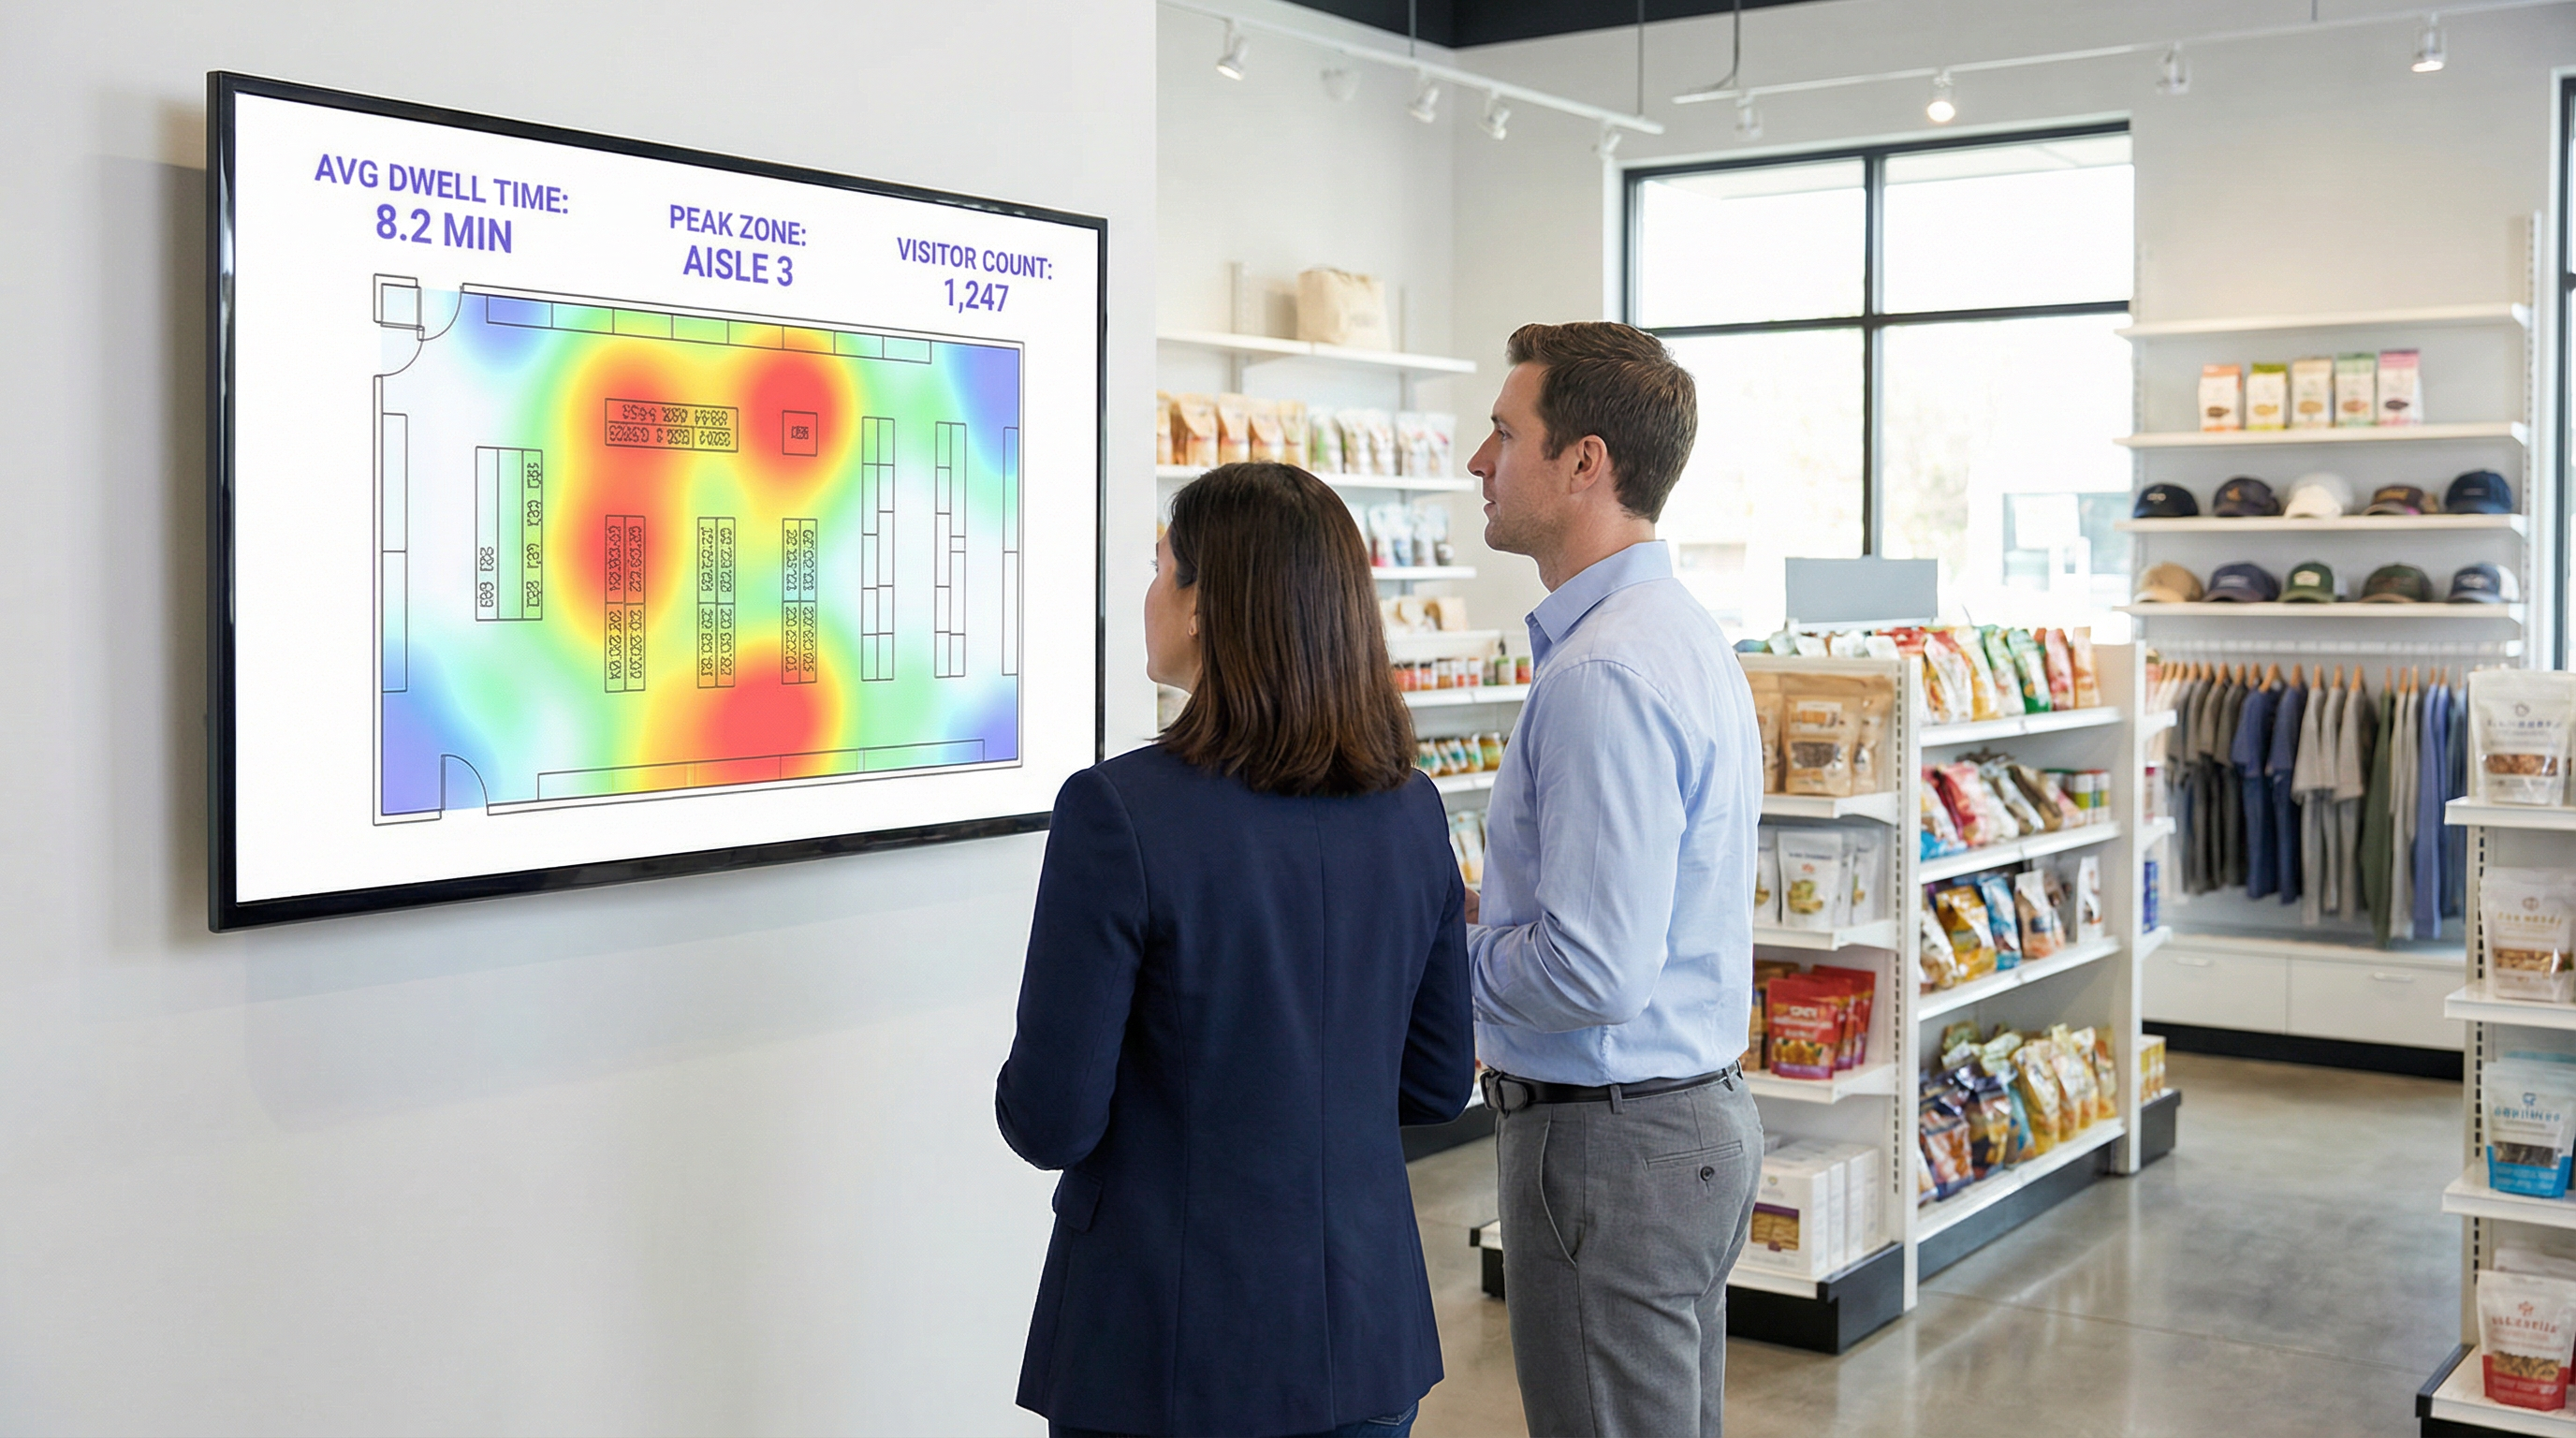
- Standort- & Zonenanalysen: Sobald eine Verbindung besteht, kann der Standort des Geräts mit größerer Genauigkeit verfolgt werden. Die Plattform überwacht kontinuierlich den RSSI der APs, mit denen das Gerät kommuniziert. Dies ermöglicht detaillierte zonenbasierte Analysen: Wie viele Personen befinden sich in der Lobby im Vergleich zum Café, wie lange bleiben sie in jedem Bereich und wie ist der Verkehrsfluss zwischen den Zonen. Dies sind die Daten, die Echtzeit-Heatmaps und Journey-Analysen antreiben.
- Anreicherung von First-Party-Daten: Das Captive Portal ist ein entscheidender strategischer Vermögenswert. Durch das Angebot einer Authentifizierung via Social Login (z. B. Facebook, LinkedIn), E-Mail oder einem einfachen Formular kann der Standort mit ausdrücklicher Zustimmung des Nutzers die anonyme MAC-Adresse mit einer realen Identität oder einem demografischen Profil verknüpfen. Dies verwandelt die Daten von anonymen Besucherzählungen in wertvolle First-Party-Kundendaten, die für personalisiertes Marketing und CRM-Integration genutzt werden können – vollständig konform mit Standards wie GDPR. [2]
Implementierungsleitfaden
Bei einer erfolgreichen Bereitstellung von WiFi-Analysen geht es ebenso sehr um das physische Netzwerkdesign und die Datenstrategie wie um die Softwarekonfiguration.
Schritt 1: Audit von AP-Platzierung und -Dichte
Ihr bestehendes AP-Layout ist möglicherweise auf Abdeckung optimiert, nicht auf Analysen. Für eine genaue Standortverfolgung ist eine höhere Dichte an APs erforderlich, um eine effektive Triangulation zu ermöglichen.
- Reines Abdeckungsdesign: APs werden so platziert, dass die Signalreichweite maximiert wird, was oft zu minimalen Überschneidungen zwischen den AP-Abdeckungszonen führt.
- Analysebereites Design: APs werden so platziert, dass signifikante Überschneidungen entstehen. Ein Gerät sollte an jedem beliebigen Standort von mindestens drei APs erkennbar sein, um eine zuverlässige Standortberechnung zu gewährleisten. Eine allgemeine Best Practice ist es, in offenen Bereichen einen AP pro 150-200 Quadratmeter anzustreben.
Schritt 2: Konfiguration der Datenaufnahme
Die Analyseplattform muss Daten von Ihrem Netzwerk-Controller oder direkt von den APs empfangen. Dies beinhaltet typischerweise die Konfiguration des Netzwerks zur Weiterleitung von Syslog- oder SNMP-Trap-Daten, welche die relevanten Probe-Request- und Sitzungsinformationen enthalten, an den Cloud-Endpunkt der Analyseplattform. Stellen Sie sicher, dass Ihre Firewall-Regeln diesen ausgehenden Datenverkehr zulassen.
Schritt 3: Definition von Zonen und Grundrissen
Laden Sie die Grundrisse Ihres Standorts in die Analyseplattform hoch. Zeichnen Sie dann mit den bereitgestellten Tools polygonale „Zonen“ über die Karte, die bestimmten operativen Bereichen entsprechen (z. B. ‚Haupteingang‘, ‚Gang 3‘, ‚Barbereich‘, ‚Besprechungsraum 1‘). Dies ist der wichtigste Konfigurationsschritt zur Erstellung aussagekräftiger, kontextspezifischer Berichte.
Schritt 4: Design von Captive Portal und Einwilligungs-Workflow
Gestalten Sie Ihr Captive Portal nicht nur als Login-Gate, sondern als Data-Governance-Tool. In Zusammenarbeit mit Ihren Rechts- und Marketingteams:
- Erstellen Sie eine klare Datenschutzerklärung: Erklären Sie in einfacher Sprache, welche Daten erfasst werden (MAC-Adresse, Standort, Sitzungszeiten) und zu welchem Zweck (zur Verbesserung des Betriebs am Standort, für Marketing).
- Implementieren Sie granulare Einwilligungen: Stellen Sie separate, explizite Kontrollkästchen bereit für (a) die Akzeptanz der Bedingungen für den Netzwerkzugang und (b) die Einwilligung zur Datenerfassung für Analysen und Marketing. Dies ist eine Kernanforderung für die GDPR-Compliance.
- Bieten Sie einen Werteaustausch: Erhöhen Sie die Opt-in-Raten, indem Sie einen Anreiz für die Datenfreigabe bieten, wie z. B. einen Rabattgutschein oder Zugang zu Premium-Inhalten.
Best Practices
- Filtern Sie Personal und statische Geräte: Stellen Sie sicher, dass Sie über einen Prozess verfügen, um die MAC-Adressen von Mitarbeitergeräten und fest installierten Geräten (wie Smart-TVs oder Zahlungsterminals) von Ihren Analysen auszuschließen. Die meisten Plattformen ermöglichen das Hochladen einer Liste zu ignorierender MAC-Adressen, um zu verhindern, dass Ihre eigenen Abläufe die Besucherdaten verfälschen.
- Integrieren Sie mit anderen Systemen: Die wahre Stärke von WiFi-Analysen zeigt sich, wenn sie mit anderen Datenquellen kombiniert werden. Die Integration mit Point-of-Sale (POS)-Systemen ermöglicht es Ihnen, die Verweildauer mit den Ausgaben zu korrelieren. Die Integration mit Ihrem CRM ermöglicht es Ihnen, die Besuchshistorie mit Kundenprofilen zu verknüpfen. Priorisieren Sie Plattformen mit robusten, gut dokumentierten REST-APIs.
- Halten Sie Richtlinien zur Datenaufbewahrung ein: Etablieren Sie eine klare Richtlinie zur Datenaufbewahrung basierend auf gesetzlichen Anforderungen (wie dem Prinzip der Speicherbegrenzung der GDPR) und geschäftlichen Anforderungen. Anonymisierte, aggregierte Daten können auf unbestimmte Zeit aufbewahrt werden, aber personenbezogene Daten (PII) sollten nach einem definierten Zeitraum (z. B. 24 Monate) automatisch gelöscht oder anonymisiert werden.
Fehlerbehebung & Risikominderung
- Problem: Ungenaue Besucherzählungen: Dies ist oft auf MAC-Randomisierung zurückzuführen. Stellen Sie sicher, dass Ihre Plattform über eine spezifische Funktion verfügt, um dies zu beheben. Wenn die Zählungen immer noch hoch erscheinen, untersuchen Sie, ob Personal oder statische Geräte in die Daten einbezogen werden.
- Problem: Schlechte Standortgenauigkeit: Dies deutet fast immer auf eine unzureichende AP-Dichte oder suboptimale Platzierung hin. Führen Sie eine Standortuntersuchung durch, um Abdeckungslücken und Bereiche zu identifizieren, in denen ein Gerät nur von ein oder zwei APs ‚gesehen‘ werden kann.
- Risiko: Fehlende GDPR/CCPA-Compliance: Das größte Risiko ist ein schlecht konfigurierter Einwilligungsprozess. Überprüfen Sie regelmäßig Ihren Captive Portal-Workflow, um sicherzustellen, dass er den neuesten Standards für eine ausdrückliche und informierte Einwilligung entspricht. Stellen Sie sicher, dass Ihr Plattformanbieter einen Auftragsverarbeitungsvertrag (AVV / DPA) bereitstellen kann, der ihn zu einer konformen Datenverarbeitung verpflichtet. [3]
- Risiko: Datensicherheitsverletzung: Die Verbindung zwischen Ihrem Netzwerk und der Analytics-Cloud muss sicher sein. Stellen Sie sicher, dass die Daten bei der Übertragung (mit TLS 1.2 oder höher) und im Ruhezustand verschlüsselt sind. Ihre Plattform sollte auch rollenbasierte Zugriffskontrolle (RBAC) unterstützen, um sicherzustellen, dass Benutzer nur die für ihre Rollen relevanten Daten sehen können.
ROI & Geschäftliche Auswirkungen
Die Messung des Return on Investment einer WiFi-Analyseplattform beinhaltet die Verfolgung von Verbesserungen bei wichtigen operativen Kennzahlen.
- Einzelhandel: Korrelieren Sie die Verweildauer in bestimmten Abteilungen mit den Verkaufsdaten Ihres POS. Ein Anstieg der Verweildauer in der Elektronikabteilung um 10 %, der mit einem Umsatzanstieg von 2 % in dieser Kategorie korreliert, liefert einen klaren ROI. Nutzen Sie Besucherfrequenzdaten für A/B-Tests von Ladenlayouts und messen Sie die Auswirkungen auf den Besucherstrom und die Produktentdeckung.
- Gastgewerbe: Optimieren Sie die Personalbesetzung in Lobbys, Bars und Restaurants basierend auf historischen und Echtzeit-Belegungsdaten. Ein Hotel kann Überbesetzung in ruhigen Zeiten vermeiden und Leistungseinbußen bei unerwarteten Spitzen verhindern, was zu direkten Einsparungen bei den Lohnkosten und einer verbesserten Gästezufriedenheit führt.
- Konferenzzentren: Stellen Sie Sponsoren verifizierbare Daten zur Besucherfrequenz und Verweildauer an ihren Ständen zur Verfügung und schaffen Sie so eine neue Einnahmequelle. Nutzen Sie Sitzungsdaten aus Breakout-Räumen als Grundlage für die zukünftige Veranstaltungsplanung und konzentrieren Sie sich auf Themen, die das meiste Engagement erzeugen.
[1] IEEE Standards Association. (2020). IEEE 802.11-2020 - IEEE Standard for Information Technology. https://standards.ieee.org/standard/802_11-2020.html [2] General Data Protection Regulation (GDPR). (2018). Regulation (EU) 2016/679 of the European Parliament and of the Council. https://gdpr-info.eu/ [3] Information Commissioner's Office (ICO). (2021). Guide to the General Data Protection Regulation (GDPR). https://ico.org.uk/for-organisations/guide-to-data-protection/guide-to-the-general-data-protection-regulation-gdpr/
Schlüsselbegriffe & Definitionen
Guest WiFi Analytics
The process of capturing, analysing, and interpreting data from guest WiFi networks to understand visitor behaviour in a physical space.
IT teams use this to transform the WiFi network from a cost centre into a source of business intelligence that informs operational decisions.
WiFi Footfall Tracking
The use of WiFi signals (specifically probe requests and session data) to measure the number of people entering a venue or specific zone and the paths they take.
Operations managers use this data to understand visitor journeys, identify bottlenecks, and optimise venue layouts without needing separate people-counting hardware.
Dwell Time
The total amount of time a visitor's device is detected within a venue or a specific predefined zone during a single visit.
This is a primary KPI for engagement. In retail, longer dwell time often correlates with higher spend. In hospitality, it helps measure the utilisation of amenities like bars and lounges.
MAC Address
A unique hardware identifier assigned to a device's network interface. It is the primary identifier used to track a device, even before it connects to a network.
While essential for tracking, IT teams must be aware of MAC randomisation and ensure their analytics platform can account for it to avoid inaccurate visitor counts.
RSSI (Received Signal Strength Indicator)
A measurement of the power present in a radio signal received by an access point from a device. The stronger the signal, the closer the device is assumed to be.
This is the core data point used for location triangulation. Network architects need to ensure sufficient AP density for reliable RSSI readings from multiple points.
Captive Portal
A web page that a user must view and interact with before being granted access to a public WiFi network.
For IT and marketing, this is the strategic point for enforcing terms, gaining GDPR-compliant consent for data collection, and capturing first-party data like email addresses.
MAC Randomisation
A privacy feature in modern operating systems (iOS, Android) that periodically changes the MAC address a device uses for WiFi scanning to prevent passive tracking.
This is the single biggest technical challenge for accurate footfall counting. A key task for network architects is to select an analytics platform that has a proven mechanism for mitigating its effects.
Zone Analytics
The analysis of visitor behaviour within predefined virtual areas (zones) of a venue, such as movement between zones and dwell time per zone.
Venue operators use this to get granular insights. Instead of just knowing total visitors, they can compare the performance of 'Aisle 1' vs. 'Aisle 2' or see how many lobby visitors proceed to the restaurant.
Fallstudien
A 200-room hotel wants to reduce lobby congestion during the peak check-in window (3-5 PM) and improve the guest experience.
- Deploy WiFi Analytics: Ensure AP density in the lobby, entrance, and bar areas meets the 3-AP visibility rule. Define zones for 'Check-in Queue', 'Lobby Seating', and 'Bar Entrance'. 2. Data Collection (1 Week): Collect baseline data on visitor flow and dwell times during the 3-5 PM window. 3. Analysis: The analytics reveal that dwell time in the 'Check-in Queue' zone peaks at 15 minutes, and footfall from the entrance flows directly to the queue, bypassing the lobby bar. 4. Intervention: The hotel implements a mobile check-in station in the 'Lobby Seating' area and updates the captive portal to promote a 'skip the queue' message with a link to the hotel app. 5. Measure & Iterate: Post-intervention data shows queue dwell time has dropped to 8 minutes, and footfall to the bar area from the entrance has increased by 20%.
A retail chain is redesigning its flagship store and wants to validate that the new layout improves product discovery and customer engagement.
- Baseline Analysis: Before the redesign, use WiFi analytics to map the most common customer journeys and generate a footfall heatmap. Identify which zones have the highest and lowest dwell times. 2. Post-Redesign Analysis: After the new layout is implemented, conduct the same analysis. 3. Comparative Reporting: Compare the before-and-after heatmaps and journey flows. The new layout is successful if: (a) footfall is more evenly distributed, indicating better discovery; (b) dwell time has increased in high-margin product zones; and (c) the percentage of visitors who only visit the entrance zone (bouncing) has decreased. 4. POS Integration: Correlate the increase in dwell time in a specific zone (e.g., 'Premium Denim') with sales data for that category to calculate the direct revenue impact of the layout change.
Szenarioanalyse
Q1. A large conference is experiencing complaints about overcrowding in the corridors between sessions. How would you use WiFi analytics to diagnose the problem and propose a data-driven solution?
💡 Hinweis:Think about using time-series data for specific zones and correlating it with the event schedule.
Empfohlenen Ansatz anzeigen
First, define the corridor areas as distinct zones in the analytics platform. Then, analyse the footfall and device density metrics for these zones, specifically in the 15-minute windows before and after major keynote sessions. This will quantify the congestion peaks. The solution would be to present this data to the event organisers and recommend staggering the session end times by 10-15 minutes for adjacent large halls to smooth out the flow of attendees. The success of this change can be measured by a reduction in peak device density in the corridor zones during the next event.
Q2. A retail store's marketing team wants to prove the ROI of a new in-store digital signage campaign. How can they use guest WiFi analytics to measure the campaign's impact on footfall and dwell time?
💡 Hinweis:The key is to isolate the variable. You need to compare behaviour in the target zone before and during the campaign.
Empfohlenen Ansatz anzeigen
Define a zone around the new digital signage. Establish a baseline by measuring the average dwell time and the percentage of total store visitors who enter that zone for a two-week period before the campaign starts. Once the campaign is active, continue to measure the same metrics. The ROI can be demonstrated by showing a statistically significant increase in either dwell time within the zone (people are stopping to watch) or the capture rate of the zone (more people are being drawn to the area). For a more advanced analysis, integrate with POS data to see if the increased engagement correlates with a sales lift for the promoted products.
Q3. A hotel manager has noticed a 15% drop in bar revenue over the last quarter but overall visitor numbers are stable. How could they use WiFi analytics to investigate potential causes related to visitor behaviour?
💡 Hinweis:This requires looking at visitor journeys and flow patterns, not just isolated zone data.
Empfohlenen Ansatz anzeigen
The investigation should focus on visitor journey analysis. Define zones for the lobby, reception, lifts, and the bar. Use the platform's flow analysis tools to answer two questions: 1. What percentage of visitors who enter the lobby also enter the bar zone? Is this percentage trending down over the last quarter? 2. Of the visitors who do enter the bar, is their average dwell time decreasing? A drop in the lobby-to-bar conversion rate might suggest an issue with signage or visibility. A decrease in dwell time for those who do enter the bar might suggest a problem with service, atmosphere, or offerings. The data pinpoints whether the problem is attracting guests or retaining them.
Wichtigste Erkenntnisse
- ✓Your guest WiFi is a powerful sensor network capable of generating deep business intelligence.
- ✓WiFi analytics captures both passive (probe requests) and active (connected sessions) data to build a complete picture of visitor behaviour.
- ✓Accurate footfall and dwell time analysis depends on strategic AP placement with sufficient density for triangulation (the '3-AP rule').
- ✓MAC randomisation is a critical technical challenge; your analytics platform must have a robust mechanism to handle it for accurate counting.
- ✓The captive portal is your gateway for gaining GDPR-compliant consent and enriching anonymous data with valuable first-party demographic information.
- ✓The highest ROI comes from integrating WiFi analytics data into core operational workflows for staffing, marketing, and space utilisation.
- ✓Compliance is non-negotiable. Your consent workflow must be explicit, and your data handling must adhere to GDPR/CCPA principles.
