WiFi लोकेशन ॲनालिटिक्स वापरून ड्वेल टाइम कसा मोजावा
हे मार्गदर्शक WiFi लोकेशन ॲनालिटिक्स वापरून WiFi ड्वेल टाइम मोजण्यासाठी एक सर्वसमावेशक तांत्रिक संदर्भ प्रदान करते, ज्यामध्ये 802.11 प्रोब रिक्वेस्ट कॅप्चरपासून RSSI-आधारित ट्रायलेटरेशन ते जिओफेन्स्ड झोन ॲनालिसिसपर्यंत संपूर्ण आर्किटेक्चर समाविष्ट आहे. हे IT व्यवस्थापक, नेटवर्क आर्किटेक्ट आणि ठिकाणांच्या ऑपरेशन्स संचालकांसाठी डिझाइन केले आहे ज्यांना रिटेल, हॉस्पिटॅलिटी, हेल्थकेअर आणि सार्वजनिक क्षेत्रातील वातावरणात अचूक, स्केलेबल लोकेशन इंटेलिजन्स तैनात करण्याची आवश्यकता आहे. वाचकांना कृती करण्यायोग्य अंमलबजावणी मार्गदर्शन, वास्तविक-जगातील केस स्टडीज आणि कच्च्या स्थानिक डेटाचे मोजता येण्याजोग्या व्यावसायिक परिणामांमध्ये रूपांतरित करण्यासाठी एक स्पष्ट फ्रेमवर्क मिळेल.
हे मार्गदर्शक ऐका
पॉडकास्ट ट्रान्सक्रिप्ट पहा
कार्यकारी सारांश
एंटरप्राइझ ठिकाणांसाठी — विस्तृत रिटेल फ्लोअरपासून ते पसरलेल्या स्टेडियमपर्यंत — अभ्यागतांचे वर्तन समजून घेणे आता मार्केटिंगची चैनीची बाब राहिलेली नाही; ती एक गंभीर कार्यात्मक आवश्यकता आहे. WiFi ड्वेल टाइम, म्हणजे एखादे डिव्हाइस परिभाषित भौतिक क्षेत्रात किती काळ राहते, हे स्थानिक सहभाग मोजण्यासाठी मूलभूत मेट्रिक म्हणून कार्य करते. तथापि, सध्याच्या वायरलेस इन्फ्रास्ट्रक्चरचा वापर करून ड्वेल टाइम अचूकपणे मोजण्यासाठी जटिल RF वातावरण, MAC रँडमायझेशन आणि डिव्हाइसच्या विविध प्रोब फ्रिक्वेन्सी हाताळणे आवश्यक आहे.
हे मार्गदर्शक वरिष्ठ IT व्यावसायिक, नेटवर्क आर्किटेक्ट आणि ऑपरेशन्स संचालकांना WiFi लोकेशन ॲनालिटिक्स वापरून ड्वेल टाइम कसा मोजावा याबद्दल एक निश्चित तांत्रिक संदर्भ प्रदान करते. आम्ही डिव्हाइस डिटेक्शनची यंत्रणा, Received Signal Strength Indicator (RSSI) आणि ट्रायलेटरेशनची भूमिका, आणि Purple सारखे प्लॅटफॉर्म कच्चे प्रोब रिक्वेस्ट कृती करण्यायोग्य व्यावसायिक बुद्धिमत्तेमध्ये कसे रूपांतरित करतात याचा शोध घेतो. तुमच्या सध्याच्या Guest WiFi इन्फ्रास्ट्रक्चरचा लाभ घेऊन, संस्था महागड्या ओव्हरले हार्डवेअर नेटवर्कशिवाय स्केलेबल ॲनालिटिक्स तैनात करू शकतात. ROI प्रकरण आकर्षक आहे: लोकेशन ॲनालिटिक्स लागू करणाऱ्या ठिकाणांनी रूपांतरण दरांमध्ये, कार्यात्मक कार्यक्षमतेत आणि ग्राहक समाधानात सातत्याने मोजता येण्याजोग्या सुधारणा नोंदवल्या आहेत.
तांत्रिक सखोल अभ्यास: ड्वेल टाइमची यंत्रणा
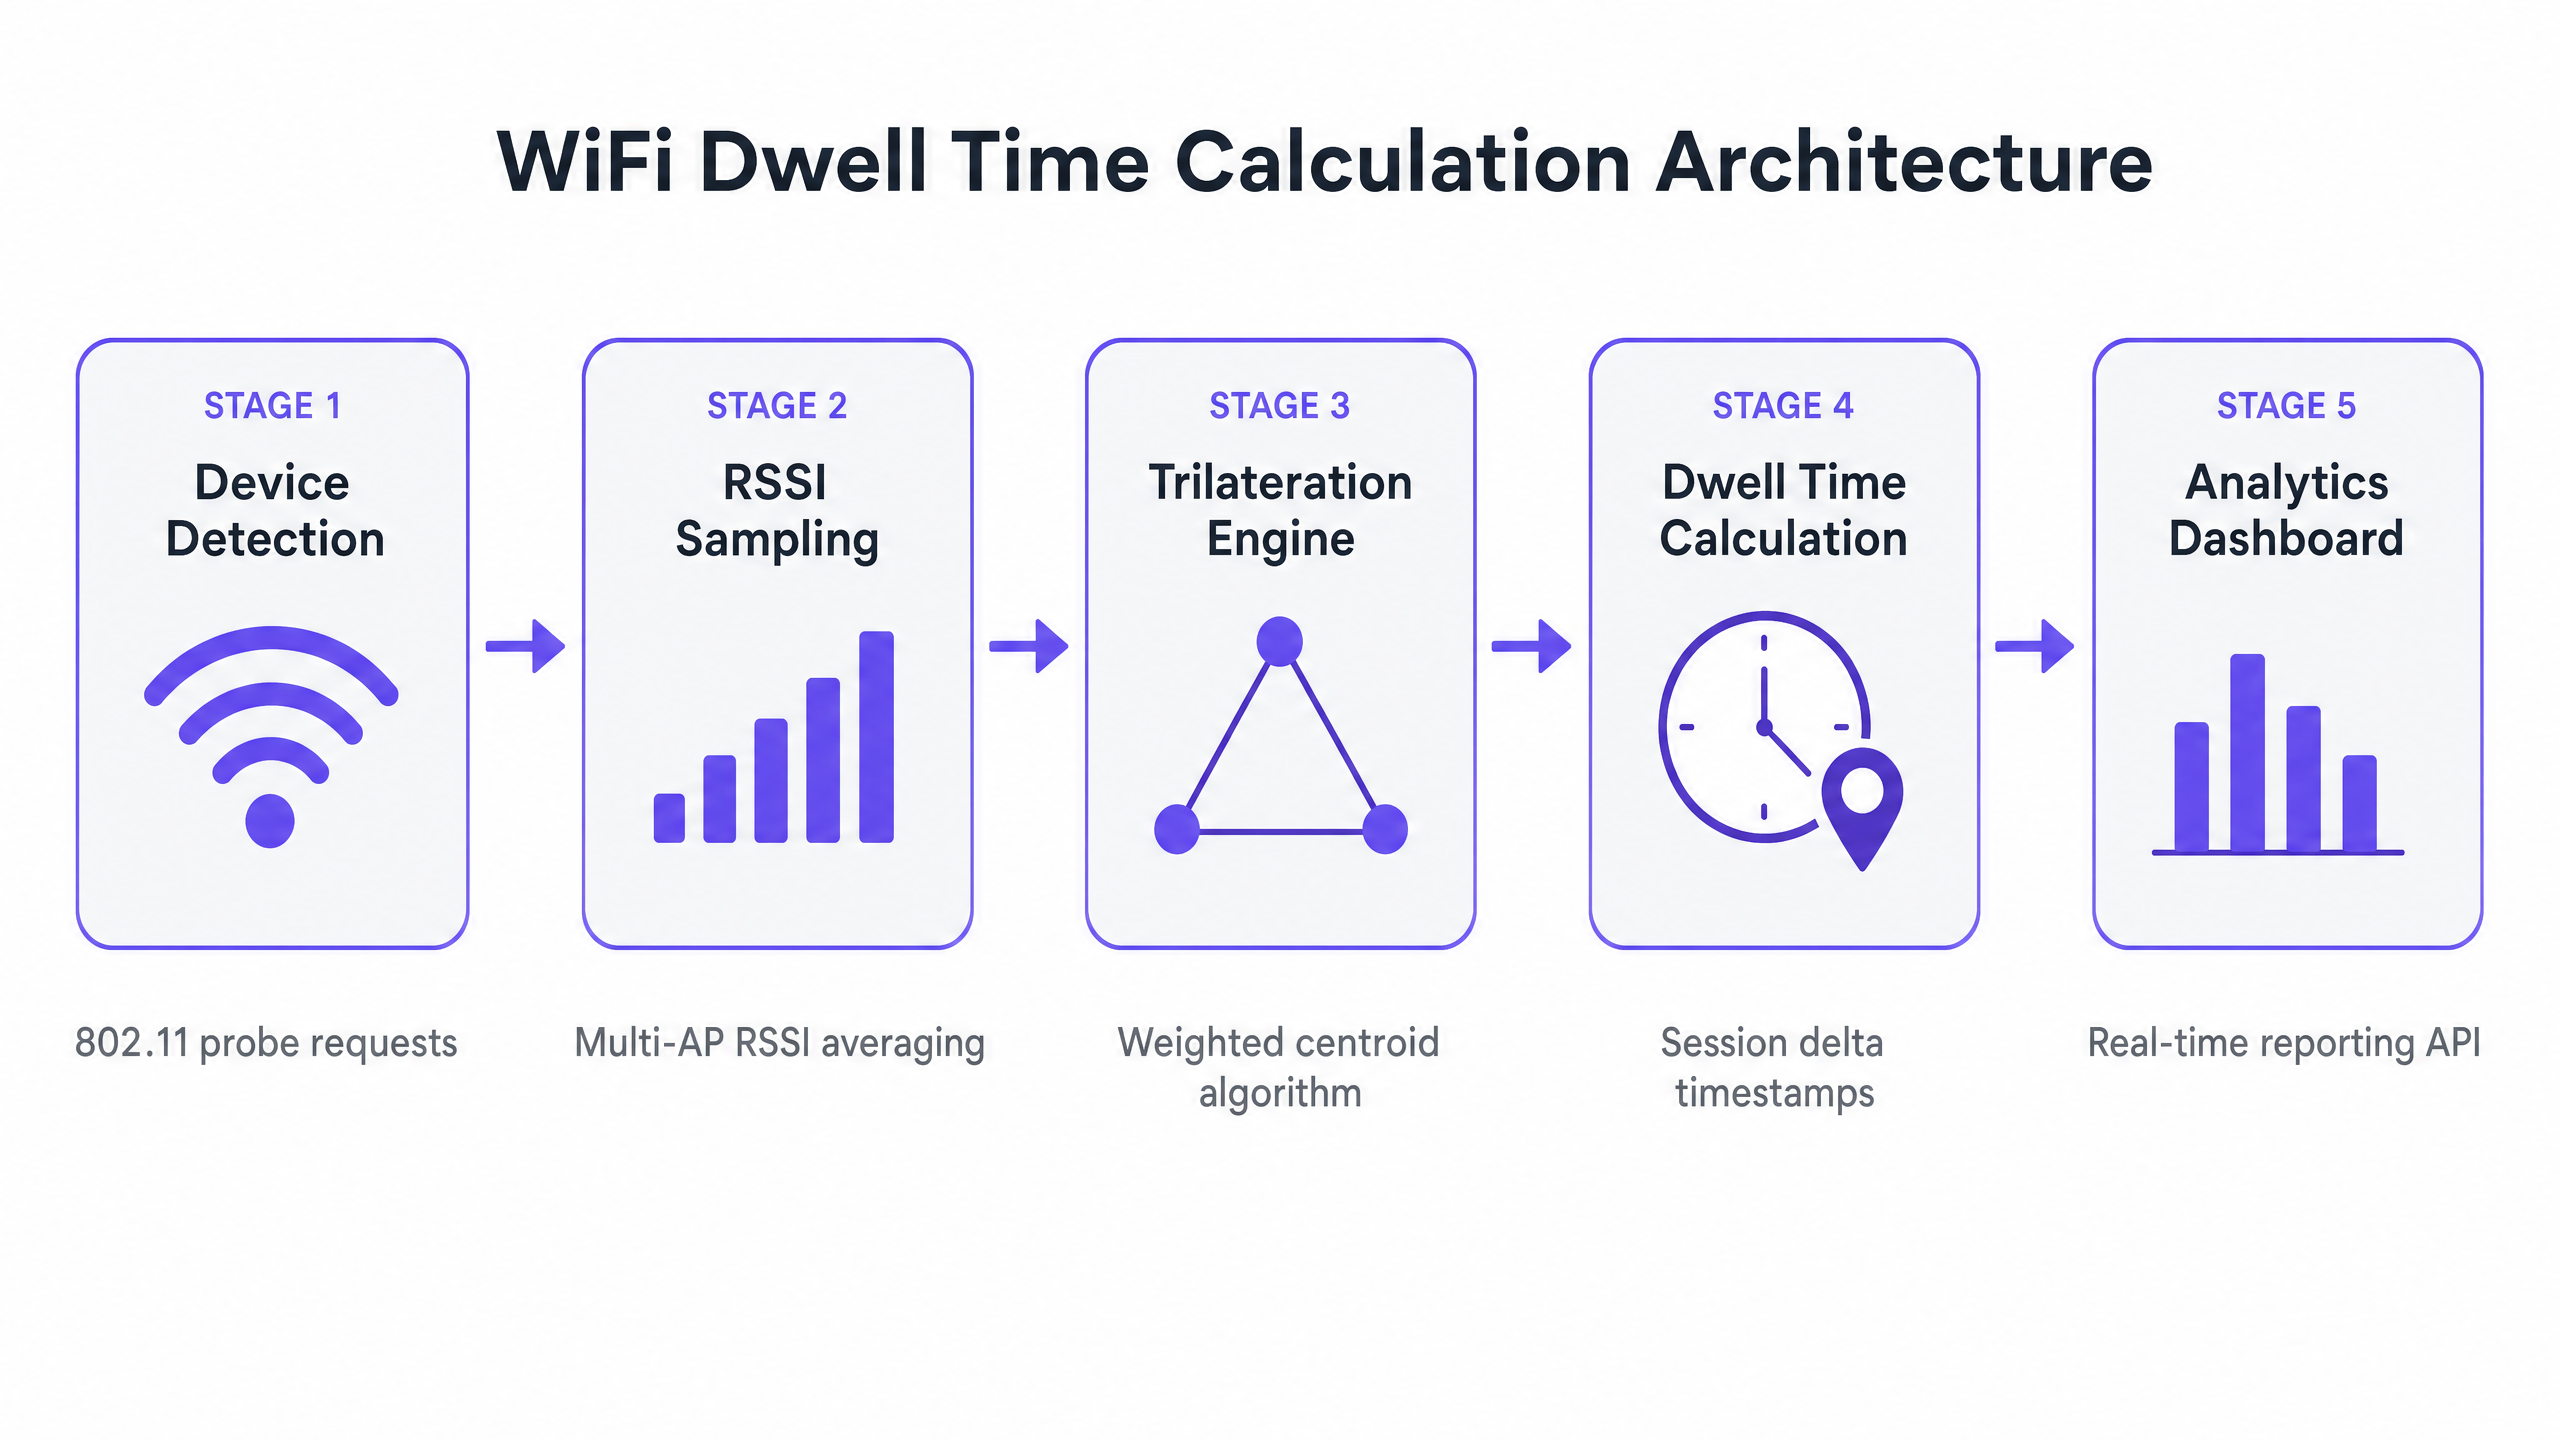
ड्वेल टाइमची गणना करणे ही मूलतः स्थानिक आणि तात्पुरत्या रिझोल्यूशनची समस्या आहे. यासाठी डिव्हाइस ओळखणे, त्याची स्थिती अंदाजित करणे आणि त्या स्थितीचा वेळेनुसार सतत मागोवा घेणे आवश्यक आहे. या प्रत्येक तीन टप्प्यांमध्ये स्वतःची तांत्रिक आव्हाने आहेत आणि एका मजबूत उपायाने त्या सर्वांना संबोधित केले पाहिजे.
1. डिव्हाइस शोध आणि ओळख
ही प्रक्रिया 802.11 प्रोब रिक्वेस्ट्सच्या निष्क्रिय शोधाने सुरू होते. मोबाइल डिव्हाइसेस उपलब्ध वायरलेस नेटवर्क शोधण्यासाठी हे व्यवस्थापन फ्रेम्स सतत प्रसारित करतात. सेन्सर म्हणून कार्य करणारे ॲक्सेस पॉइंट्स (APs) हे फ्रेम्स कॅप्चर करतात, ज्यात डिव्हाइसचा MAC ॲड्रेस, टाइमस्टॅम्प आणि प्राप्त करणाऱ्या AP (RSSI) वरील सिग्नलची ताकद असते.
ऐतिहासिकदृष्ट्या, MAC ॲड्रेस एक कायमस्वरूपी, हार्डवेअर-स्तरीय ओळखकर्ता प्रदान करत असे. तथापि, आधुनिक मोबाइल ऑपरेटिंग सिस्टम — iOS 14+, Android 10+, आणि Windows 10+ — वापरकर्त्याच्या गोपनीयतेत वाढ करण्यासाठी MAC रँडमायझेशन लागू करतात. जेव्हा एखादे डिव्हाइस नेटवर्कशी संबंधित नसते, तेव्हा ते एक तात्पुरते, रँडमाइज्ड MAC ॲड्रेस वापरते जे वेळोवेळी बदलते. यामुळे निष्क्रिय ड्वेल टाइमच्या गणनेला थेट आव्हान मिळते, कारण एकच भौतिक डिव्हाइस एका सत्रात अनेक अद्वितीय अभ्यागत म्हणून दिसू शकते.
अचूक ड्वेल टाइम गणनेसाठी सत्र सातत्य राखण्यासाठी, ॲनालिटिक्स प्लॅटफॉर्मने दोनपैकी एक रणनीती वापरली पाहिजे. पहिली म्हणजे ह्युरिस्टिक फिंगरप्रिंटिंग, ज्यामध्ये प्रोब रिक्वेस्ट फ्रेममधील माहिती घटक (IEs) — जसे की समर्थित डेटा दर, चॅनेल सूची आणि विक्रेता-विशिष्ट फील्ड — चे विश्लेषण करून MAC ॲड्रेस बदलला तरीही त्याच डिव्हाइसमधून आलेल्या प्रोब रिक्वेस्ट्सना संभाव्यपणे जोडणे समाविष्ट आहे. दुसरी आणि अधिक विश्वसनीय पद्धत म्हणजे प्रमाणीकृत सत्रांवर अवलंबून राहणे. जेव्हा एखादा वापरकर्ता Guest WiFi नेटवर्कशी स्पष्टपणे कनेक्ट होतो, तेव्हा प्लॅटफॉर्मला डिव्हाइसचा खरा हार्डवेअर MAC ॲड्रेस मिळतो आणि तो एका कायमस्वरूपी वापरकर्ता प्रोफाइलशी जोडला जाऊ शकतो. ही निश्चित ओळख अचूक, दीर्घकालीन ड्वेल मेट्रिक्ससाठी सुवर्ण मानक आहे.
2. स्थानिक अंदाज: RSSI आणि ट्रायलेटरेशन
एकदा डिव्हाइस शोधले की, सिस्टमने त्याचे भौतिक स्थान निश्चित केले पाहिजे. सर्वात मोठ्या प्रमाणावर वापरली जाणारी पद्धत RSSI-आधारित ट्रायलेटरेशन वापरते, ही एक तंत्रज्ञान आहे जी The Mechanics of WiFi Wayfinding: Trilateration and RSSI Explained या मार्गदर्शकामध्ये सखोलपणे स्पष्ट केली आहे.
तत्त्व सोपे आहे: फ्री-स्पेस पाथ लॉस (FSPL) मॉडेलनुसार RSSI अंतरासोबत अंदाजे कमी होते. अनेक APs वर सिग्नलची ताकद मोजून, सिस्टम प्रत्येक AP पासून डिव्हाइसचे अंतर अंदाजित करू शकते. जेव्हा तीन किंवा अधिक APs समान प्रोब रिक्वेस्ट शोधतात, तेव्हा ॲनालिटिक्स इंजिन प्रत्येक AP पासून अंदाजित अंतरांशी संबंधित असलेल्या वर्तुळांच्या (किंवा 3D मल्टी-फ्लोअर वातावरणात गोलांच्या) छेदनबिंदू शोधून डिव्हाइसची स्थिती मोजू शकते.
व्यवहारात, RF वातावरण आदर्श फ्री-स्पेस मॉडेलपासून खूप दूर आहे. भिंती, धातूचे शेल्व्हिंग आणि मानवी शरीरांवरून सिग्नल परावर्तित झाल्यामुळे होणारे मल्टिपाथ फेडिंग लक्षणीय RSSI भिन्नता निर्माण करते. हे कमी करण्यासाठी, उत्पादन-श्रेणीचे ॲनालिटिक्स इंजिन अनेक तंत्रे वापरतात:
| Technique | Purpose | Typical Gain |
|---|---|---|
| वेटेड सेंट्रॉइड अल्गोरिदम | मजबूत RSSI रीडिंग असलेल्या APs ला जास्त वजन देते | स्थितीतील त्रुटी 15–30% ने कमी करते |
| Kalman फिल्टरिंग | तात्पुरता आवाज काढून टाकण्यासाठी वेळेनुसार स्थान अंदाजांना गुळगुळीत करते | रिअल-टाइम ट्रॅकिंगमधील जिटर कमी करते |
| फिंगरप्रिंट मॅपिंग | कॅलिब्रेशनसाठी ज्ञात ठिकाणी RSSI स्वाक्षऱ्यांचे पूर्व-नकाशा करते | जटिल RF वातावरणात अचूकता सुधारते |
| मल्टी-AP ॲव्हरेजिंग | अनेक नमुना अंतरांमध्ये RSSI ची सरासरी काढते | क्षणिक हस्तक्षेपाचा प्रभाव कमी करते |
विश्वसनीय ट्रायलेटरेशनसाठी, तीनचा नियम लागू होतो: डिव्हाइस किमान तीन APs द्वारे एकाच वेळी -75 dBm किंवा त्याहून चांगल्या सिग्नल सामर्थ्यावर ऐकले जाणे आवश्यक आहे. केवळ कव्हरेजसाठी डिझाइन केलेली नेटवर्क — जिथे एकच AP मोठ्या क्षेत्रावर सिग्नल प्रदान करते — अचूकतेला समर्थन देणार नाहीस्थान विश्लेषण दर. हा एक महत्त्वाचा आर्किटेक्चरल फरक आहे ज्याला उपयोजनापूर्वी संबोधित करणे आवश्यक आहे.
3. तात्पुरती गणना: ड्वेल परिभाषित करणे आणि मोजणे
स्थान निर्देशांकांच्या प्रवाहामुळे, विश्लेषण इंजिन प्लॅटफॉर्ममध्ये परिभाषित केलेल्या geofenced zones विरुद्ध डिव्हाइसची स्थिती मॅप करते. geofence ही मजल्याच्या आराखड्यावर काढलेली एक आभासी बहुभुज (व्हर्च्युअल पॉलीगॉन) आहे, जी चेकआउट रांग, प्रचारात्मक प्रदर्शन किंवा हॉटेल लॉबीसारख्या अर्थपूर्ण भौतिक क्षेत्राचे प्रतिनिधित्व करते.
Dwell time म्हणजे पहिल्या आणि शेवटच्या निरीक्षण केलेल्या टाइमस्टॅम्पमधील केवळ फरक नाही. एक मजबूत गणनेमध्ये डिव्हाइसच्या स्लीप सायकल, झोनमधून थोडक्यात बाहेर पडणे आणि स्थान अंदाजामधील नैसर्गिक गोंधळ यांचा विचार करणे आवश्यक आहे. मानक गणना तर्कशास्त्र तीन प्रमुख पॅरामीटर्स परिभाषित करते:
Entry Event: डिव्हाइसची अंदाजित स्थिती परिभाषित geofenced zone मध्ये प्रवेश करते आणि किमान कालावधीसाठी — Dwell Threshold — त्यात राहते, जेणेकरून ये-जा करणाऱ्यांना फिल्टर करता येईल. Retail वातावरणासाठी सामान्य threshold 30 सेकंद आहे; healthcare प्रतीक्षा क्षेत्रांसाठी, 60 सेकंद अधिक योग्य असू शकतात.
Exit Event: डिव्हाइसची स्थिती झोनच्या सीमेबाहेर जाते, किंवा परिभाषित Timeout Period (सामान्यतः 3–5 मिनिटे) साठी कोणत्याही AP द्वारे डिव्हाइस आढळत नाही. Timeout स्लीप मोडमध्ये जाणाऱ्या किंवा बॅगमध्ये ठेवलेल्या डिव्हाइसेसना हाताळते, ज्यामुळे अकाली सत्र समाप्त होण्यापासून प्रतिबंध होतो.
Dwell Duration: Entry Event timestamp आणि Exit Event timestamp मधील फरक, कोणत्याही timeout buffer शिवाय. हे WiFi Analytics डॅशबोर्डला अहवाल दिलेले मेट्रिक आहे.
अंमलबजावणी मार्गदर्शक
एक मजबूत WiFi location analytics समाधान उपयोजित करण्यासाठी नेटवर्क आर्किटेक्चर आणि व्यावसायिक उद्दिष्टांमध्ये काळजीपूर्वक नियोजन आणि संरेखन आवश्यक आहे. खालील पायऱ्या कोणत्याही एंटरप्राइझ WLAN वातावरणासाठी लागू होणारी विक्रेता-तटस्थ उपयोजन फ्रेमवर्क दर्शवतात.
पायरी 1: पायाभूत सुविधांचे मूल्यांकन आणि घनता वाढवणे
स्थान-सेवा आवश्यकतांविरुद्ध तुमच्या सध्याच्या WLAN उपयोजनाचे मूल्यांकन करण्यासाठी सखोल RF site survey करा. मुख्य प्रश्न हा आहे की तुमची सध्याची AP प्लेसमेंट सर्व लक्ष्यित झोनमध्ये 'Rule of Three' ला समर्थन देते का. AP कव्हरेज मॉडेल करण्यासाठी आणि त्रुटी ओळखण्यासाठी Ekahau किंवा iBwave सारखे साधन वापरा. जर तुमचे नेटवर्क केवळ throughput आणि coverage साठी डिझाइन केले असेल, तर तुम्हाला निश्चितपणे उपयोजनाची घनता वाढवावी लागेल, विशेषतः उच्च-मूल्याच्या झोनमध्ये. प्रकल्पाच्या व्याप्तीचा भाग म्हणून अतिरिक्त APs आणि cabling साठी बजेट ठेवा.
पायरी 2: झोनची व्याख्या आणि Geofencing
तुमची भौतिक जागा analytics platform मध्ये तार्किक झोनमध्ये मॅप करा. तुमचे मजल्याचे आराखडे आयात करा आणि तुमच्या व्यावसायिक प्रश्नांशी जुळणारे geofenced क्षेत्र परिभाषित करा. Retail वातावरणात, सामान्य झोनमध्ये प्रवेशद्वार, विशिष्ट उत्पादन श्रेणी, प्रचारात्मक क्षेत्रे आणि चेकआउट यांचा समावेश होतो. Hospitality सेटिंगमध्ये, संबंधित झोनमध्ये लॉबी, रेस्टॉरंट, बार, कॉन्फरन्स स्वीट्स आणि पूल क्षेत्र यांचा समावेश असू शकतो. झोन योग्य आकारात असल्याची खात्री करा — WiFi-आधारित location analytics साठी किमान 20-30 चौरस मीटर ही एक व्यावहारिक निम्न मर्यादा आहे.
पायरी 3: कंट्रोलर एकत्रीकरण आणि डेटा पाइपलाइन
तुमचा वायरलेस कंट्रोलर (Cisco, Aruba, Meraki, Ruckus, किंवा समतुल्य) analytics platform सह एकत्रित करा. यामध्ये सामान्यतः कंट्रोलरला RTLS (Real-Time Location System) डेटा स्ट्रीम्स किंवा location API अद्यतने analytics engine कडे फॉरवर्ड करण्यासाठी कॉन्फिगर करणे समाविष्ट असते. डेटा पाइपलाइन जवळ-वास्तविक वेळेच्या वितरणासाठी कॉन्फिगर केलेली असल्याची खात्री करा — 30 सेकंदांपेक्षा जास्त latency थेट operational dashboards ची गुणवत्ता कमी करेल. सर्व डेटा transmission प्रवासात encrypted (किमान TLS 1.2) असणे आवश्यक आहे आणि GDPR तसेच कोणत्याही लागू डेटा संरक्षण नियमांचे पालन करणे आवश्यक आहे.
पायरी 4: थ्रेशोल्ड कॉन्फिगरेशन आणि बेसलाइन स्थापना
प्रत्येक झोनसाठी अपेक्षित वर्तनावर आधारित Dwell Thresholds आणि Timeout Periods कॉन्फिगर करा. सांख्यिकीयदृष्ट्या मजबूत बेसलाइन स्थापित करण्यासाठी, निष्कर्ष काढण्यापूर्वी किमान चार ते सहा आठवडे प्रणाली चालवा. ही बेसलाइन अर्थपूर्ण विचलन ओळखण्यासाठी आवश्यक आहे — उदाहरणार्थ, प्रचारात्मक प्रदर्शनात dwell time मध्ये अचानक घट झाल्यास, ते merchandising समस्या किंवा कर्मचाऱ्यांची कमतरता दर्शवू शकते.
सर्वोत्तम पद्धती
खालील शिफारसी मोठ्या प्रमाणावर WiFi location analytics उपयोजित करण्यासाठी उद्योग-मानक दृष्टिकोन दर्शवतात.
RF वातावरण नियमितपणे कॅलिब्रेट करा. एखाद्या ठिकाणाचे भौतिक वातावरण सतत बदलते — नवीन डिस्प्ले, हंगामी वस्तू, गर्दीची घनता हे सर्व RF propagation बदलतात. उपयोजनाच्या वेळी केलेले site survey सहा महिन्यांनंतर अचूक राहणार नाही. तुमच्या operational schedule मध्ये त्रैमासिक calibration cadence तयार करा आणि जागेत कोणताही महत्त्वपूर्ण भौतिक बदल झाल्यानंतर त्वरित पुन्हा कॅलिब्रेट करा.
पॅसिव्ह आणि प्रमाणित विश्लेषणाचे विभाजन करा. stakeholders ना passive analytics (unauthenticated devices, MAC randomization च्या अधीन) आणि authenticated analytics (Guest WiFi मध्ये लॉग इन केलेले users) यांच्यातील फरक समजावून सांगा. Passive data मोठ्या प्रमाणावर विश्वसनीय trend data प्रदान करतो; authenticated data deterministic, individual-level tracking प्रदान करतो. macro-level footfall आणि zone popularity analysis साठी passive data वापरा आणि conversion attribution आणि personalised engagement साठी authenticated data वापरा.
ऑपरेशनल डेटाशी सहसंबंध साधा. Dwell time एकटा एक metric आहे, insight नाही. जेव्हा spatial data Point of Sale (PoS) data, staffing schedules, किंवा service delivery records शी सहसंबंधित केला जातो तेव्हा त्याचे मूल्य उघड होते. उदाहरणार्थ, checkout queue तील जास्त dwell time केवळ transaction volumes आणि staffing levels शी सहसंबंधित केल्यावरच कार्यवाहीयोग्य असतो. हा सहसंबंध location analytics investment साठी ROI case चा आधार आहे.
गोपनीयता आणि अनुपालन आवश्यकतांशी जुळवून घ्या. तुमची उपयोजना GDPR (मध्येयूके आणि ईयू), तसेच तुमच्या उद्योगाशी संबंधित कोणतेही क्षेत्र-विशिष्ट नियम. आरोग्यसेवा वातावरणात, रुग्णाच्या स्थानाशी संबंधित डेटा अतिरिक्त डेटा संरक्षण आवश्यकतांच्या अधीन असू शकतो. डेटा कमी करण्याच्या तत्त्वांची अंमलबजावणी करा — केवळ आवश्यक असलेला डेटा गोळा करा, शक्य असल्यास अनामिक करा आणि स्पष्ट डेटा टिकवून ठेवण्याची धोरणे परिभाषित करा.
समस्यानिवारण आणि जोखीम कमी करणे
खालील सारणी WiFi ड्वेल टाइम डिप्लॉयमेंटमधील सर्वात सामान्य अपयश आणि शिफारस केलेल्या उपाययोजनांचा सारांश देते.
| अपयश प्रकार | संभाव्य कारण | उपाय |
|---|---|---|
| वाढीव अभ्यागत संख्या, कमी ड्वेल टाइम | प्रमाणीकरण नसलेल्या डिव्हाइसेसवर MAC रँडमायझेशन | गेस्ट WiFi प्रमाणीकरण वाढवा; निष्क्रिय डेटासाठी ह्युरिस्टिक फिंगरप्रिंटिंग वापरा |
| अनियमित स्थान डेटा (डिव्हाइसेस झोनमध्ये उड्या मारणे) | अपुरी AP घनता किंवा मल्टीपाथ फेडिंग | APs वाढवा; स्मूथिंग अल्गोरिदम ट्यून करा; RF मॉडेल पुन्हा कॅलिब्रेट करा |
| पादचाऱ्यांना पकडणारे झोन | ड्वेल थ्रेशोल्ड खूप कमी सेट केले आहे | प्रभावित झोनसाठी किमान ड्वेल थ्रेशोल्ड वाढवा |
| प्रवेशावरील रहदारी पकडणारा चेकआउट झोन | ओव्हरलॅपिंग किंवा जास्त मोठे झोन परिभाषा | जिओफेन्सच्या सीमा घट्ट करा; झोन ओव्हरलॅप होणार नाहीत याची खात्री करा |
| जुना किंवा विलंबित डॅशबोर्ड डेटा | डेटा पाइपलाइन विलंब किंवा API दर मर्यादा | कंट्रोलर एकत्रीकरण तपासा; API पोलिंग वारंवारता वाढवा |
| बहु-मजली वातावरणात कमी अचूकता | 3D जागेवर 2D ट्रायलेटरेशन लागू केले | AP उंची डेटा वापरून मजला-स्तरीय भेदभाव लागू करा |
ROI आणि व्यावसायिक परिणाम
WiFi स्थान विश्लेषण लागू केल्याने भौतिक जागा मोजण्यायोग्य, अनुकूल वातावरणात रूपांतरित होतात. व्यवसाय प्रकरण तीन आयामांवर कार्य करते: महसूल निर्मिती, कार्यात्मक कार्यक्षमता आणि ग्राहक अनुभव.
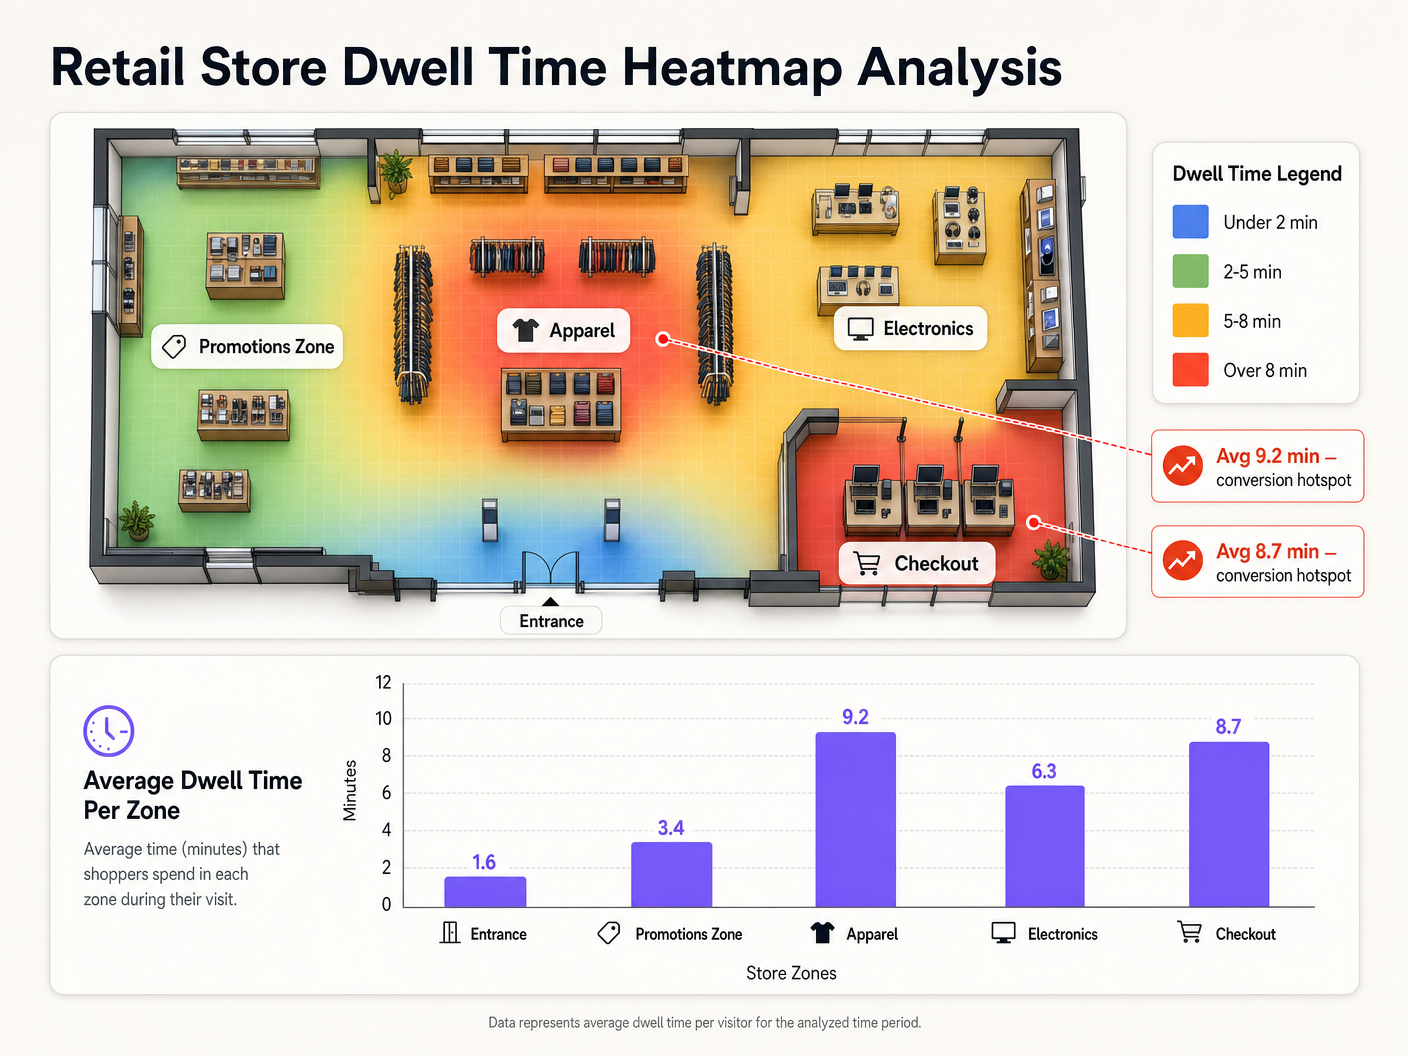
महसूल बाजूने, ड्वेल टाइम डेटा पुरावा-आधारित मर्चेंडाइजिंग निर्णय सक्षम करतो. विशिष्ट एंड-कॅप डिस्प्ले सरासरी 9.2 मिनिटांचा ड्वेल टाइम निर्माण करतो — प्रवेशद्वारावरील 1.6 मिनिटांच्या तुलनेत — हे जाणून श्रेणी व्यवस्थापकांना उच्च-एंगेजमेंट झोनमध्ये उच्च-मार्जिन उत्पादनांना प्राधान्य देण्यास मदत करते. वाहतूक ऑपरेटरसाठी, रिटेल सवलतींमधील ड्वेल पॅटर्न समजून घेणे थेट भाडेकरू वाटाघाटी आणि महसूल वाटणी करारांना माहिती देते.
कार्यात्मक बाजूने, रिअल-टाइम ड्वेल ॲनालिटिक्स डायनॅमिक स्टाफिंग सक्षम करते. चेकआउट ड्वेल टाइम परिभाषित थ्रेशोल्डपेक्षा जास्त झाल्यावर कर्मचाऱ्याला अलर्ट देणारी रांग व्यवस्थापन प्रणाली कायमस्वरूपी जास्त कर्मचारी ठेवण्याच्या खर्चाशिवाय प्रतीक्षा वेळ कमी करू शकते. हे थेट सुधारित ग्राहक समाधानास हातभार लावते — अतिथी समाधान कसे सुधारावे: अंतिम प्लेबुक मध्ये सखोलपणे चर्चा केलेला विषय.
अनुभव बाजूने, स्थान बुद्धिमत्ता संदर्भानुसार संबंधित सहभाग सक्षम करते. Purple च्या WiFi Analytics प्लॅटफॉर्मसह एकत्रित केल्यावर, ड्वेल डेटा वैयक्तिकृत सूचना ट्रिगर करू शकतो — उदाहरणार्थ, ज्या ग्राहकाने फुटवेअर विभागात पाच मिनिटांपेक्षा जास्त वेळ घालवला आहे त्याला सवलतीची ऑफर दिली जाते. ही क्षमता अधिकाधिक संबंधित आहे कारण ठिकाणे passwordless access models शोधत आहेत जे डेटा गुणवत्ता राखताना प्रमाणीकरण घर्षण कमी करतात.
सार्वजनिक क्षेत्रातील संस्था आणि स्मार्ट सिटी उपक्रमांसाठी, ड्वेल ॲनालिटिक्स पायाभूत सुविधांच्या गुंतवणुकीच्या निर्णयांसाठी पुरावा आधार प्रदान करते — नागरिक सार्वजनिक जागा, वाहतूक केंद्रे आणि नागरी इमारतींचा वापर कसा करतात हे समजून घेणे. Purple ची वाढती सार्वजनिक क्षेत्रातील क्षमता, इयान फॉक्स यांची सार्वजनिक क्षेत्रासाठी VP ग्रोथ म्हणून नियुक्ती मध्ये अधोरेखित केल्याप्रमाणे, सरकारी आणि नगरपालिका वातावरणात या प्रकारच्या स्थानिक बुद्धिमत्तेची वाढती मागणी दर्शवते.
WiFi स्थान विश्लेषण डिप्लॉयमेंटचा एकूण मालकी खर्च सामान्यतः निर्माण झालेल्या कार्यात्मक मूल्याच्या तुलनेत कमी असतो, विशेषतः जिथे ॲनालिटिक्स लेयर विद्यमान WLAN पायाभूत सुविधांवर तैनात केला जातो. सीमांत खर्च प्रामुख्याने ॲनालिटिक्स प्लॅटफॉर्म परवाना आणि एकत्रीकरण व कॅलिब्रेशनसाठी आवश्यक असलेला अभियांत्रिकी वेळ असतो — नवीन हार्डवेअर गुंतवणूक नाही.
महत्वाच्या व्याख्या
Wifi Dwell Time
The measured duration a WiFi-enabled device remains within a defined physical zone, calculated from the delta between an entry event and an exit event as detected by the wireless infrastructure.
The primary metric for spatial engagement analytics. Used by retail operators, venue managers, and healthcare administrators to understand how people use physical spaces.
Received Signal Strength Indicator (RSSI)
A measurement of the power level of a received radio signal, expressed in decibels relative to one milliwatt (dBm). Values typically range from 0 dBm (maximum signal) to -100 dBm (minimum detectable signal).
The raw input for distance estimation in WiFi location analytics. RSSI of -75 dBm or better at three or more APs is the minimum requirement for reliable trilateration.
Trilateration
A mathematical technique for determining the position of a point by measuring its distance from three or more known reference points. In WiFi analytics, the reference points are Access Points and the distances are estimated from RSSI readings.
The core positioning algorithm used by WiFi location analytics platforms. Distinct from triangulation, which uses angles rather than distances.
MAC Randomization
A privacy feature implemented in modern mobile operating systems (iOS 14+, Android 10+) where a device uses a temporary, randomized MAC address when probing for networks, rather than its permanent hardware address.
The primary technical challenge for passive WiFi analytics. Causes a single physical device to appear as multiple unique visitors, inflating footfall counts and fragmenting dwell time sessions. Mitigated by encouraging Guest WiFi authentication.
Geofencing
The creation of a virtual geographic boundary — defined as a polygon on a floor plan — that triggers analytical events (entry, exit, dwell) when a tracked device crosses the boundary.
Used within the analytics dashboard to define specific areas for localized dwell time measurement. Zone size and placement are critical configuration decisions that directly impact data quality.
Dwell Threshold
The minimum duration a device must remain within a geofenced zone before the analytics platform registers an entry event and begins counting dwell time.
Essential for data quality. A threshold that is too low will count passersby as dwellers; a threshold that is too high will miss genuine short-duration engagements. Must be tuned per zone based on expected behaviour.
Multipath Fading
A phenomenon where a radio signal reaches a receiving antenna via two or more paths — direct line-of-sight and one or more reflected paths — causing constructive or destructive interference that distorts the received signal strength.
The primary source of RSSI inaccuracy in complex indoor environments such as warehouses, retail stores, and hospitals. Mitigated through AP densification, smoothing algorithms, and RF fingerprinting.
Probe Request
An 802.11 management frame broadcast by a client device to discover available wireless networks. Contains the device's MAC address (which may be randomized), supported data rates, and other capability information.
The fundamental data packet captured by APs to detect the presence of devices in a venue. The raw input for all passive WiFi location analytics.
Deterministic Identification
The ability to identify a specific device or user with certainty, typically achieved through an authentication event where the device's true hardware MAC address is revealed to the network.
Achieved when a user authenticates to the Guest WiFi network. Enables accurate long-term dwell tracking that is immune to MAC randomization, and allows spatial data to be tied to a known user profile for conversion attribution.
Free-Space Path Loss (FSPL)
The attenuation of radio signal strength that occurs as the signal propagates through free space, increasing with distance and frequency according to a logarithmic model.
The theoretical basis for RSSI-to-distance conversion in trilateration. Real-world environments deviate significantly from the FSPL model due to obstacles and reflections, which is why calibration and smoothing algorithms are essential.
सोडवलेली उदाहरणे
A national retail chain with 150 stores wants to measure the effectiveness of a new end-cap promotional display. The marketing team needs to know how long shoppers are stopping at the display, and whether high dwell time correlates with increased sales of the promoted SKU.
Step 1 — Zone Creation: Define a tight geofence (approximately 4m x 3m) around the end-cap display within the Purple analytics dashboard, distinct from the broader aisle zone. Step 2 — Threshold Configuration: Set a minimum dwell threshold of 20 seconds to filter out customers simply walking past the aisle end. Step 3 — Baseline Period: Run the analytics for two weeks before the promotion launches to establish a baseline dwell time for that zone. Step 4 — Promotion Period Measurement: Activate the promotion and monitor dwell time daily. Export the dwell time data via the analytics API. Step 5 — Correlation: Join the dwell time dataset with PoS transaction data for the promoted SKU, segmented by time of day and day of week. Calculate the Pearson correlation coefficient between average zone dwell time and hourly SKU sales volume. Step 6 — Reporting: Present the correlation data to the category management team with a recommendation to replicate the display format in high-footfall stores.
A large NHS trust needs to monitor patient wait times in the Emergency Department triage area to ensure compliance with the four-hour SLA target. The IT team has an existing Cisco Meraki deployment but no current analytics capability.
Step 1 — Infrastructure Audit: Conduct an RF site survey of the triage waiting area. Verify that a minimum of three Meraki APs hear devices in all seating areas at -70 dBm or better. The ED environment typically has high RF interference from medical equipment; densify if necessary. Step 2 — Meraki Location API Integration: Enable the Meraki Scanning API on the relevant APs and configure it to POST location data to the Purple analytics platform endpoint at 30-second intervals. Step 3 — Zone Definition: Define the triage waiting area as a distinct zone within Purple. Set the dwell threshold to 60 seconds and the timeout to 10 minutes (to account for patients who may be briefly taken to a side room). Step 4 — Real-Time Alerting: Configure a webhook alert to notify the duty charge nurse via the hospital's operational messaging system (e.g., Microsoft Teams or Vocera) if the average dwell time in the triage zone exceeds 45 minutes. Step 5 — Reporting: Generate weekly dwell time reports segmented by time of day and day of week to identify peak pressure periods for staffing optimisation.
सराव प्रश्न
Q1. You are deploying location analytics in a large warehouse with high metal racking throughout. Initial tests show device locations jumping erratically between aisles, and average dwell times are inconsistent. What is the most likely root cause and what remediation steps would you recommend?
टीप: Consider how the physical structure of the environment affects RF signal propagation, and what this means for the reliability of RSSI-based distance estimation.
नमुना उत्तर पहा
The erratic location data is caused by severe multipath fading. Metal racking reflects and scatters RF signals, meaning the RSSI values received by APs are heavily distorted by reflected paths rather than representing true line-of-sight distances. This makes the trilateration engine's distance estimates unreliable. Recommended remediation: (1) Densify the AP deployment, positioning APs at the end of each aisle to maximise line-of-sight coverage down the aisle length. (2) Consider directional antennas focused down specific aisles to reduce cross-aisle interference. (3) Implement RF fingerprinting — pre-map RSSI signatures at known grid points throughout the warehouse to create a calibrated location model that accounts for the specific RF characteristics of the environment. (4) Tune the analytics platform's Kalman filter smoothing parameters to reduce the impact of transient RSSI spikes on the location estimate.
Q2. A retail operations director reports that the analytics platform is showing total daily visitor counts that are three times higher than the manual door counter, and average dwell times of under two minutes across all zones. The deployment relies entirely on passive probe request monitoring. What is the architectural issue and how would you resolve it?
टीप: Think about what happens to a device's identifier over the course of a one-hour shopping visit on a modern smartphone.
नमुना उत्तर पहा
The issue is MAC randomization. Modern smartphones rotate their randomized MAC address periodically — in some cases every few minutes. Because the platform is relying entirely on passive probe requests, each new MAC address is interpreted as a new, unique visitor. A single shopper who spends an hour in the store may generate ten or more unique MAC addresses, each appearing as a separate visitor with a short dwell time. The resolution is twofold: (1) Implement a Guest WiFi authentication flow to drive users onto the network, providing a persistent hardware MAC address and a known user identity. Even a 30–40% authentication rate will significantly improve data quality. (2) For the remaining passive data, implement heuristic fingerprinting to probabilistically link probe requests from the same device based on Information Element patterns, reducing (though not eliminating) the inflation caused by MAC rotation. Communicate clearly to stakeholders that passive visitor counts are trend indicators, not absolute figures.
Q3. You have deployed location analytics in a shopping centre and defined a zone around a specific food court seating area. The data shows that the zone has an unusually high average dwell time of 45 minutes, but the food court operator reports that most customers are only seated for 15–20 minutes. What configuration issue might explain this discrepancy?
टीप: Consider how the analytics platform handles devices that stop sending probe requests while remaining physically present in the zone.
नमुना उत्तर पहा
The most likely cause is an incorrectly configured Timeout Period. When a customer finishes eating and puts their phone in their pocket or bag, the device may enter a low-power state and stop broadcasting probe requests. If the Timeout Period is set too long — for example, 30 minutes — the platform will continue the dwell session for 30 minutes after the last detected probe, even if the customer has already left. This artificially inflates the reported dwell time. The fix is to reduce the Timeout Period to a value that reflects the typical gap between probe broadcasts in the environment — usually 3–5 minutes is appropriate for a busy public venue. Additionally, review whether the geofence boundary for the food court zone is inadvertently capturing adjacent areas (e.g., a corridor or queue) where customers may linger after leaving the seating area.