আচরণগত অন্তর্দৃষ্টির কাঁচামাল সম্ভবত ইতিমধ্যে আপনার কাছেই রয়েছে।
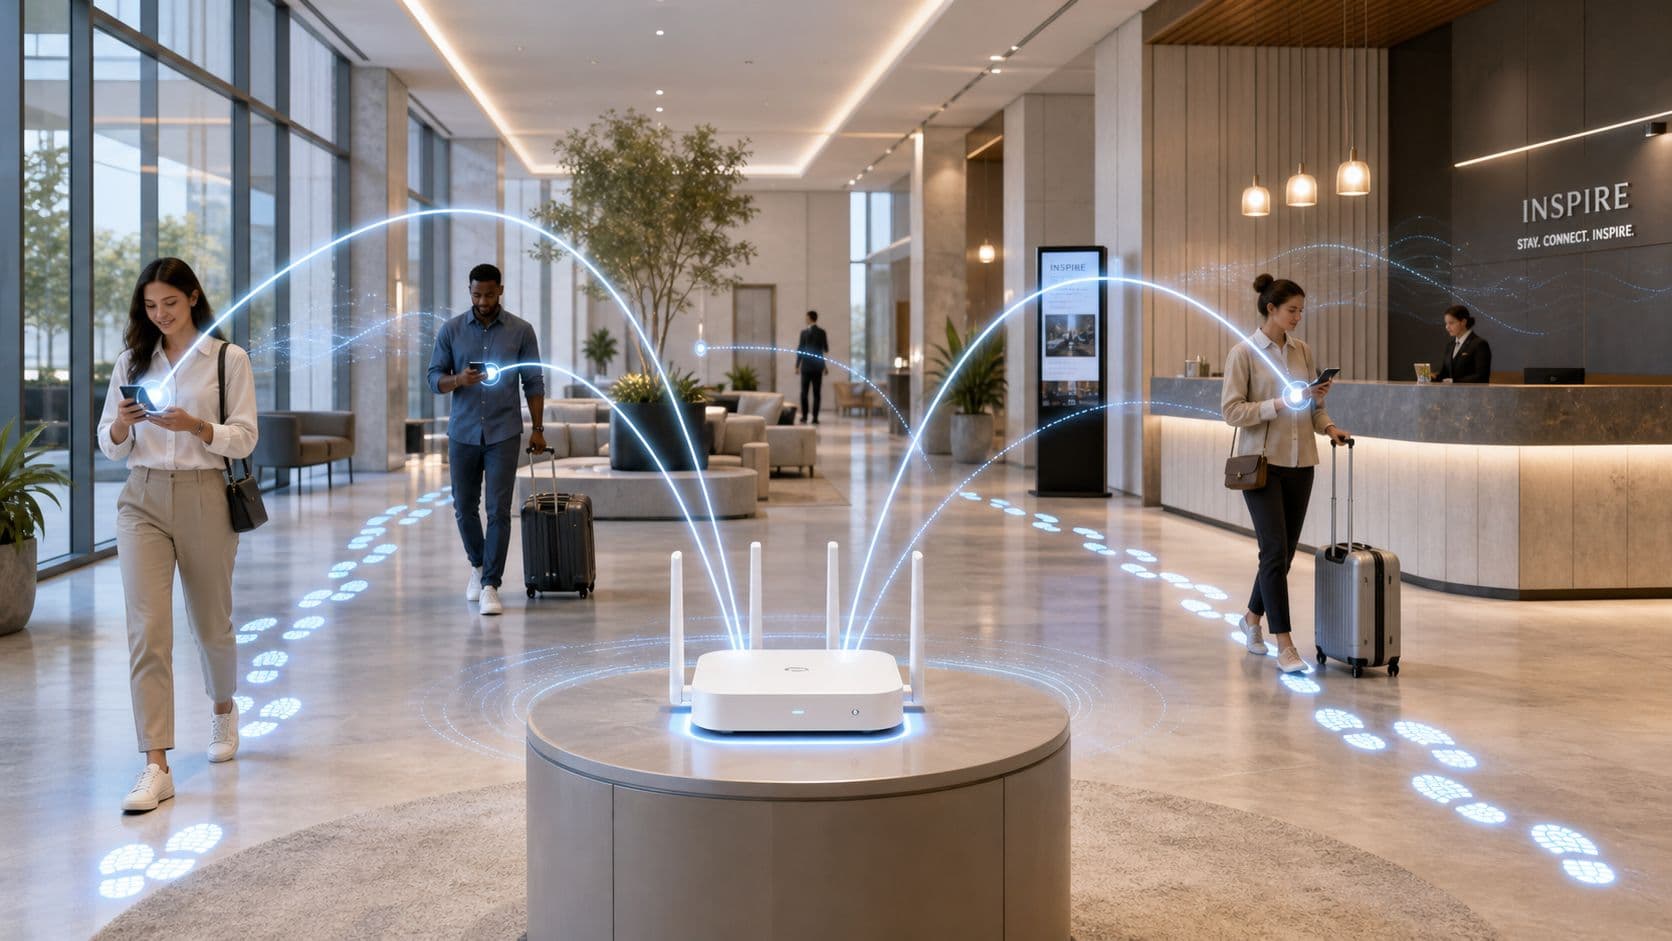
একজন ভেন্যু ম্যানেজার ব্যস্ত করিডোর, পূর্ণ বসার জায়গা এবং গেস্ট WiFi-এ যুক্ত হওয়া ফোনের অবিরাম প্রবাহ দেখতে পান, তবুও আত্মবিশ্বাসের সাথে সাধারণ অপারেশনাল প্রশ্নের উত্তর দিতে পারেন না। কোন প্রবেশদ্বার দিয়ে সবচেয়ে মূল্যবান দর্শনার্থীরা আসেন? মানুষ কোথায় থামে, তারপর চলে যায়? কোন পুনরাবৃত্ত দর্শনার্থীরা অনুগত গ্রাহকের মতো আচরণ করেন এবং কারা কেবল পার হয়ে যাচ্ছেন? অনেক বাস্তব ভেন্যুর জন্য মানুষ দৃশ্যমান হলেও তাদের আচরণ এখনও আড়ালে রয়ে গেছে।
এই ব্যবধানটি গুরুত্বপূর্ণ কারণ বাস্তব স্থানগুলি এখন সারাদিন ধরে ডিজিটাল চিহ্ন তৈরি করে। যুক্তরাজ্যে, Microsoft's overview of behavioural analytics অনুসারে Ofcom রিপোর্ট করেছে যে 2024 সালে 61.5 মিলিয়ন সক্রিয় মোবাইল সংযোগ ছিল, যেখানে যুক্তরাজ্যের 88% প্রাপ্তবয়স্ক প্রতিদিন ইন্টারনেট ব্যবহার করেছেন। ব্যবহারিক অর্থে এর মানে হলো, বেশিরভাগ দর্শনার্থীই একটি সংযুক্ত ডিভাইস নিয়ে আসেন এবং প্রতিটি প্রমাণীকৃত সেশন, পুনরাবৃত্ত ভিজিট এবং অ্যাক্সেস ইভেন্ট একটি দরকারী সংকেত হতে পারে।
ভেন্যু অপারেটর এবং IT ম্যানেজারদের জন্য এটি নেটওয়ার্কের ভূমিকাকে বদলে দেয়। WiFi কেবল একটি ইউটিলিটি না থেকে ব্যবসার জন্য একটি সেন্সর লেয়ারের মতো কাজ করতে শুরু করে। সঠিকভাবে ব্যবহার করা হলে, ফার্স্ট-পার্টি WiFi ডেটা কাস্টমার জার্নি জুড়ে চলাচলের ধরণ, পুনরাবৃত্ত ভিজিট, ডুয়েলের সময়কাল এবং ঘর্ষণের জায়গাগুলি প্রকাশ করতে পারে।
Introduction From Footfall to Insight
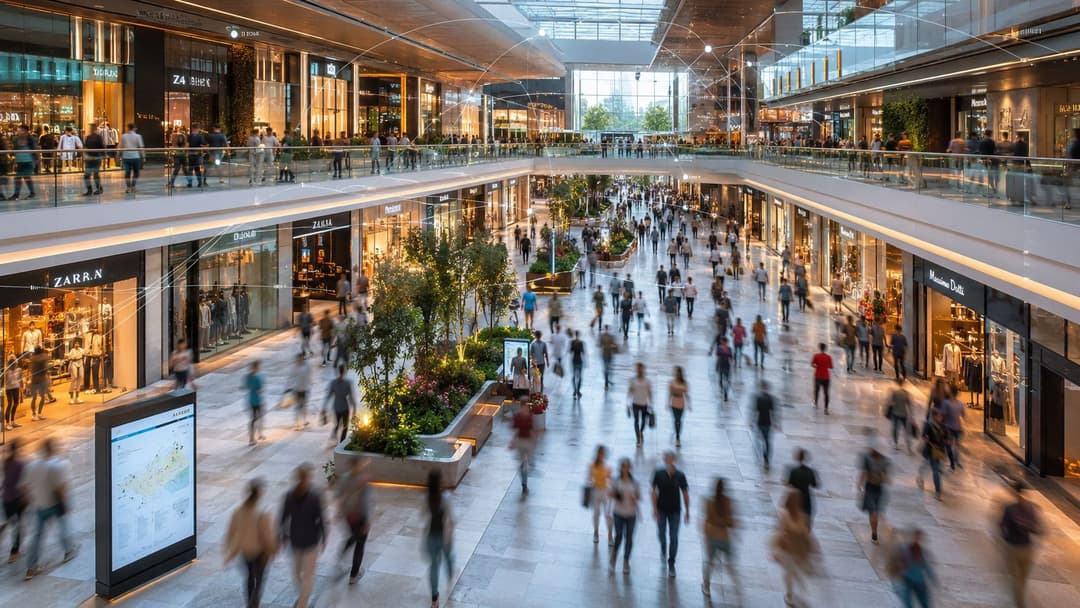
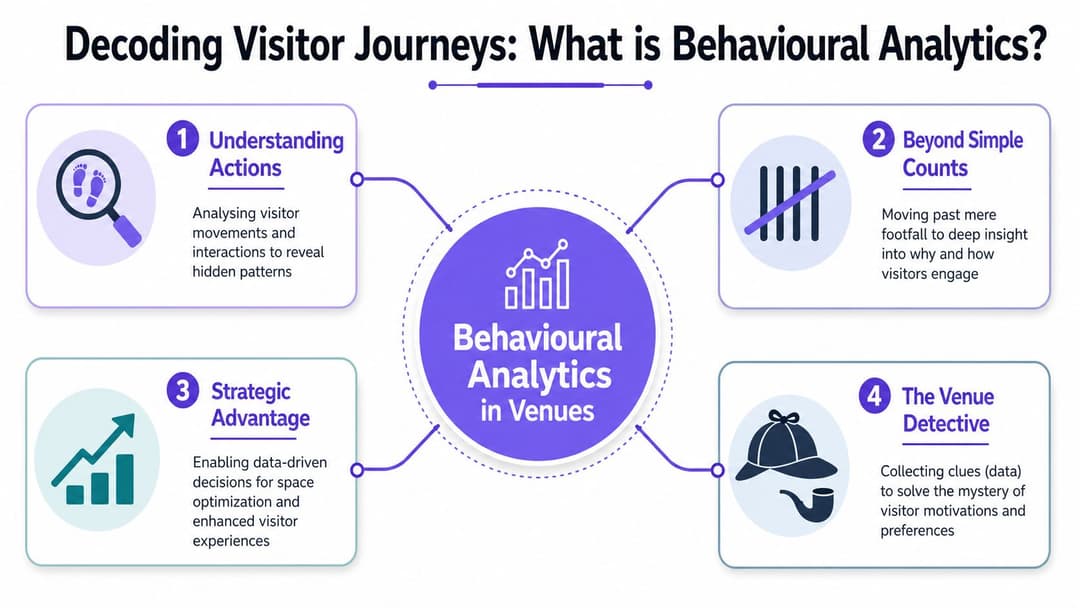
একটি শপিং সেন্টার দরজা দিয়ে আসা মানুষের সংখ্যা গণনা করতে পারে। এটি দরকারী, তবে সীমিত। এটি আপনাকে জানায় যে বিল্ডিংটি ব্যস্ত, কিন্তু দর্শনার্থীরা অন্বেষণ করছেন কি না, দীর্ঘ সময় কাটাচ্ছেন কি না, ফিরে আসছেন কি না, নাকি জায়গার কিছু অংশ এড়িয়ে চলছেন তা জানায় না।
আচরণগত অ্যানালিটিক্স এই শূন্যতা পূরণ করে। এটি সংযুক্ত ইভেন্টগুলির একটি প্রবাহকে মানুষ কীভাবে একটি জায়গা ব্যবহার করছে তার একটি স্পষ্ট চিত্রে রূপান্তরিত করে। একটি ভেন্যু সেটিংয়ে এই সংকেতগুলি প্রায়শই নেটওয়ার্ক থেকেই আসে। একটি ডিভাইস গেস্ট WiFi-এ যুক্ত হয়, পরে আবার সংযুক্ত হয়, একটি নির্দিষ্ট এলাকার কাছাকাছি থাকে, অন্য এলাকায় যায় অথবা কোনো মূল গন্তব্যে পৌঁছানোর আগেই সংযোগ বিচ্ছিন্ন হয়ে যায়। আলাদাভাবে এই সংকেতগুলি ছোট মনে হতে পারে। তবে একসাথে এগুলি মানুষের উদ্দেশ্য বর্ণনা করতে শুরু করে।
কেন বাস্তব ভেন্যুগুলির কেবল মাথার সংখ্যার চেয়ে বেশি কিছু প্রয়োজন
একটি সাধারণ ফুটফল রিপোর্ট হলো একটি কার পার্কে কতগুলি গাড়ি প্রবেশ করেছে তা পরীক্ষা করার মতো, যেখানে কে অবস্থান করল, কে ঘুরে চলে গেল এবং জায়গা না পেয়ে কে চলে গেল তা জানা যায় না। ভেন্যু টিমগুলির কেবল সংখ্যার চেয়ে আচরণ জানা বেশি প্রয়োজন।
এটি বিশেষ করে সেইসব খাতের জন্য সত্য যেখানে কাস্টমার জার্নি বাস্তব এবং ডিজিটাল উভয় স্পর্শবিন্দুকে অতিক্রম করে:
- রিটেইল সেন্টারগুলির প্রধান স্টোর, ফুড এরিয়া এবং তুলনামূলক শান্ত ইউনিটগুলির মধ্যে প্রবাহ বুঝতে হবে।
- হোটেলগুলির লবির কার্যকলাপ, বার ব্যবহার এবং কনফারেন্স ট্রাফিকের তুলনা করা প্রয়োজন।
- Hospitals-এর ওয়েটিং প্যাটার্ন এবং বিভাগগুলোর মধ্যে চলাচলের গতিবিধি আরও ভালোভাবে দেখার প্রয়োজন।
- আবাসিক এবং মিশ্র-ব্যবহারের প্রোপার্টি-গুলোর জানা প্রয়োজন কীভাবে সাধারণ শেয়ার্ড স্পেস ব্যবহার করা হচ্ছে।
আচরণগত অ্যানালিটিক্স তখনই গুরুত্বপূর্ণ হয়ে ওঠে যখন একটি ভেন্যু শুধুমাত্র "কতজন এসেছেন?" তা জানার পরিবর্তে "এটি কেন ঘটলো?" - এই প্রশ্নের উত্তর খুঁজতে চায়।
WiFi কী অবদান রাখে
একটি সুপরিচালিত WiFi পরিবেশ ফার্স্ট-পার্টি ইন্টারঅ্যাকশন সংকেত সংগ্রহ করে যা অনেক ভেন্যু ইতিমধ্যে ধারণ করে কিন্তু কদাচিৎ সঠিকভাবে সাজায়। লগইন, সেশনের সময়সীমা, পুনরাবৃত্ত উপস্থিতি, অবস্থান-সচেতন অ্যাক্সেস আচরণ এবং দিনের নির্দিষ্ট সময়ের প্যাটার্ন - এই সমস্ত কিছুই একটি আরও দরকারী অপারেশনাল ভিউ তৈরিতে অবদান রাখতে পারে।
এটাই হলো বাস্তবসম্মত পরিবর্তন। নেটওয়ার্কটিকে সিলিংয়ে লুকিয়ে থাকা পাইপলাইনের মতো বিবেচনা না করে, আপনি এটিকে একটি বিজনেস ইন্টেলিজেন্স লেয়ার হিসেবে বিবেচনা করছেন যা অ্যাক্সেস পয়েন্ট এবং অথেন্টিকেশন ফ্লো-এর ওপর দিয়ে পরিচালিত হয়।
ভেন্যু প্রেক্ষাপটে আচরণগত অ্যানালিটিক্স আসলে কী
আচরণগত অ্যানালিটিক্স একটি সহজ তুলনার মাধ্যমে সবচেয়ে সহজে বোঝা যায়।
ঐতিহ্যগত ভেন্যু অ্যানালিটিক্স আপনাকে একটি ছবি দেয়। আচরণগত অ্যানালিটিক্স আপনাকে একটি টাইম-ল্যাপস ফিল্ম দেয়।
ছবিটি বলে যে আজ ৫০০টি ডিভাইস কানেক্ট হয়েছে। অন্যদিকে ফিল্মটি দেখায় যে তাদের মধ্যে অনেকেই পূর্ব দিকের প্রবেশদ্বার দিয়ে এসেছেন, একটি অংশ ফুড হলের কাছাকাছি অবস্থান করেছেন, কয়েকজন সপ্তাহের শেষ দিকে ফিরে এসেছেন এবং অন্যরা কখনোই সামনের কনকোর্স পেরিয়ে যাননি। একটি ফরম্যাট কেবল অ্যাক্টিভিটি রিপোর্ট করে। অন্যটি আচরণ ব্যাখ্যা করতে সাহায্য করে।
বিচ্ছিন্ন ঘটনা থেকে জার্নি পর্যন্ত
শব্দটি প্রায়শই বিভ্রান্তির সৃষ্টি করে কারণ এটি শুনতে যতটা জটিল মনে হয়, আসলে ততটা নয়। এর মানে এই নয় যে কোনো রহস্যময় AI মানুষের সম্পর্কে অনুমান করছে। এর মানে হলো সময়ের সাথে সাথে ঘটে যাওয়া একটি সিকোয়েন্স বা কাজের ধারাবাহিকতা লক্ষ্য করা এবং জিজ্ঞাসা করা যে এগুলো কী ধরনের প্যাটার্ন তৈরি করছে।
একটি ভেন্যুতে, সেই সিকোয়েন্সটি দেখতে এইরকম হতে পারে:
- একজন ভিজিটর গেস্ট WiFi SSID দেখতে পান।
- তারা অথেন্টিকেট করেন।
- তাদের ডিভাইসটি কিছু সময়ের জন্য একটি পাবলিক জোনে থাকে।
- তারা সাইটের আরও ভেতরের দিকে যান।
- তারা অন্য কোনো দিন আবার ফিরে আসেন।
- তারা প্রথমবার আসা ভিজিটরের চেয়ে ভিন্নভাবে প্রতিক্রিয়া দেখান।
এই পুরো চেইনটি "সফলভাবে কানেক্ট হয়েছে" এমন একটি এক লাইনের রিপোর্টের চেয়ে অনেক বেশি তথ্যবহুল।
কীভাবে ভেন্যু আচরণগত অ্যানালিটিক্স ওয়েব অ্যানালিটিক্স থেকে আলাদা
ওয়েব অ্যানালিটিক্স সাধারণত ব্রাউজার বা অ্যাপের ভেতরে পেজ ভিউ, ক্লিক এবং কনভার্সনের ওপর ফোকাস করে। ভেন্যু আচরণগত অ্যানালিটিক্স একটি বাস্তব পরিবেশের মধ্যে গতিবিধি, উপস্থিতি, ফিরে আসার প্যাটার্ন এবং বাস্তব-জগতের এনগেজমেন্টের ওপর ফোকাস করে।
সহজভাবে চিন্তা করার একটি উপায়:
| View | What it asks | Venue example |
|---|---|---|
| Basic analytics | কী ঘটেছে? | আজ কতগুলি ডিভাইস সংযুক্ত হয়েছে? |
| Behavioural analytics | এটি কীভাবে প্রকাশিত হয়েছে? | কোন দর্শনার্থীরা এখানে ছিলেন, ফিরে এসেছেন, বা জোনের মধ্যে স্থানান্তরিত হয়েছেন? |
| Operational insight | আমাদের কী পরিবর্তন করা উচিত? | কর্মী নিয়োগ, দিকনির্দেশক চিহ্ন, লেআউট, নাকি প্রচারণায় পরিবর্তন আনা উচিত? |
কেন ফার্স্ট-পার্টি WiFi ডেটা অত্যন্ত মূল্যবান
WiFi ডেটা দরকারী কারণ এটি ভেন্যুর নিজস্ব পরিবেশের সাথে সরাসরি সম্পর্কিত। আপনি সম্পূর্ণভাবে থার্ড-পার্টি বিজ্ঞাপন সিগন্যাল বা সাধারণ অনুমানের ওপর নির্ভর করছেন না। আপনি পর্যবেক্ষণ করছেন কীভাবে দর্শনার্থীরা আপনার নিজস্ব নেটওয়ার্ক এবং সেই সূত্রে আপনার নিজস্ব জায়গার সাথে ইন্টারঅ্যাক্ট করছেন।
এটি অপারেটরদের নিম্নলিখিত সিদ্ধান্তগুলোর জন্য একটি শক্তিশালী ভিত্তি প্রদান করে:
- স্থান পরিকল্পনা: কোন এলাকাগুলো মনোযোগ আকর্ষণ করে কিন্তু ধরে রাখতে ব্যর্থ হয়?
- কর্মী মোতায়েন: কখন লাইন তৈরি হয়, লবিতে ভিড় বাড়ে বা পরিষেবার চাপ বৃদ্ধি পায়?
- টেন্যান্টদের সাথে আলোচনা: কোন ইউনিটগুলো কাছাকাছি শক্তিশালী ট্রাফিক ফ্লো থেকে সুবিধা পাচ্ছে?
- অভিজ্ঞতার ডিজাইন: দর্শনার্থীরা তাদের ভ্রমণের কোন পর্যায়ে গতি হারিয়ে ফেলছেন?
একটি সংখ্যা আপনাকে অকুপেন্সি বা উপস্থিতির পরিমাণ জানায়। একটি আচরণগত প্যাটার্ন আপনাকে বলে ভেন্যুটি সঠিকভাবে কাজ করছে কিনা।
ভিজিটর আচরণ বোঝার মূল কৌশলসমূহ
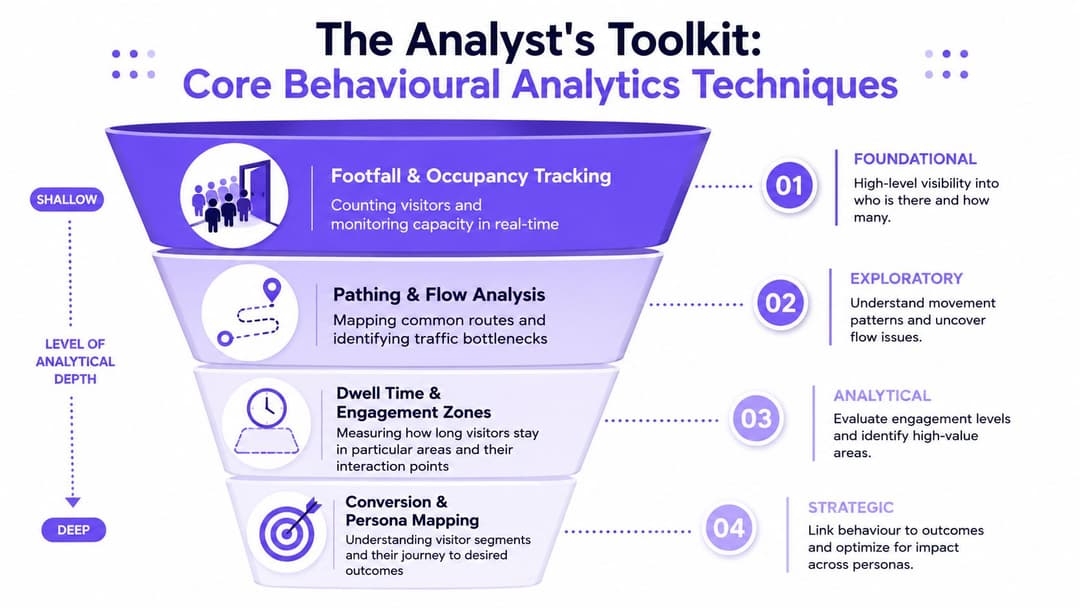
টিমগুলো একবার ডিভাইস গণনার গণ্ডি পেরিয়ে গেলে, তাদের একটি কার্যকর টুলকিটের প্রয়োজন হয়। মূল পদ্ধতিগুলো খুব জটিল কিছু নয়। এগুলো হলো WiFi ইভেন্ট ডেটাকে সিদ্ধান্তে রূপান্তর করার ব্যবহারিক উপায়।
সেগমেন্টেশন এবং কোহর্ট
সেগমেন্টেশন মানে হলো দর্শনার্থীদের তাদের সাধারণ আচরণ বা বৈশিষ্ট্যের ভিত্তিতে গ্রুপ করা। একটি ভেন্যুতে, এর অর্থ হতে পারে প্রথমবার আসা অতিথিদের সাথে বারবার আসা দর্শকদের আলাদা করা, সাধারণ ক্রেতাদের সাথে দীর্ঘ সময় থাকা ক্রেতাদের আলাদা করা, বা কর্মীদের ডিভাইসকে সাধারণ ব্যবহারকারীদের থেকে পৃথক করা।
কোহর্ট এটিকে আরও এক ধাপ এগিয়ে নিয়ে যায় একটি নির্দিষ্ট সময়কাল বা ইভেন্টের ওপর ভিত্তি করে লোকজনকে গ্রুপ করার মাধ্যমে। উদাহরণস্বরূপ, একটি সেন্টার ছুটির ক্যাম্পেইনের সময় প্রথমবার সংযুক্ত হওয়া দর্শকদের সাথে তুলনামূলক শান্ত সময়ে প্রথমবার আসা দর্শকদের তুলনা করতে পারে।
এই গ্রুপিংগুলো গুরুত্বপূর্ণ কারণ একটি গড় হিসাব অনেক সময়ই আসল সত্যকে লুকিয়ে রাখে। একটি ভেন্যুর সার্বিক পরিস্থিতি ভালো মনে হতে পারে, কিন্তু হয়তো দেখা যাবে একটি সেগমেন্ট দ্রুত চলে যাচ্ছে এবং অন্য একটি সেগমেন্ট নিয়মিত ফিরে আসছে।
ফানেল এবং প্যাথিং
ফানেল একটি নির্দিষ্ট ধারাবাহিক প্রক্রিয়ার অগ্রগতি ট্র্যাক করে। একটি বাস্তব পরিস্থিতিতে, একটি ফানেল WiFi আবিষ্কারের মাধ্যমে শুরু হতে পারে, অথেন্টিকেশনের মাধ্যমে চলতে পারে এবং দীর্ঘ সময় অবস্থান, পুনরায় আসা বা কোনো নির্দিষ্ট জোনে যাওয়ার মতো অর্থপূর্ণ অ্যাকশনের মাধ্যমে শেষ হতে পারে।
প্যাথিং ভিন্ন ধরনের। এটি দেখে যে মানুষ কোথায় যাচ্ছে। এটি নিম্নলিখিত বিষয়গুলো চিহ্নিত করার জন্য দরকারী:
- Bottlenecks: এমন ক্ষেত্র যেখানে ভিড় স্বাভাবিকের চেয়ে ধীর হয়ে যায়
- Dead zones: এমন জায়গা যা মানুষ দ্রুত অতিক্রম করে বা উপেক্ষা করে
- Natural routes: কোনো প্রম্পট ছাড়াই দর্শকরা যে পথ বেছে নেন
- Opportunity areas: সাইনেজ, অফার বা সার্ভিস পয়েন্টের জন্য উপযুক্ত স্থান
শহুরে পরিকল্পনাবিদরাও রাস্তা এবং পাবলিক প্লেসের মধ্য দিয়ে মানুষের চলাচল মূল্যায়ন করার সময় একই ধরণের যুক্তি ব্যবহার করেন। আপনি যদি WiFi জগতের বাইরে কোনো সাদৃশ্য চান, তবে Jenks-কে আরও বেশি পথচারীবান্ধব করার পদক্ষেপগুলি দেখায় যে কীভাবে চলাচলের ধরণগুলি প্রকাশ করতে পারে যে একটি জায়গা মানুষের আচরণকে সহায়তা করছে নাকি বাধাগ্রস্ত করছে।
রিটেনশন এবং অ্যাট্রিবিউশন
রিটেনশন একটি সহজ প্রশ্ন জিজ্ঞাসা করে। মানুষ কি ফিরে আসছে?
হসপিটালিটি এবং রিটেল টিমের কাছে এটি প্রায়শই এককালীন ট্রাফিকের চেয়ে অনেক বেশি দরকারী। একটি ভেন্যু জানতে চায় যে গত মাসে WiFi-এ যুক্ত হওয়া কোনো দর্শক আবার ফিরে আসছে কিনা, সাপ্তাহিক ছুটির দিনের দর্শকরা কর্মদিবসের দর্শকদের চেয়ে আলাদা কিনা এবং নির্দিষ্ট কিছু ক্যাম্পেইন বারবার আসার আচরণকে আকর্ষণ করছে নাকি কেবল সাময়িক আলোড়ন সৃষ্টি করছে।
অ্যাট্রিবিউশন কোনো আচরণকে একটি সম্ভাব্য উৎসের সাথে যুক্ত করে। একটি হোটেল একটি ফিরতি ভিজিটকে আগের কোনো ইমেল ক্যাম্পেইন বা লয়্যালটি টাচপয়েন্টের সাথে যুক্ত করতে পারে। একটি রিটেল ভেন্যু স্থানীয় কোনো প্রচারণার পর আসা দর্শকদের সাধারণ পথচারীদের সাথে তুলনা করতে পারে।
আইডেন্টিটি রেজোলিউশন হলো সবচেয়ে কঠিন অংশ
এটি অনেক প্রজেক্টের ব্যর্থতার একটি সাধারণ কারণ। সমস্যাটি আরও বেশি ইভেন্ট সংগ্রহ করা নয়। সমস্যাটি হলো কোন ইভেন্টগুলি একসাথে সম্পর্কিত তা জানা।
আচরণগত বিশ্লেষণ তখনই কার্যকর হয় যখন টিমগুলি একটি স্থায়ী অনন্য আইডেন্টিফায়ার ব্যবহার করে বিভিন্ন ডিভাইস এবং চ্যানেল জুড়ে ইভেন্টগুলিকে একটি ধারাবাহিক যাত্রার সাথে সংযুক্ত করতে পারে, যা Mixpanel-এর আচরণগত বিশ্লেষণের নির্দেশিকা -তে ব্যাখ্যা করা হয়েছে। ভেন্যু অপারেটরদের জন্য এর অর্থ হলো মডেলটিকে একটি খণ্ডিত আইডেন্টিফায়ারের ট্রেইল থেকে একজন আসল রিটার্নিং ভিজিটরকে আলাদা করতে সক্ষম হতে হবে।
বিভ্রান্তির একটি সাধারণ কারণ হলো ডিভাইস-লেভেলের অস্থিরতা। MAC randomisation -এর মতো ফিচারগুলি একজন একক ব্যক্তিকে একাধিক "নতুন" ভিজিটর হিসেবে দেখাতে পারে যদি নেটওয়ার্ক এবং অ্যানালিটিক্স পদ্ধতিটি সতর্কতার সাথে ডিজাইন করা না হয়। Purple-এর MAC randomisation simulator -এর মতো টুলগুলি টিমগুলিকে রিপোর্টিংয়ের উপর আইডেন্টিটি ফ্র্যাগমেন্টেশনের প্রভাব বুঝতে সাহায্য করে, যাতে তারা ফলাফলের উপর অতিরিক্ত নির্ভর করার আগে সতর্ক হতে পারে।
ব্যবহারিক নিয়ম: যদি আপনার ডেটা নির্ভরযোগ্যভাবে ভিজিটগুলিকে একটি যাত্রার সাথে সংযুক্ত করতে না পারে, তবে আপনার ড্যাশবোর্ডগুলি নির্ভুল দেখাতে পারে কিন্তু আপনার সিদ্ধান্তগুলি ভুল থেকে যাবে।
বিভিন্ন শিল্প জুড়ে বাস্তব জগতের ব্যবহারের ক্ষেত্র
আচরণগত বিশ্লেষণের মূল্য তখনই সবচেয়ে দ্রুত প্রকাশ পায় যখন কোনো ভেন্যুর কাছে একটি কঠিন কর্মক্ষম প্রশ্ন থাকে। "আরও ভালো ইনসাইট" পাওয়ার কোনো অস্পষ্ট ইচ্ছা নয়, বরং একটি নির্দিষ্ট প্রশ্ন।
কেন লবি ভিড়ে ঠাসা কিন্তু বারটি অব্যবহৃত থাকে? কেন শপিং মলের একটি অংশ ব্যস্ততম দিনগুলিতেও শান্ত মনে হয়? কাগজের সময়সূচী ঠিক থাকা সত্ত্বেও রোগীরা কেন বিলম্বের কথা জানান?
হসপিটালিটি এবং রিটেইল এর উদাহরণ
একটি হোটেল WiFi-ভিত্তিক আচরণগত ডেটা ব্যবহার করে দেখতে পারে অতিথিরা কীভাবে সারাদিন লবি, রেস্তোরাঁ, বার এবং ব্যবসায়িক সুবিধাগুলো ব্যবহার করছেন। অতিথিরা যদি লবিতে সময় কাটান কিন্তু সন্ধ্যার শুরুতে বারে না যান, তাহলে সমস্যাটি সাইনেজ, স্টাফিং, অফারের সময় বা লেআউট সংক্রান্ত হতে পারে। কনফারেন্সে আসা ব্যক্তিরা যদি কোনো একটি এলাকায় জড়ো হন এবং অন্য এলাকা থেকে চলে যান, তবে অনুমানের ওপর নির্ভর না করে ভেন্যু কর্তৃপক্ষ সার্ভিস প্লেসমেন্ট সমন্বয় করতে পারে।
রিটেইল ক্ষেত্রে, লিজিং এবং লেআউট আলোচনার সময় আচরণগত বিশ্লেষণ অত্যন্ত কার্যকর হয়ে ওঠে। মল পরিচালনাকারী দলগুলো সাধারণ রুটগুলি ম্যাপ করতে পারে, উচ্চ-ব্যস্ততার জোনগুলির সাথে সাধারণ যাতায়াতের করিডোরগুলির তুলনা করতে পারে এবং কোন এলাকাগুলো নিছক ট্রাফিকের বদলে প্রকৃত ডুয়েল টাইম (dwell time) তৈরি করছে তা সনাক্ত করতে পারে। এটি লিজিং দলগুলিকে ভাড়াটেদের সাথে আলোচনার জন্য আরও ভালো ভিত্তি দেয় এবং অপারেশন দলগুলিকে কোথায় ইভেন্ট বা প্রচারমূলক কার্যক্রম চালানো উচিত তা নির্ধারণ করতে সহায়তা করে।
রিটেইল পরিবেশের চারপাশের বাণিজ্যিক দৃষ্টিভঙ্গি সম্পর্কে জানতে, TheRetailBroker's market outlook একটি দরকারী অনুস্মারক যে জায়গার পারফরম্যান্স এখন কেবল অকুপেন্সির সাথে নয়, অভিজ্ঞতার সাথেও ওতপ্রোতভাবে জড়িত।
হেলথকেয়ার এবং প্রোপার্টি অপারেশন
হাসপাতাল এবং ক্লিনিকগুলি প্রায়শই ধারণাগত পার্থক্যের মুখোমুখি হয়। একটি সময়সূচী কাগজে-কলমে দক্ষ মনে হতে পারে, কিন্তু রোগীরা দীর্ঘ সময় অপেক্ষা, ভিড় বা বিভিন্ন বিভাগের মধ্যে বিভ্রান্তিকর যাতায়াতের সম্মুখীন হতে পারেন। আচরণগত বিশ্লেষণ দলগুলিকে দেখতে সাহায্য করে যে মানুষ কোথায় ভিড় করছে, তারা ওয়েটিং এরিয়াতে কতক্ষণ থাকছে এবং সাইটের মধ্য দিয়ে তাদের চলাচল আশানুরূপ কেয়ার পাথওয়ের সাথে মিলছে কি না।
প্রোপার্টি ম্যানেজাররা ভিন্ন একটি প্রেক্ষাপটে একই ধরনের সমস্যার মুখোমুখি হন। শেয়ারড লাউঞ্জ, কো-ওয়ার্কিং স্পেস, জিম এবং সাধারণ এলাকাগুলি তৈরি এবং রক্ষণাবেক্ষণ করতে অর্থ ব্যয় হয়। WiFi থেকে প্রাপ্ত আচরণগত প্যাটার্নগুলি দেখাতে পারে যে সেই সুবিধাগুলি আদৌ ব্যবহৃত হচ্ছে কি না, কখন সেগুলির ব্যবহার সর্বোচ্চ পর্যায়ে পৌঁছায় এবং কিছু সুবিধা বারবার ব্যবহারকারীদের আকর্ষণ করছে কি না, নাকি অন্যগুলি স্রেফ আলংকারিক হিসেবে পড়ে রয়েছে।
আধুনিক অপারেশনের মূল ভিত্তিগত সমস্যা
ভেন্যু দলগুলির আচরণ ভুলভাবে বোঝার একটি অন্যতম কারণ হলো তারা ধরে নেয় যে একটি স্থিতিশীল স্বাভাবিক প্যাটার্ন বিদ্যমান। বাস্তবে, অনেক পরিবেশের বেসলাইন এখন ক্রমাগত পরিবর্তিত হচ্ছে।
যেমনটি Vectra's discussion of behavioural analytics -এ উল্লেখ করা হয়েছে, বেশিরভাগ আচরণগত বিশ্লেষণ মডেল একটি স্থিতিশীল "স্বাভাবিক" প্যাটার্ন ধরে নেয়, কিন্তু আধুনিক কাজের অভ্যাস এবং হাইব্রিড কার্যক্রম সেই বেসলাইনকে স্থিতিশীল রাখা অনেক বেশি কঠিন করে তোলে। ভেন্যুগুলির জন্য এর অর্থ হলো দর্শনার্থীদের মিশ্রণে পরিবর্তন আসাটা কোনো ব্যতিক্রমী বিষয় নাও হতে পারে। এটিই হতে পারে নতুন অপারেটিং রিদম।
এটি এই ধরণের স্থানগুলির ক্ষেত্রে গুরুত্বপূর্ণ:
- মিশ্র-ব্যবহারের উন্নয়ন প্রকল্পসমূহ (Mixed-use developments) যেখানে কার্যদিবস এবং ছুটির দিনের দর্শকদের আচরণ আলাদা হয়
- কর্পোরেট ক্যাম্পাসসমূহ যেখানে দল এবং দিন অনুযায়ী উপস্থিতি ভিন্ন হয়
- পরিবহন হাবসমূহ (Transport hubs) যেখানে ঋতুভিত্তিক পরিবর্তনের কারণে চাহিদার ধরণ পরিবর্তিত হয়
- হসপিটালিটি সাইটসমূহ যেখানে বিশেষ ইভেন্টগুলি সাময়িকভাবে স্বাভাবিক ট্রাফিককে নতুনভাবে সংজ্ঞায়িত করতে পারে
স্মার্ট সিদ্ধান্ত সব ধরণের বিচ্যুতিকে অনুসরণ করা নয়। কোন পরিবর্তনগুলির বিরুদ্ধে পদক্ষেপ নেওয়া প্রয়োজন এবং কোনগুলি নতুন প্যাটার্ন নির্দেশ করছে তা নির্ধারণ করাই হলো আসল কাজ।
বাস্তবায়ন এবং আর্কিটেকচারের একটি ব্লুপ্রিন্ট
ভেন্যুগুলির জন্য একটি আচরণগত অ্যানালিটিক্স স্ট্যাক অনেকটা প্লাম্বিং সিস্টেমের মতো কাজ করে।
অ্যাক্সেস পয়েন্ট এবং অনবোর্ডিং ফ্লো হলো ট্যাপ। ডেটা ইনজেশন হলো পাইপওয়ার্ক। স্টোরেজ হলো ট্যাঙ্ক। প্রসেসিং হলো ফিল্টার। ড্যাশবোর্ড এবং অ্যালার্ট হলো ফিক্সচার যা মানুষ ব্যবহার করে। যদি কোনো একটি অংশ ভুলভাবে বসানো হয়, তবে পুরো সিস্টেমটি কোলাহলপূর্ণ, ত্রুটিযুক্ত বা বিভ্রান্তিকর হয়ে ওঠে।
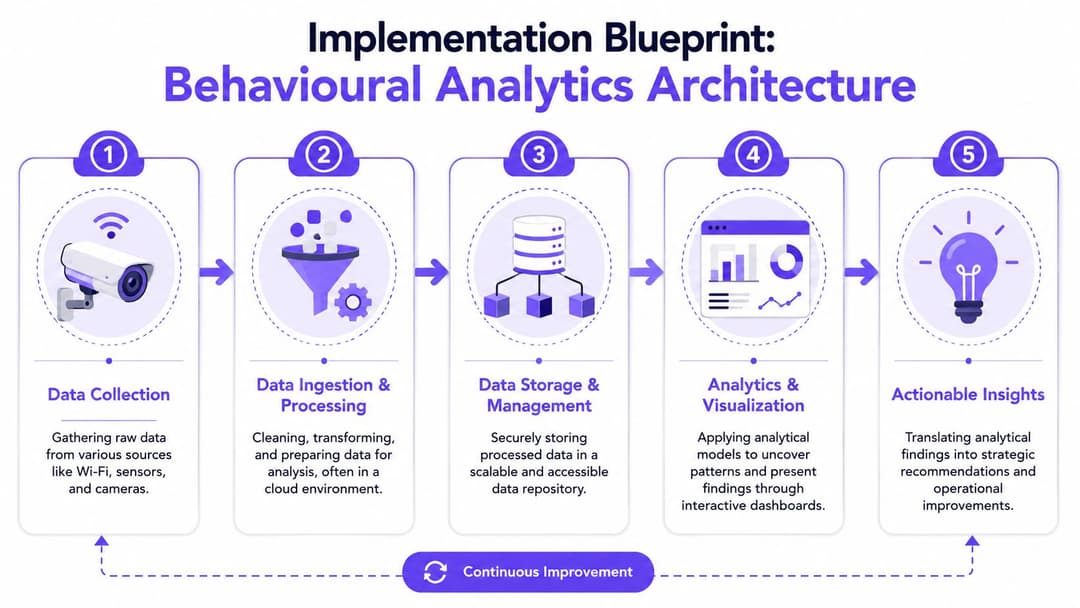
সহজ ভাষায় ডেটা ফ্লো
এজ-এ, নেটওয়ার্ক র ডেটা ক্যাপচার করে। এর মধ্যে অথেন্টিকেশন অ্যাক্টিভিটি, সেশন টাইমিং, ডিভাইসের ধরণ এবং অ্যাক্সেস জোনের মধ্যে চলাচল অন্তর্ভুক্ত থাকতে পারে। সাধারণত এই রেকর্ডগুলি গোছানো থাকে না। কিছু রেকর্ড অসম্পূর্ণ থাকে। কিছু মানুষের আচরণের চেয়ে ইনফ্রাস্ট্রাকচারের আচরণকে বেশি প্রতিফলিত করে। এটি খুবই স্বাভাবিক।
পরবর্তী ধাপটি এই ফিডকে পরিচ্ছন্ন এবং সুবিন্যস্ত করে। টিমগুলি টাইমস্ট্যাম্প স্ট্যান্ডার্ডাইজ করে, অপ্রয়োজনীয় ডেটা বাদ দেয় এবং কোন ইভেন্টগুলি সংরক্ষণ করার মতো গুরুত্বপূর্ণ তা নির্ধারণ করে। এরপর ডেটা স্টোরেজে স্থানান্তরিত হয়, যা সাধারণত একটি ওয়্যারহাউস বা অ্যানালিটিক্স প্ল্যাটফর্ম, যেখানে এটি নিয়মিত কোয়েরি করা যায়।
এর পরে আসে এনরিচমেন্ট। ভেন্যু ডেটা তখন বিজনেস ইন্টেলিজেন্সে রূপান্তরিত হয়। নেটওয়ার্ক ইভেন্টগুলিকে CRM রেকর্ড, বুকিং সিস্টেম, লয়্যালটি স্ট্যাটাস, মার্কেটিং পারমিশন বা লোকেশন হায়ারার্কির সাথে মেলানো হতে পারে। এটি সতর্কতার সাথে করা হলে, এটি এমন একটি কনটেক্সট তৈরি করে যা "ডিভাইস দেখা গেছে"-কে "পুনরাবৃত্ত গ্রাহকের আচরণ লক্ষ্য করা গেছে"-তে রূপান্তর করে।
কেন সিকিউরিটি হেরিটেজ গুরুত্বপূর্ণ
আচরণগত অ্যানালিটিক্সের উৎপত্তি মার্কেটিং-এ হয়নি। এর শক্তিশালী ভিত্তি রয়েছে সাইবার সিকিউরিটিতে।
Splunk-এর আচরণগত অ্যানালিটিক্সের ব্যাখ্যা অনুযায়ী, স্বাভাবিক প্যাটার্ন থেকে বিচ্যুতি সনাক্ত করে ইউজার এবং এন্টিটি অ্যাক্টিভিটি বিশ্লেষণ করার জন্য এটি দীর্ঘকাল ধরে এন্টারপ্রাইজ নেটওয়ার্কিং-এ ব্যবহৃত হয়ে আসছে। একই লজিক এখন ভেন্যু টিমগুলিকে ভিজিটরদের যাত্রা বুঝতে সাহায্য করে। লগইন সময়, ডিভাইসের ধরণ এবং অ্যাক্সেস প্যাটার্নগুলি থ্রেট ডিটেকশন অথবা গ্রাহকের আচরণ বোঝার ক্ষেত্রে সহায়তা করতে পারে, যা সম্পূর্ণ নির্ভর করে আপনি কী জানতে চাইছেন তার ওপর।
এই রূপান্তরটি IT লিডারদের জন্য অত্যন্ত দরকারী কারণ এর অর্থ হলো এই পদ্ধতিটি ইতিমধ্যেই পরিচিত। আপনি এখনও আচরণের বেসলাইন তৈরি করছেন, প্যাটার্ন খুঁজছেন এবং কোন সিগন্যালগুলোর বিপরীতে ব্যবস্থা নেওয়া উচিত তা নির্ধারণ করছেন। শুধুমাত্র ব্যবসায়িক ব্যবহারের ক্ষেত্রটি পরিবর্তিত হয়।
একটি ব্যবহারিক ইমপ্লিমেন্টেশন চেকলিস্ট
একটি ভেন্যুর কাজ শুরু করার জন্য বিশাল কোনো রূপান্তর প্রকল্পের প্রয়োজন নেই। এর জন্য একটি সুনির্দিষ্ট এবং সুরক্ষিত ডিজাইন প্রয়োজন।
- প্রথমে ছোট এক সেট ব্যবহারের ক্ষেত্র বেছে নিন। বারবার ফিরে আসার হার, জোনের অবস্থান বা লবিতে ভিড়ের মতো প্রশ্নগুলো দিয়ে শুরু করুন।
- গুরুত্বপূর্ণ ইভেন্টগুলো সংজ্ঞায়িত করুন। শুধুমাত্র নেটওয়ার্ক এটি তৈরি করতে পারে বলেই সমস্ত ডেটা ইনজেস্ট করবেন না।
- পরিচয় সংক্রান্ত নিয়মগুলো শুরুতেই নির্ধারণ করুন। অতিরিক্ত তথ্য সংগ্রহ না করে কীভাবে আপনি ভিজিটগুলোকে সংযুক্ত করবেন তা ঠিক করুন।
- অপারেশনাল ড্যাশবোর্ডকে স্ট্র্যাটেজিক রিপোর্টিং থেকে আলাদা করুন। রিয়েল-টাইম উপস্থিতি এবং দীর্ঘমেয়াদী আচরণগত প্রবণতা ভিন্ন ভিন্ন দর্শকদের পরিবেশন করে।
- পরিচিত পরিস্থিতি দিয়ে পরীক্ষা করুন। মডেলটি বাস্তবতার সাথে মিলছে কিনা তা নিশ্চিত করতে কর্মীদের যাতায়াত বা নিয়ন্ত্রিত প্রবাহ ব্যবহার করুন।
- শুধুমাত্র যেখানে স্পষ্ট মূল্য রয়েছে সেখানেই সংহত করুন। CRM, লয়্যালটি, বুকিং এবং সার্ভে সিস্টেমগুলো তখন দরকারী যখন তারা একটি নির্দিষ্ট প্রশ্নের উত্তর দেয়।
কিছু টিম এই প্রক্রিয়াটিকে দ্রুততর করতে বিশেষায়িত প্ল্যাটফর্ম ব্যবহার করে। উদাহরণস্বরূপ, Purple-এর WiFi অ্যানালিটিক্স গাইড রূপরেখা দেয় যে কীভাবে গেস্ট নেটওয়ার্ক ডেটা ভিজিট, মুভমেন্ট এবং এনগেজমেন্টের রিপোর্টিংয়ে ফিড করতে পারে, পাশাপাশি পরিচয়-সচেতন অ্যাক্সেস টুলও প্রদান করে।
প্রথমে সিদ্ধান্তের চারপাশে মডেলটি তৈরি করুন। আর্কিটেকচারটি প্রশ্নের উত্তর দেওয়ার জন্য হওয়া উচিত, এর বিপরীত নয়।
প্রাইভেসি কমপ্লায়েন্স পরিচালনা এবং বিশ্বাস গড়ে তোলা
প্রাইভেসি সংক্রান্ত কাজ আচরণগত অ্যানালিটিক্সের গতি কমিয়ে দেয় না। বরং দুর্বল প্রাইভেসি ডিজাইন এটি করে।
টিমগুলো যখন একেবারে শেষে সম্মতি এবং গভর্নেন্স যুক্ত করে, তখন তারা সাধারণত আবিষ্কার করে যে তারা যে ডেটা ব্যবহার করতে চেয়েছিল তা তাদের অনুমান অনুযায়ী ব্যবহার করা যাচ্ছে না। যখন শুরুতেই প্রাইভেসি ডিজাইন করা হয়, তখন অ্যানালিটিক্স মডেলটি আরও পরিচ্ছন্ন, সুরক্ষিত এবং লিগ্যাল, অপারেশনস ও ফাইন্যান্সের অভ্যন্তরীণ যাচাইকরণে টিকে থাকার সম্ভাবনা বেশি থাকে।
সম্মতি টেকনিক্যাল ডিজাইনের একটি অংশ
UK-তে, Information Commissioner's Office ওয়েবসাইট এবং অ্যাপে আচরণগত অ্যানালিটিক্সকে অনলাইন ট্র্যাকিং হিসেবে বিবেচনা করে যখন এটি কুকিজের মতো আইডেন্টিফায়ার ব্যবহার করে, এবং প্রতিষ্ঠানগুলোর সাধারণত বৈধ সম্মতির প্রয়োজন হয় যদি না কার্যক্রমটি অত্যন্ত জরুরি হয়, যা ICO প্রত্যাশা কভার করা এই TDWI আর্টিকেলে আলোচনা করা হয়েছে। ভেন্যু টিমগুলোর জন্য ব্যবহারিক শিক্ষাটি সহজ। সম্মতি ডিজাইন কোনো ব্যানার আকারে পরে ভাবার বিষয় নয়। এটি সিস্টেম আর্কিটেকচারের একটি অংশ।
একটি WiFi অনবোর্ডিং ফ্লোতে এটি স্পষ্ট করা উচিত:
- কী ডেটা সংগ্রহ করা হচ্ছে
- কেন এটি সংগ্রহ করা হচ্ছে
- এটি কীভাবে পরিষেবা বা অ্যানালিটিক্সকে সমর্থন করে
- ব্যবহারকারীর কী কী বিকল্প রয়েছে
- কতক্ষণ তথ্য সংরক্ষণ করা হয়
বিশ্বাস ডেটার গুণগত মান বাড়ায়
কিছু অপারেটর এখনও মনে করেন যে গোপনীয়তা রক্ষা অ্যানালিটিক্সকে দুর্বল করে দেয় কারণ এটি ডেটা সংগ্রহকে সীমিত করে। সাধারণত এর বিপরীতটাই সত্য। একটি সুশৃঙ্খল, স্বচ্ছ প্রোগ্রাম টিমগুলোকে ন্যূনতম প্রয়োজনীয় ডেটা সংগ্রহ করতে, এর উদ্দেশ্য নথিভুক্ত করতে এবং কম-মূল্যের সিগন্যালের স্তূপ তৈরি করা এড়াতে বাধ্য করে।
এটি বিশ্লেষণের জন্য আরও ভালো পরিবেশ তৈরি করে:
| দুর্বল অনুশীলন | উন্নত অনুশীলন |
|---|---|
| সবকিছু সংগ্রহ করে পরে বিন্যাস করা | শুধুমাত্র একটি সুনির্দিষ্ট ব্যবহারের ক্ষেত্রে কার্যকর ডেটা সংগ্রহ করা |
| জটিল আইনি ভাষায় অ্যানালিটিক্স শর্তাবলী লুকিয়ে রাখা | অনবোর্ডিংয়ের সময় সহজ ভাষায় সেগুলি বুঝিয়ে বলা |
| অভ্যাসবশত ডেটাসেট মার্জ বা একত্রিত করা | শুধুমাত্র বৈধ এবং সংজ্ঞায়িত উদ্দেশ্যে একত্রিত করা |
| শনাক্তকারী উপাদানগুলো অনির্দিষ্টকালের জন্য রেখে দেওয়া | সংরক্ষণ এবং পর্যালোচনার নিয়ম নির্ধারণ করা |
ভেন্যু টিমগুলোর পরবর্তী করণীয়
IT এবং অপারেশন টিমগুলোর একটি যৌথ কর্মপরিকল্পনা প্রয়োজন। নেটওয়ার্ক লিডাররা সিগন্যাল সংগ্রহ বুঝতে পারেন। কমপ্লায়েন্স টিমগুলো আইনি ভিত্তি এবং মিনিমাইজেশন বোঝেন। ভেন্যু লিডাররা ব্যবসায়িক প্রশ্ন বোঝেন। আচরণগত অ্যানালিটিক্স বা behavioural analytics তখনই কাজ করে যখন এই তিনটি গ্রুপ সমস্যাটি এড়ানোর পরিবর্তে একসাথে বসে ডিজাইন করে।
আপনি যদি নিজের দৃষ্টিভঙ্গি পর্যালোচনা করতে চান, তবে বাস্তব ক্ষেত্রে সম্মতি, স্বচ্ছতা এবং ভেন্যু অ্যানালিটিক্স কীভাবে সম্পর্কিত, সে বিষয়ে একটি দরকারি রেফারেন্স হিসেবে Purple-এর গেস্ট WiFi ডেটা গোপনীয়তা সংক্রান্ত ওভারভিউটি দেখতে পারেন।
সবচেয়ে শক্তিশালী অ্যানালিটিক্স প্রোগ্রাম হল সেটি, যা আপনার প্রতিষ্ঠান একজন গ্রাহক, একজন নিয়ন্ত্রক এবং নিজস্ব বোর্ডের কাছে স্পষ্টভাবে ব্যাখ্যা করতে পারে।
উপসংহার: আপনার নেটওয়ার্ককে একটি ইন্টেলিজেন্স ইঞ্জিনে রূপান্তর করা
একটি ভেন্যুর WiFi নেটওয়ার্ক ইতিমধ্যে গ্রাহকের যাত্রাপথের অনেক বেশি অংশ দেখতে পায় যা অনেক টিমই উপলব্ধি করে না। এটি আগমন, প্রত্যাবর্তন, সেশনের ধরণ, চলাচলের সিগন্যাল এবং সমস্যার মুহূর্তগুলো সনাক্ত করে। নিজে থেকে এই কাঁচা ডেটা কেবলই একটি উচ্ছিষ্ট মাত্র। আচরণগত অ্যানালিটিক্সের মাধ্যমে এটি অনেক বেশি কার্যকর কিছুতে পরিণত হয়। এটি প্রামাণ্য নথিতে পরিণত হয়।
এই পরিবর্তনটি গুরুত্বপূর্ণ কারণ ভেন্যু সংক্রান্ত সিদ্ধান্তগুলো প্রায়শই ব্যয়বহুল এবং পরিবর্তন করা কঠিন হয়। লেআউট পরিবর্তন, স্টাফিং পরিকল্পনা, লিজ নেওয়ার সিদ্ধান্ত, ওয়েটিং-রুমের নতুন ডিজাইন এবং সুযোগ-সুবিধার ক্ষেত্রে বিনিয়োগের মতো বিষয়গুলো তখনই উপকৃত হয় যখন টিমগুলো কেবল কী ঘটেছে তা নয়, বরং দর্শনার্থীরা কেমন আচরণ করেছে তাও বুঝতে পারে।
IT ম্যানেজারদের জন্য এটি নেটওয়ার্ককে কেবল অবকাঠামো বা ইনফ্রাস্ট্রাকচারের চেয়েও বেশি কিছু হিসেবে উপস্থাপন করার একটি সুযোগ। অপারেটরদের জন্য এটি অনুমান এবং এককালীন গণনার বাইরে যাওয়ার একটি উপায়। মূল মূল্যটি আরও বেশি সিগন্যাল সংগ্রহ করার মধ্যে নয়। এটি হল সঠিক ফার্স্ট-পার্টি WiFi সিগন্যালগুলোকে এমন প্যাটার্নে রূপান্তর করা যা আপনি বিশ্বাস করতে পারেন, ব্যাখ্যা করতে পারেন এবং সেই অনুযায়ী পদক্ষেপ নিতে পারেন।
আপনি যদি গেস্ট এবং স্টাফদের WiFi-কে আচরণগত অন্তর্দৃষ্টির একটি দরকারী উৎসে পরিণত করতে চান, তবে Purple আইডেন্টিটি-ভিত্তিক নেটওয়ার্কিং এবং অ্যানালিটিক্স টুল সরবরাহ করে যা ভেন্যুগুলোকে এক এনভায়রনমেন্টে অ্যাক্সেস ইভেন্ট, ভিজিটর জার্নি এবং অপারেশনাল রিপোর্টিং সংযুক্ত করতে সাহায্য করে।


