WiFi Survey Software: আপনার ওয়্যারলেস নেটওয়ার্ক কীভাবে ম্যাপ করবেন এবং অপ্টিমাইজ করবেন
এই নির্দেশিকাটি আইটি ম্যানেজার এবং নেটওয়ার্ক আর্কিটেক্টদের এন্টারপ্রাইজ ওয়্যারলেস নেটওয়ার্ক ম্যাপ, অপ্টিমাইজ এবং সমস্যা সমাধানের জন্য WiFi সার্ভে সফটওয়্যার ব্যবহারের কার্যকর কৌশল সরবরাহ করে। এটি প্রয়োজনীয় সার্ভে প্রকার, গুরুত্বপূর্ণ RF মেট্রিক্স, স্থাপনার সেরা অনুশীলন এবং ব্যবসায়িক বিশ্লেষণের সাথে সার্ভে ডেটার একীকরণ কভার করে।
🎧 এই গাইডটি শুনুন
ট্রান্সক্রিপ্ট দেখুন
কার্যনির্বাহী সারসংক্ষেপ
আধুনিক স্থানগুলির জন্য, ওয়্যারলেস নেটওয়ার্ক আর কেবল একটি আইটি ইউটিলিটি নয়; এটি অতিথি সন্তুষ্টি, অপারেশনাল দক্ষতা এবং ডিজিটাল রাজস্ব প্রবাহের মূল অবকাঠামো। আপনি ২০০ কক্ষের একটি হোটেল, ৫০টি শাখা সহ একটি খুচরা সম্পত্তি, বা একটি বড় স্টেডিয়াম পরিচালনা করুন না কেন, কঠোর যাচাইকরণ ছাড়াই স্থাপন করা নেটওয়ার্কগুলির উপর নির্ভর করা একটি উল্লেখযোগ্য অপারেশনাল ঝুঁকি।
WiFi survey software এই ঝুঁকি কমানোর জন্য অপরিহার্য সরঞ্জাম। এটি নেটওয়ার্ক আর্কিটেক্টদের রেডিও ফ্রিকোয়েন্সি (RF) পরিবেশ পরিমাপ, ম্যাপ এবং মডেল করতে দেয়, যা অদৃশ্য সংকেত প্রচারকে কার্যকর হিটম্যাপে রূপান্তরিত করে। এই নির্দেশিকাটি WiFi সাইট সার্ভের মূল প্রক্রিয়াগুলি তুলে ধরে, উচ্চ-ঘনত্বের পরিবেশের জন্য প্রয়োজনীয় গুরুত্বপূর্ণ মেট্রিকগুলি বিস্তারিতভাবে বর্ণনা করে এবং আপনার ওয়্যারলেস অবকাঠামো যাতে ধারাবাহিক, উচ্চ-পারফরম্যান্স সংযোগ সরবরাহ করে তা নিশ্চিত করার জন্য একটি বিক্রেতা-নিরপেক্ষ বাস্তবায়ন কাঠামো সরবরাহ করে।
প্রযুক্তিগত গভীর-পর্যালোচনা
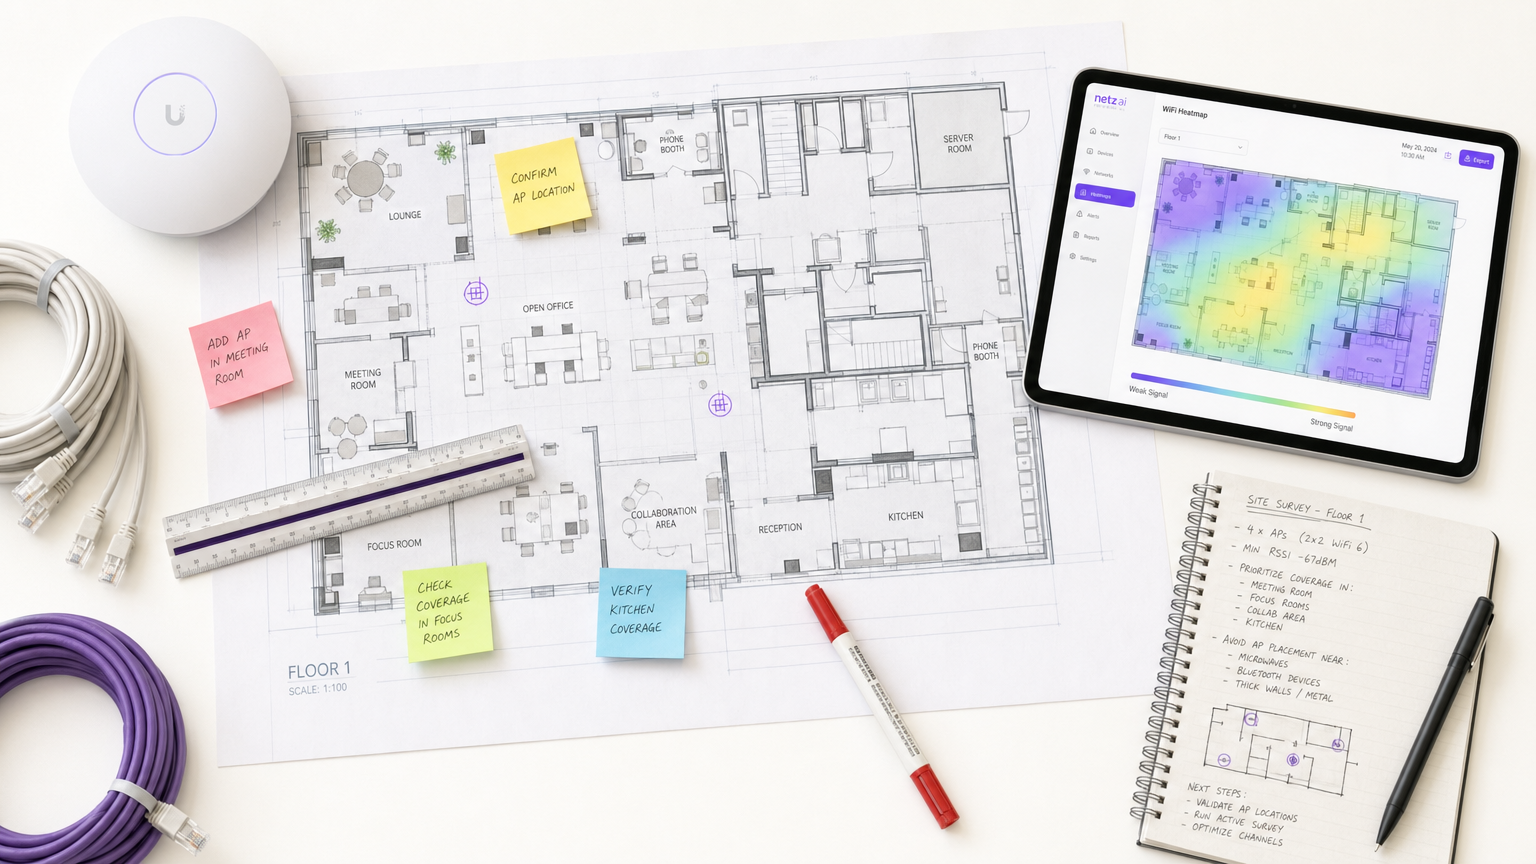
WiFi সাইট সার্ভে সফটওয়্যার কাঁচা RF ডেটাকে ভিজ্যুয়াল হিটম্যাপে রূপান্তরিত করে, যা সুনির্দিষ্ট নেটওয়ার্ক ইঞ্জিনিয়ারিং সক্ষম করে। বিভিন্ন ধরণের সার্ভে এবং তারা যে মেট্রিকগুলি ক্যাপচার করে তা বোঝা কার্যকর নেটওয়ার্ক ডিজাইনের জন্য মৌলিক।
WiFi সার্ভের প্রকারভেদ
- প্যাসিভ সার্ভে: সার্ভে ডিভাইসটি একটি অ্যাক্সেস পয়েন্ট (AP) এর সাথে যুক্ত না হয়ে RF পরিবেশে শোনে। এটি বীকন ফ্রেম ক্যাপচার করে, সমস্ত দৃশ্যমান AP জুড়ে Received Signal Strength Indicator (RSSI) পরিমাপ করে এবং ফ্লোর প্ল্যান স্থানাঙ্কের বিপরীতে ডেটা লগ করে। এটি আপনার বেসলাইন স্থাপন করে এবং দুর্বৃত্ত AP বা বাহ্যিক হস্তক্ষেপ সনাক্ত করে।
- অ্যাক্টিভ সার্ভে: সার্ভে ডিভাইসটি বাস্তব-বিশ্বের থ্রুপুট পরীক্ষা (UDP এবং TCP) করার জন্য নেটওয়ার্কের সাথে সংযুক্ত হয়। এটি প্রকৃত ডেটা রেট, প্যাকেট লস এবং ল্যাটেন্সি পরিমাপ করে। ভিডিও কনফারেন্সিং বা IoT সেন্সর নেটওয়ার্কের মতো রিয়েল-টাইম অ্যাপ্লিকেশন সমর্থনকারী স্থানগুলির জন্য অ্যাক্টিভ সার্ভে অপরিহার্য।
- প্রেডিক্টিভ (ভার্চুয়াল) সার্ভে: সফটওয়্যার ব্যবহার করে, প্রকৌশলীরা একটি ফ্লোর প্ল্যান আমদানি করেন, নির্মাণ সামগ্রী (যেমন, কংক্রিট, কাঁচ) সংজ্ঞায়িত করেন এবং অ্যাটেনুয়েশন মান নির্ধারণ করেন। কোনো হার্ডওয়্যার ইনস্টল করার আগে সফটওয়্যারটি RF প্রচারের মডেল তৈরি করে। এটি গ্রিনফিল্ড স্থাপনার জন্য অতিরিক্ত বা অপর্যাপ্ত সংস্থান প্রতিরোধে অত্যন্ত গুরুত্বপূর্ণ।
গুরুত্বপূর্ণ RF মেট্রিকস
একটি শক্তিশালী স্থাপনা নিশ্চিত করতে, আপনার সার্ভেতে নিম্নলিখিত মেট্রিকগুলি মূল্যায়ন করতে হবে:
- RSSI (Received Signal Strength Indicator): dBm-এ পরিমাপ করা হয়। সাধারণ সংযোগের জন্য ন্যূনতম -70 dBm প্রয়োজন, যখন ভয়েস এবং ভিডিও অ্যাপ্লিকেশনের জন্য -67 dBm বা তার বেশি প্রয়োজন।
- Signal-to-Noise Ratio (SNR): সংকেত স্তর এবং ব্যাকগ্রাউন্ড নয়েজ ফ্লোরের মধ্যে পার্থক্য। নির্ভরযোগ্য অপারেশনের জন্য ন্যূনতম 25 dB SNR প্রয়োজন, উচ্চ-ঘনত্বের পরিবেশের জন্য 30 dB+ পর্যন্ত বাড়ানো যেতে পারে।
- চ্যানেল ইউটিলাইজেশন: একটি রেডিও চ্যানেল কতটা ব্যস্ত তা পরিমাপ করে। উচ্চ চ্যানেল ইউটিলাইজেশন সহ উচ্চ সংকেত শক্তি এয়ারটাইম প্রতিদ্বন্দ্বিতার কারণে দুর্বল থ্রুপুট ঘটায়।
- রোমিং আচরণ: এন্টারপ্রাইজ স্ট্যান্ডার্ড (IEEE 802.11r/k/v) ব্যবহার করে AP-এর মধ্যে পরিষ্কার হ্যান্ডঅফ যাচাই করা। আতিথেয়তা এবং ক্যাম্পাস পরিবেশে সংযোগ বিচ্ছিন্ন হওয়ার প্রধান কারণ হল দুর্বল রোমিং।
- কো-চ্যানেল ইন্টারফারেন্স (CCI): একই চ্যানেলে ওভারল্যাপিং কভারেজ সেল। সার্ভে সফটওয়্যার এই দ্বন্দ্বগুলি সনাক্ত করে, যা চ্যানেল এবং ট্রান্সমিট পাওয়ার সমন্বয়ের অনুমতি দেয়।
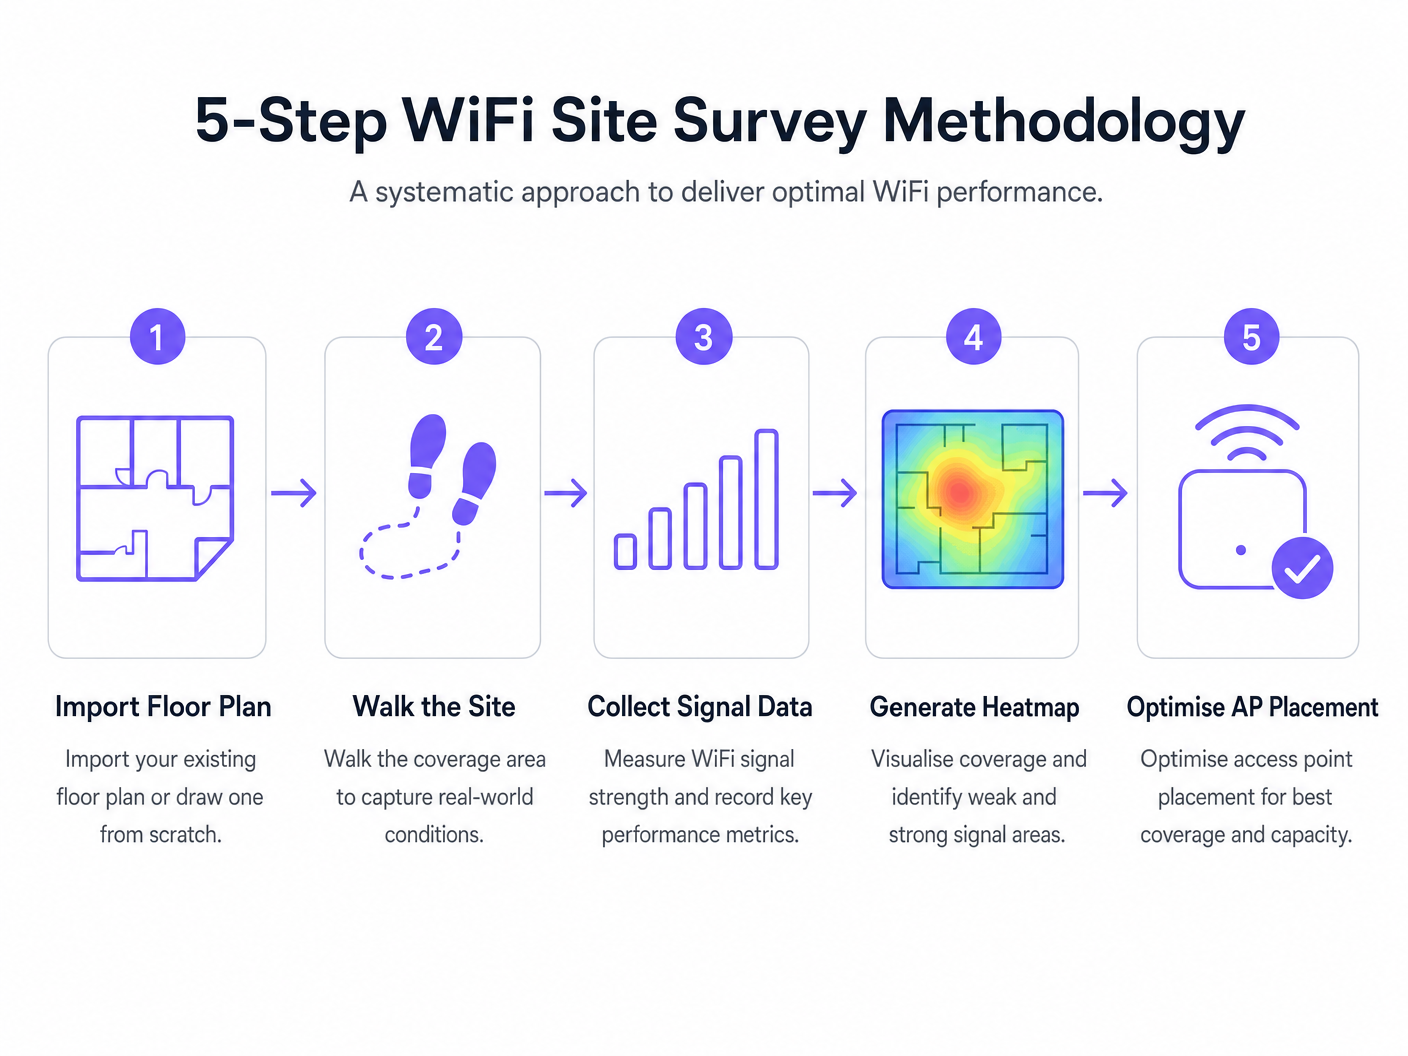
বাস্তবায়ন নির্দেশিকা
একটি ওয়্যারলেস নেটওয়ার্ক স্থাপন করার জন্য একটি পদ্ধতিগত পদ্ধতির প্রয়োজন। নিম্নলিখিত পদ্ধতিটি সর্বোত্তম AP স্থাপন এবং নেটওয়ার্ক কর্মক্ষমতা নিশ্চিত করে।
- স্থাপনার পূর্ববর্তী ভবিষ্যদ্বাণীমূলক সার্ভে: হার্ডওয়্যার সংগ্রহের আগে সর্বদা একটি ভবিষ্যদ্বাণীমূলক সার্ভে পরিচালনা করুন। সাধারণ বিক্রেতা ক্যালকুলেটরের উপর নির্ভর করা প্রায়শই কাঠামোগত RF ছায়া (যেমন, কংক্রিটের স্তম্ভ, লিফট শ্যাফট) বিবেচনা করতে ব্যর্থ হয়।
- লোড সহ অ্যাক্টিভ সার্ভে দিয়ে যাচাই করুন: একটি খালি স্থান অপারেশনাল বাস্তবতা প্রতিফলিত করে না। উচ্চ-ঘনত্বের পরিস্থিতিতে কর্মক্ষমতা পরিমাপ করতে সিমুলেটেড বা প্রকৃত ক্লায়েন্ট লোডের অধীনে অ্যাক্টিভ সার্ভে পরিচালনা করুন।
- পুনরাবৃত্তিমূলক অপ্টিমাইজেশন: প্রাথমিক স্থাপনার পরে, AP স্থাপন, চ্যানেল অ্যাসাইনমেন্ট এবং ট্রান্সমিট পাওয়ার সূক্ষ্ম-টিউন করতে অ্যাক্টিভ এবং প্যাসিভ সার্ভে ব্যবহার করুন।
- বিশ্লেষণের সাথে একীকরণ: আপনার RF কর্মক্ষমতা ডেটা ব্যবসায়িক বুদ্ধিমত্তা প্ল্যাটফর্মগুলির সাথে সংযুক্ত করুন। একটি সু-সার্ভে করা নেটওয়ার্কের উপর Guest WiFi এবং WiFi Analytics স্তর স্থাপন আপনাকে সংকেত গুণমানকে ভিজিটর থাকার সময় এবং ফুটফলের সাথে সম্পর্কযুক্ত করতে দেয়।
সেরা অনুশীলন
- সবকিছু নথিভুক্ত করুন: একটি সার্ভে রিপোর্ট একটি জীবন্ত নথি। AP অবস্থান, চ্যানেল প্ল্যান বা ট্রান্সমিট পাওয়ারের যেকোনো পরিবর্তন নথিভুক্ত করতে হবে এবং একটি সঠিক বেসলাইন বজায় রাখার জন্য পুনরায় সার্ভে করতে হবে।
- 6 GHz ব্যান্ডের জন্য হিসাব করুন: WiFi 6E এবং WiFi 7 এর দিকে স্থাপনা স্থানান্তরিত হওয়ার সাথে সাথে, সার্ভে পদ্ধতিগুলিকে 6 GHz স্পেকট্রামের জন্য হিসাব করতে হবে, যা কম হস্তক্ষেপ কিন্তু উচ্চতর অ্যাটেনুয়েশন (কম পরিসর) সরবরাহ করে।
- একটি সার্ভে ক্যাডেন্স স্থাপন করুন: সাইট সার্ভেগুলিকে একটি চলমান অপারেশনাল অনুশীলন হিসাবে বিবেচনা করুন। নতুন ভাড়াটে, কাঠামোগত পরিবর্তন বা মৌসুমী দখলের পরিবর্তনের কারণে RF পরিবেশ পরিবর্তিত হয়। উচ্চ-ঘনত্বের স্থানগুলিতে ত্রৈমাসিক ক্যাডেন্স গ্রহণ করা উচিত, যখন স্ট্যান্ডার্ড অফিসগুলিতে বার্ষিক সার্ভে প্রয়োজন হতে পারে।
সমস্যা সমাধান এবং ঝুঁকি প্রশমন
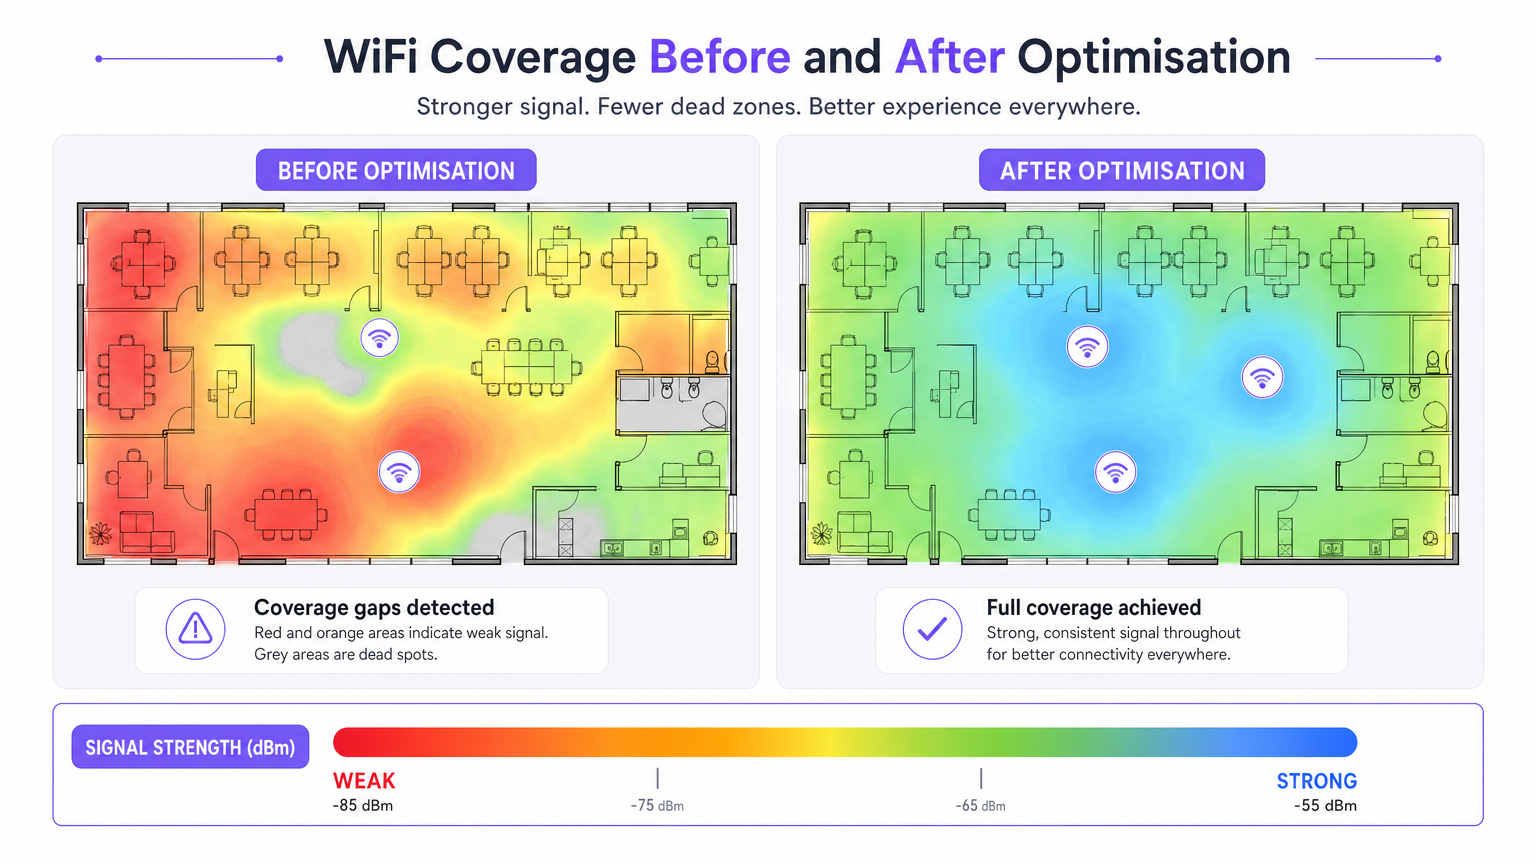
- কভারেজ গ্যাপ (ডেড স্পট): প্রায়শই অপ্রত্যাশিত কাঠামোগত অ্যাটেনুয়েশনের কারণে ঘটে। প্রশমন: ভবিষ্যদ্বাণীমূলক সার্ভের উপর নির্ভর করুন যা যাচাই করা হয়েছেপোস্ট-ডিপ্লয়মেন্ট প্যাসিভ সার্ভে দ্বারা।
- উচ্চ হস্তক্ষেপ: প্রতিবেশী নেটওয়ার্ক বা নন-WiFi ডিভাইস (যেমন, মাইক্রোওয়েভ, ব্লুটুথ) নয়েজ ফ্লোর বাড়িয়ে দিচ্ছে। প্রশমন: আপনার সার্ভে সফটওয়্যারের মধ্যে স্পেকট্রাম অ্যানালাইসিস টুল ব্যবহার করে যানজটপূর্ণ চ্যানেলগুলি সনাক্ত করুন এবং এড়িয়ে চলুন।
- স্টিকি ক্লায়েন্ট: ডিভাইসগুলি কাছাকাছি AP-তে রোম করতে অস্বীকার করছে। প্রশমন: 802.11r/k/v কনফিগারেশন যাচাই করুন এবং নিশ্চিত করুন যে AP ট্রান্সমিট পাওয়ার খুব বেশি সেট করা হয়নি, যা কৃত্রিমভাবে অনুভূত সেল সাইজ বাড়িয়ে দিতে পারে।
ROI এবং ব্যবসায়িক প্রভাব
পেশাদার WiFi সার্ভে সফটওয়্যারের বিনিয়োগের উপর রিটার্ন ঝুঁকি প্রশমন এবং অপারেশনাল দক্ষতার মাধ্যমে পরিমাপ করা হয়।
- মূলধন ব্যয় (CapEx) অপ্টিমাইজেশন: ভবিষ্যদ্বাণীমূলক সার্ভে AP এবং সুইচিং অবকাঠামোর ব্যয়বহুল অতিরিক্ত-প্রভিশনিং প্রতিরোধ করে।
- পরিচালন ব্যয় (OpEx) হ্রাস: একটি সঠিকভাবে সার্ভে করা নেটওয়ার্ক কম সাপোর্ট টিকিট তৈরি করে এবং সমস্যা সমাধানে কম সময় নেয়।
- রাজস্ব সক্ষমতা: খুচরা এবং আতিথেয়তা এর মতো ক্ষেত্রগুলিতে, শক্তিশালী WiFi ডিজিটাল এনগেজমেন্ট কৌশলগুলিকে সমর্থন করে, যা সঠিক WiFi ফুটফল অ্যানালিটিক্স: ভিজিটর ডেটা কীভাবে পরিমাপ করবেন এবং সে অনুযায়ী কাজ করবেন এবং লক্ষ্যযুক্ত বিপণন প্রচারাভিযান সক্ষম করে।
মূল শব্দ ও সংজ্ঞা
RSSI (Received Signal Strength Indicator)
A measurement of the power level being received by the client device's antenna.
Used to determine if a device is close enough to an AP to maintain a stable connection. Measured in negative decibels (dBm).
SNR (Signal-to-Noise Ratio)
The difference between the received wireless signal strength and the background RF noise.
Crucial for determining data throughput. A high SNR means a clean signal capable of supporting high data rates.
Channel Utilisation
The percentage of time a specific WiFi channel is busy transmitting data or handling interference.
High utilisation leads to network congestion and slow speeds, even if the signal strength is excellent.
Co-Channel Interference (CCI)
Interference caused when two or more APs are transmitting on the exact same channel within hearing distance of each other.
Forces APs and clients to wait their turn to transmit, severely degrading network capacity.
Attenuation
The loss of signal strength as RF waves pass through physical obstacles like walls, doors, or human bodies.
Must be accurately modelled in predictive surveys to ensure adequate coverage post-installation.
Sticky Client
A wireless device that remains connected to an AP even when a closer, stronger AP is available.
Often caused by poor roaming configuration or AP transmit power being set too high.
Predictive Survey
A software-based simulation of RF coverage using a floor plan and defined building materials, performed before hardware installation.
Used to estimate the number and placement of APs required for a new deployment.
Active Survey
A site survey where the device connects to the network to measure actual data throughput, latency, and packet loss.
Essential for validating the real-world performance of the network for the end-user.
কেস স্টাডিজ
A 200-room hotel is experiencing frequent dropped WiFi calls when guests walk from the lobby to their rooms. The IT manager suspects a coverage issue, but the dashboard shows all APs are online.
- Conduct an active survey walking the exact path guests take from the lobby to the rooms.
- Monitor the roaming behaviour specifically looking for IEEE 802.11r (Fast BSS Transition) handoffs.
- Analyse the RSSI overlap between the lobby APs and the corridor APs.
- Adjust the transmit power of the lobby APs down slightly to encourage client devices to roam sooner, rather than 'sticking' to the lobby AP until the signal drops completely.
A large retail chain is rolling out a new inventory management system that relies on handheld scanners. They need to ensure seamless coverage across a 50,000 sq ft warehouse with high metal shelving.
- Perform a predictive survey importing the warehouse floor plan and explicitly defining the metal shelving as high-attenuation obstacles.
- Design the AP layout using directional antennas positioned down the aisles, rather than omnidirectional antennas that would bounce signals off the metal racks.
- Post-installation, conduct a passive survey to validate the coverage cell boundaries and ensure a minimum RSSI of -67 dBm in all aisles.
দৃশ্যপট বিশ্লেষণ
Q1. You are reviewing a site survey report for a new corporate office. The RSSI in the main boardroom is excellent (-55 dBm), but the SNR is only 12 dB. What is the likely impact on user experience, and what should be your next troubleshooting step?
💡 ইঙ্গিত:Consider the relationship between signal strength and background noise.
প্রস্তাবিত পদ্ধতি দেখুন
Despite the strong signal, the low SNR (12 dB) indicates a high noise floor, likely due to interference. Users will experience slow speeds, dropped packets, and poor video call quality. The next step is to use a spectrum analyser to identify the source of the interference (e.g., a neighbouring network on the same channel, or non-WiFi devices) and change the AP's channel assignment.
Q2. A stadium deployment requires APs to be mounted 15 metres high in the roof structure. Should you use omnidirectional or directional antennas, and why?
💡 ইঙ্গিত:Think about how RF energy propagates from different antenna types over long distances.
প্রস্তাবিত পদ্ধতি দেখুন
You should use directional antennas. Omnidirectional antennas broadcast energy in all directions (like a lightbulb), which would waste signal propagating upwards and cause massive co-channel interference across the stadium seating. Directional antennas focus the RF energy downwards into specific seating sectors (like a spotlight), increasing signal strength for users and reducing interference between APs.
Q3. During a post-installation active survey in a hospital, you notice that devices are not roaming smoothly between APs in the corridors, leading to dropped VoIP calls for nurses. What specific configuration should you verify on the wireless controller?
💡 ইঙ্গিত:Look for enterprise roaming standards.
প্রস্তাবিত পদ্ধতি দেখুন
You should verify that IEEE 802.11r (Fast BSS Transition), 802.11k (Radio Resource Measurement), and 802.11v (BSS Transition Management) are enabled and supported by the client devices. Additionally, check that the AP transmit power is not set too high, which can create artificially large coverage cells and cause 'sticky clients'.
