Software di Rilevamento WiFi: Come Mappare e Ottimizzare la Tua Rete Wireless
Questa guida fornisce a IT manager e architetti di rete strategie attuabili per l'utilizzo di software di rilevamento WiFi per mappare, ottimizzare e risolvere i problemi delle reti wireless aziendali. Copre i tipi essenziali di rilevamento, le metriche RF critiche, le migliori pratiche di implementazione e l'integrazione dei dati di rilevamento con l'analisi aziendale.
🎧 Ascolta questa guida
Visualizza trascrizione
Riepilogo Esecutivo
Per le strutture moderne, la rete wireless non è più una semplice utility IT; è l'infrastruttura critica che sostiene la soddisfazione degli ospiti, l'efficienza operativa e i flussi di entrate digitali. Che tu stia gestendo un hotel di 200 camere, una proprietà commerciale con 50 filiali o un grande stadio, affidarsi a reti implementate senza una rigorosa convalida è un rischio operativo significativo.
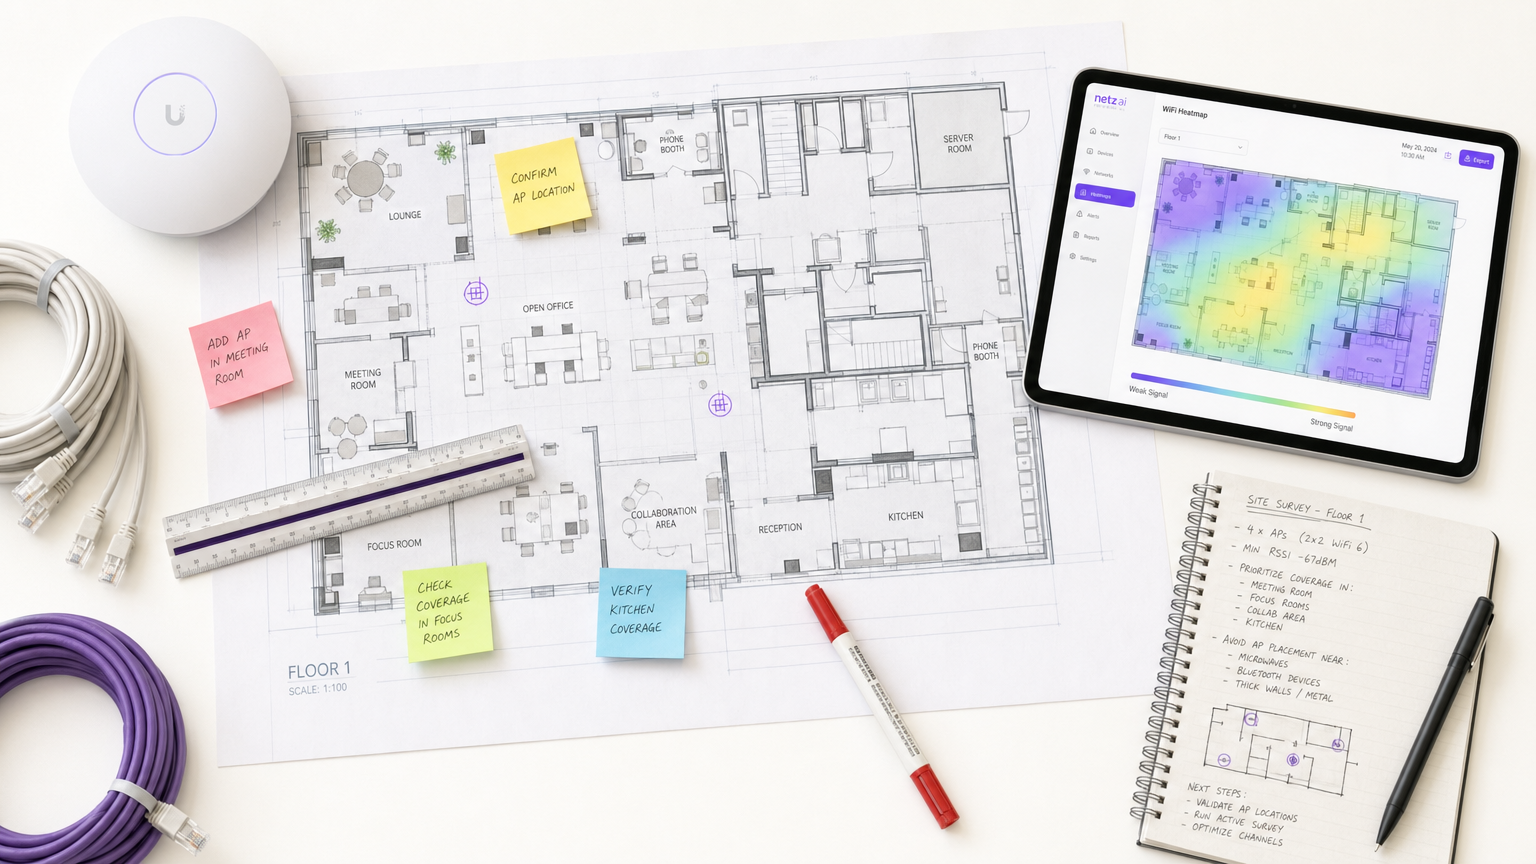
Il software di rilevamento WiFi è lo strumento essenziale per mitigare questo rischio. Permette agli architetti di rete di misurare, mappare e modellare l'ambiente a radiofrequenza (RF), traducendo la propagazione invisibile del segnale in heatmap attuabili. Questa guida delinea i meccanismi fondamentali dei site survey WiFi, dettaglia le metriche critiche richieste per ambienti ad alta densità e fornisce un framework di implementazione vendor-neutral per garantire che la tua infrastruttura wireless offra connettività coerente e ad alte prestazioni.
Approfondimento Tecnico
Il software di site survey WiFi trasforma i dati RF grezzi in heatmap visive, consentendo un'ingegneria di rete precisa. Comprendere i diversi tipi di rilevamento e le metriche che catturano è fondamentale per una progettazione di rete efficace.
Tipi di Rilevamenti WiFi
- Rilevamento Passivo: Il dispositivo di rilevamento ascolta l'ambiente RF senza associarsi a un access point (AP). Cattura i beacon frame, misura il Received Signal Strength Indicator (RSSI) su tutti gli AP visibili e registra i dati rispetto alle coordinate della planimetria. Questo stabilisce la tua baseline e identifica AP non autorizzati o interferenze esterne.
- Rilevamento Attivo: Il dispositivo di rilevamento si connette alla rete per eseguire test di throughput reali (UDP e TCP). Questo misura i tassi di dati effettivi, la perdita di pacchetti e la latenza. I rilevamenti attivi sono irrinunciabili per le strutture che supportano applicazioni in tempo reale come la videoconferenza o le reti di sensori IoT.
- Rilevamento Predittivo (Virtuale): Utilizzando il software, gli ingegneri importano una planimetria, definiscono i materiali da costruzione (es. cemento, vetro) e assegnano i valori di attenuazione. Il software modella la propagazione RF prima che qualsiasi hardware sia installato. Questo è fondamentale per le implementazioni greenfield per prevenire un eccesso o un difetto di provisioning.
Metriche RF Critiche
Per garantire un'implementazione robusta, il tuo rilevamento deve valutare le seguenti metriche:
- RSSI (Received Signal Strength Indicator): Misurato in dBm. Un minimo di -70 dBm è richiesto per la connettività generale, mentre -67 dBm o migliore è necessario per applicazioni vocali e video.
- Signal-to-Noise Ratio (SNR): La differenza tra il livello del segnale e il rumore di fondo. Un SNR minimo di 25 dB è richiesto per un funzionamento affidabile, scalando a 30 dB+ per ambienti ad alta densità.
- Utilizzo del Canale: Misura quanto è occupato un canale radio. Un'elevata potenza del segnale con un elevato utilizzo del canale si traduce in un throughput scarso a causa della contesa del tempo di trasmissione.
- Comportamento di Roaming: Convalida i passaggi puliti tra gli AP utilizzando gli standard aziendali (IEEE 802.11r/k/v). Un roaming scadente è una causa primaria di interruzioni di connessione in ambienti ospedalieri e universitari.
- Co-Channel Interference (CCI): Celle di copertura sovrapposte sullo stesso canale. Il software di rilevamento identifica questi conflitti, consentendo regolazioni del canale e della potenza di trasmissione.
Guida all'Implementazione
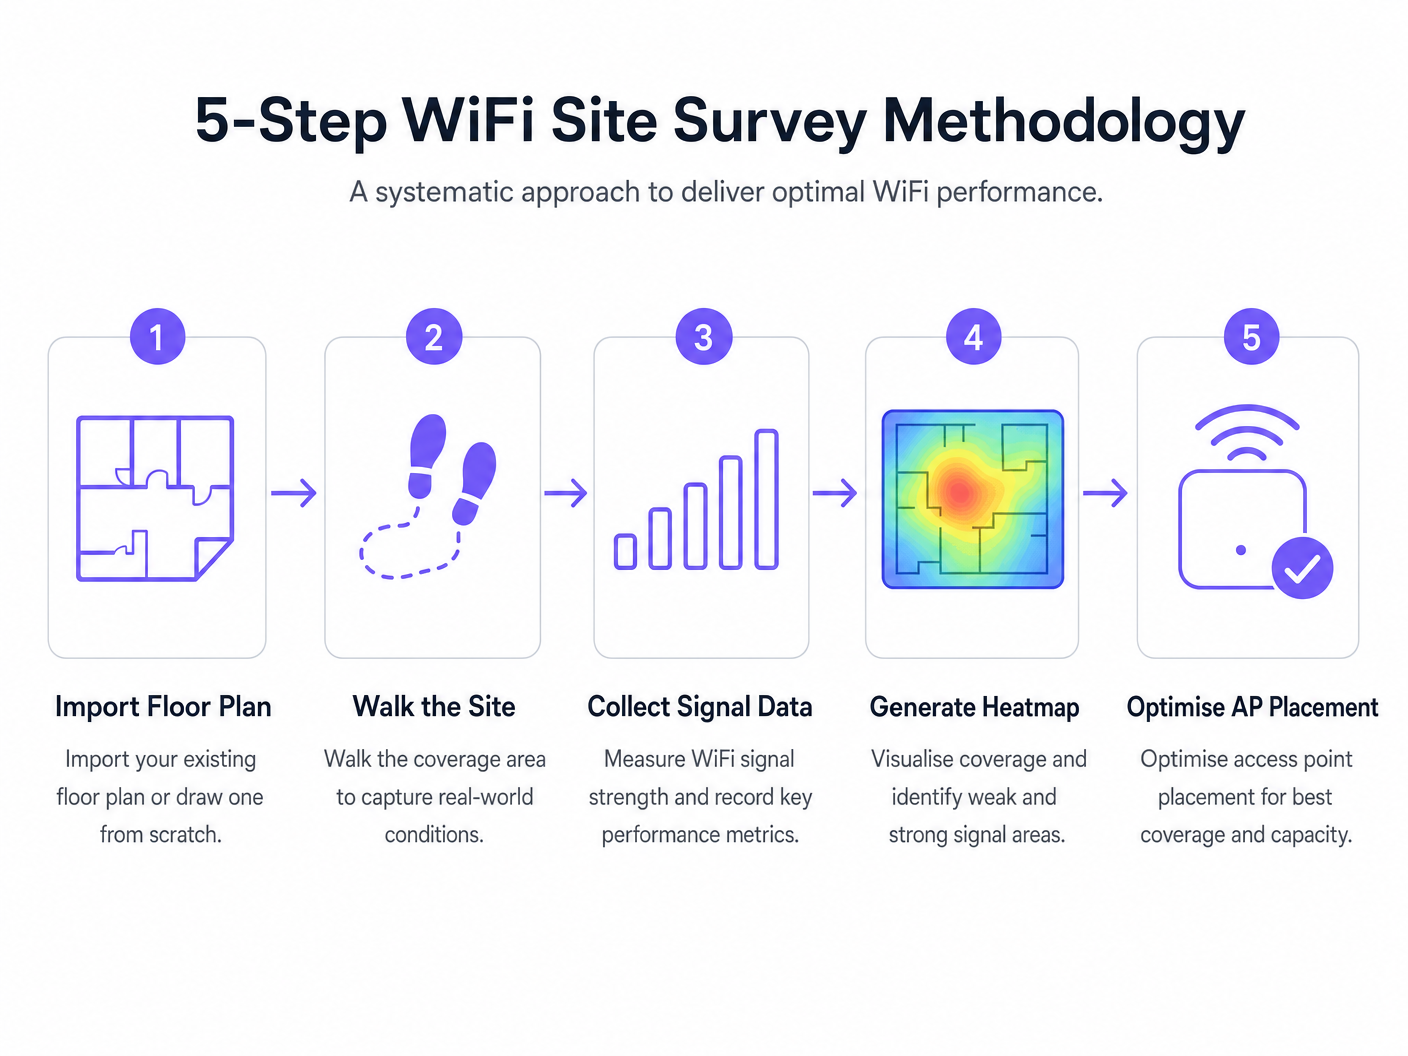
L'implementazione di una rete wireless richiede un approccio sistematico. La seguente metodologia garantisce un posizionamento ottimale degli AP e prestazioni di rete.
- Rilevamento Predittivo Pre-Implementazione: Esegui sempre un rilevamento predittivo prima di acquistare l'hardware. Affidarsi a calcolatori generici dei fornitori spesso non tiene conto delle ombre RF strutturali (es. pilastri di cemento, vani ascensore).
- Convalida con un Rilevamento Attivo a Carico: Una struttura vuota non riflette la realtà operativa. Conduci rilevamenti attivi sotto carico client simulato o effettivo per misurare le prestazioni in scenari ad alta densità.
- Ottimizzazione Iterativa: Dopo l'implementazione iniziale, utilizza rilevamenti attivi e passivi per ottimizzare il posizionamento degli AP, le assegnazioni dei canali e la potenza di trasmissione.
- Integrazione con l'Analisi: Collega i tuoi dati sulle prestazioni RF a piattaforme di business intelligence. Sovrapporre Guest WiFi e WiFi Analytics su una rete ben rilevata ti consente di correlare la qualità del segnale con il tempo di permanenza dei visitatori e il flusso di persone.
Best Practice
- Documenta Tutto: Un rapporto di rilevamento è un documento vivo. Qualsiasi modifica alle posizioni degli AP, ai piani dei canali o alla potenza di trasmissione deve essere documentata e nuovamente rilevata per mantenere una baseline accurata.
- Considera la Banda a 6 GHz: Man mano che le implementazioni si spostano verso WiFi 6E e WiFi 7, le metodologie di rilevamento devono tenere conto dello spettro a 6 GHz, che offre meno interferenze ma maggiore attenuazione (portata più breve).
- Stabilisci una Cadenza di Rilevamento: Tratta i site survey come una pratica operativa continua. Gli ambienti RF cambiano a causa di nuovi inquilini, modifiche strutturali o cambiamenti stagionali di occupazione. Le strutture ad alta densità dovrebbero adottare una cadenza trimestrale, mentre gli uffici standard potrebbero richiedere rilevamenti annuali.
Risoluzione dei Problemi e Mitigazione dei Rischi
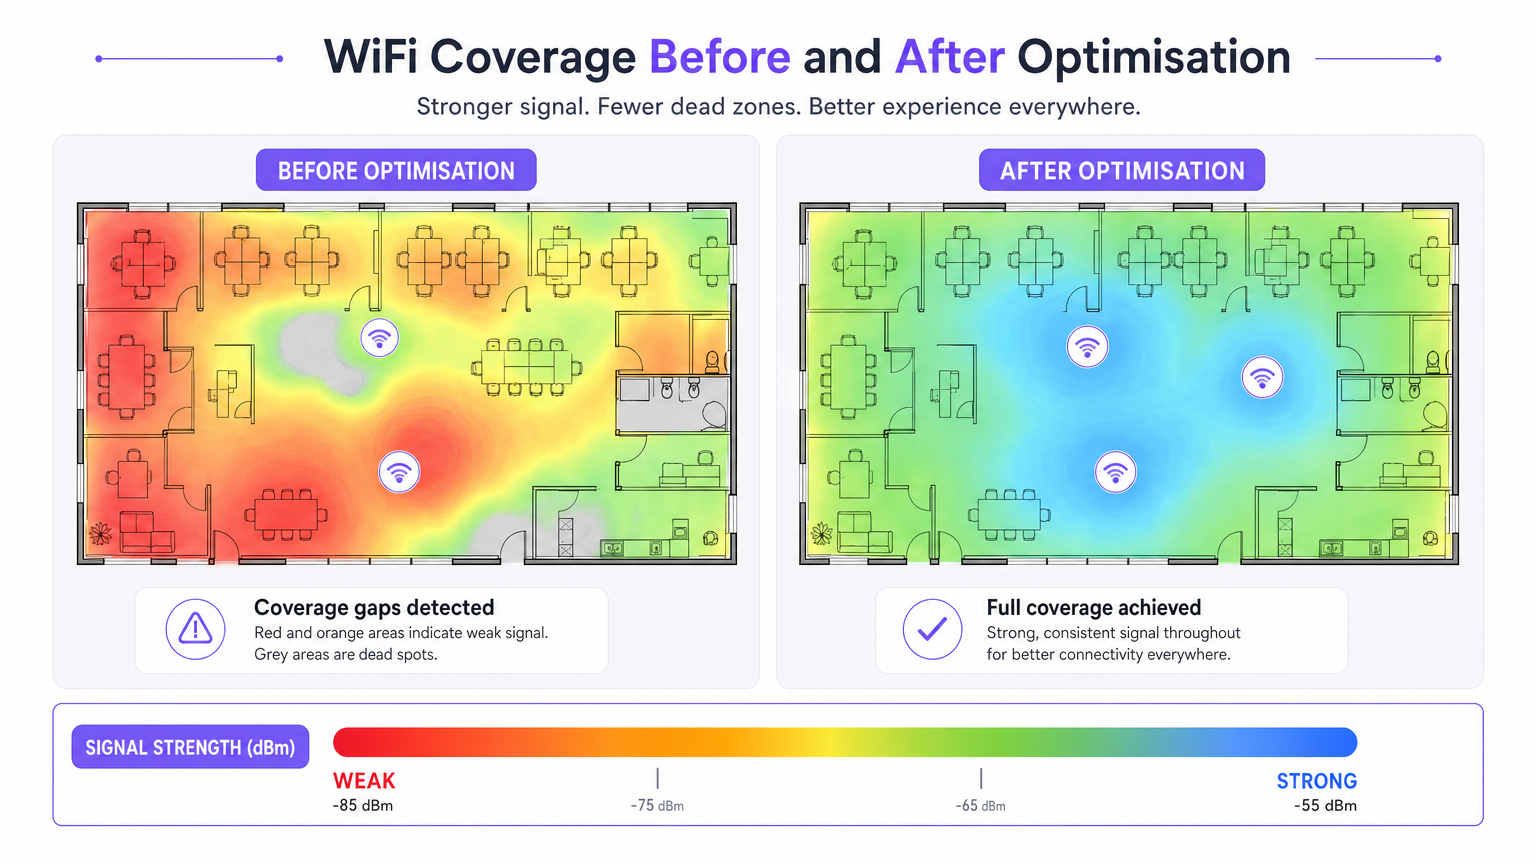
- Lacune di Copertura (Punti Morti): Spesso causate da attenuazione strutturale imprevista. Mitigazione: Affidati a rilevamenti predittivi convalidati tramite sondaggi passivi post-implementazione.
- Elevata Interferenza: Reti vicine o dispositivi non-WiFi (es. microonde, Bluetooth) che aumentano il rumore di fondo. Mitigazione: Utilizzare strumenti di analisi dello spettro all'interno del software di rilevamento per identificare ed evitare canali congestionati.
- Client "Sticky": Dispositivi che si rifiutano di passare a un AP più vicino. Mitigazione: Convalidare la configurazione 802.11r/k/v e assicurarsi che la potenza di trasmissione dell'AP non sia impostata troppo alta, il che può gonfiare artificialmente le dimensioni percepite della cella.
ROI e Impatto sul Business
Il ritorno sull'investimento per il software professionale di rilevamento WiFi si misura nella mitigazione del rischio e nell'efficienza operativa.
- Ottimizzazione delle Spese in Conto Capitale (CapEx): I sondaggi predittivi prevengono il costoso sovradimensionamento degli AP e dell'infrastruttura di switching.
- Riduzione delle Spese Operative (OpEx): Una rete correttamente rilevata genera meno ticket di supporto e richiede meno tempo per la risoluzione dei problemi.
- Abilitazione del Fatturato: In settori come Retail e Hospitality , un WiFi robusto è alla base delle strategie di coinvolgimento digitale, consentendo un'accurata Analisi del Flusso di Visitatori WiFi: Come Misurare e Agire sui Dati dei Visitatori e campagne di marketing mirate.
Termini chiave e definizioni
RSSI (Received Signal Strength Indicator)
A measurement of the power level being received by the client device's antenna.
Used to determine if a device is close enough to an AP to maintain a stable connection. Measured in negative decibels (dBm).
SNR (Signal-to-Noise Ratio)
The difference between the received wireless signal strength and the background RF noise.
Crucial for determining data throughput. A high SNR means a clean signal capable of supporting high data rates.
Channel Utilisation
The percentage of time a specific WiFi channel is busy transmitting data or handling interference.
High utilisation leads to network congestion and slow speeds, even if the signal strength is excellent.
Co-Channel Interference (CCI)
Interference caused when two or more APs are transmitting on the exact same channel within hearing distance of each other.
Forces APs and clients to wait their turn to transmit, severely degrading network capacity.
Attenuation
The loss of signal strength as RF waves pass through physical obstacles like walls, doors, or human bodies.
Must be accurately modelled in predictive surveys to ensure adequate coverage post-installation.
Sticky Client
A wireless device that remains connected to an AP even when a closer, stronger AP is available.
Often caused by poor roaming configuration or AP transmit power being set too high.
Predictive Survey
A software-based simulation of RF coverage using a floor plan and defined building materials, performed before hardware installation.
Used to estimate the number and placement of APs required for a new deployment.
Active Survey
A site survey where the device connects to the network to measure actual data throughput, latency, and packet loss.
Essential for validating the real-world performance of the network for the end-user.
Casi di studio
A 200-room hotel is experiencing frequent dropped WiFi calls when guests walk from the lobby to their rooms. The IT manager suspects a coverage issue, but the dashboard shows all APs are online.
- Conduct an active survey walking the exact path guests take from the lobby to the rooms.
- Monitor the roaming behaviour specifically looking for IEEE 802.11r (Fast BSS Transition) handoffs.
- Analyse the RSSI overlap between the lobby APs and the corridor APs.
- Adjust the transmit power of the lobby APs down slightly to encourage client devices to roam sooner, rather than 'sticking' to the lobby AP until the signal drops completely.
A large retail chain is rolling out a new inventory management system that relies on handheld scanners. They need to ensure seamless coverage across a 50,000 sq ft warehouse with high metal shelving.
- Perform a predictive survey importing the warehouse floor plan and explicitly defining the metal shelving as high-attenuation obstacles.
- Design the AP layout using directional antennas positioned down the aisles, rather than omnidirectional antennas that would bounce signals off the metal racks.
- Post-installation, conduct a passive survey to validate the coverage cell boundaries and ensure a minimum RSSI of -67 dBm in all aisles.
Analisi degli scenari
Q1. You are reviewing a site survey report for a new corporate office. The RSSI in the main boardroom is excellent (-55 dBm), but the SNR is only 12 dB. What is the likely impact on user experience, and what should be your next troubleshooting step?
💡 Suggerimento:Consider the relationship between signal strength and background noise.
Mostra l'approccio consigliato
Despite the strong signal, the low SNR (12 dB) indicates a high noise floor, likely due to interference. Users will experience slow speeds, dropped packets, and poor video call quality. The next step is to use a spectrum analyser to identify the source of the interference (e.g., a neighbouring network on the same channel, or non-WiFi devices) and change the AP's channel assignment.
Q2. A stadium deployment requires APs to be mounted 15 metres high in the roof structure. Should you use omnidirectional or directional antennas, and why?
💡 Suggerimento:Think about how RF energy propagates from different antenna types over long distances.
Mostra l'approccio consigliato
You should use directional antennas. Omnidirectional antennas broadcast energy in all directions (like a lightbulb), which would waste signal propagating upwards and cause massive co-channel interference across the stadium seating. Directional antennas focus the RF energy downwards into specific seating sectors (like a spotlight), increasing signal strength for users and reducing interference between APs.
Q3. During a post-installation active survey in a hospital, you notice that devices are not roaming smoothly between APs in the corridors, leading to dropped VoIP calls for nurses. What specific configuration should you verify on the wireless controller?
💡 Suggerimento:Look for enterprise roaming standards.
Mostra l'approccio consigliato
You should verify that IEEE 802.11r (Fast BSS Transition), 802.11k (Radio Resource Measurement), and 802.11v (BSS Transition Management) are enabled and supported by the client devices. Additionally, check that the AP transmit power is not set too high, which can create artificially large coverage cells and cause 'sticky clients'.
