WiFi ॲनालिटिक्स वापर प्रकरणे: व्यवसाय स्थान डेटाचा वापर कसा करत आहेत
हे मार्गदर्शक IT व्यवस्थापक, नेटवर्क आर्किटेक्ट, CTOs आणि स्थळ संचालन संचालकांना WiFi ॲनालिटिक्सच्या वापर प्रकरणांवर एक व्यावहारिक, अधिकृत संदर्भ प्रदान करते — किरकोळ विक्री, आरोग्यसेवा, आदरातिथ्य आणि कार्यक्रम यांसारख्या क्षेत्रांमधील व्यवसाय सध्याच्या वायरलेस इन्फ्रास्ट्रक्चरमधून स्थान डेटाचा वापर करून कार्यात्मक कार्यक्षमता आणि व्यावसायिक ROI कसे वाढवत आहेत हे यात समाविष्ट आहे. हे मार्गदर्शक स्थानिक बुद्धिमत्ता प्लॅटफॉर्मला आधार देणाऱ्या तांत्रिक आर्किटेक्चरची तपासणी करते, वास्तविक-जगातील उपयोजन परिस्थितींचे वर्णन करते आणि अनुपालन व जोखीम कमी करण्याच्या चौकटींसह विक्रेता-निरपेक्ष अंमलबजावणी मार्गदर्शन प्रदान करते. गेस्ट WiFi सह भौतिक स्थळ चालवणाऱ्या कोणत्याही संस्थेसाठी, हे मार्गदर्शक निष्क्रिय कनेक्टिव्हिटीपासून सक्रिय व्यवसाय बुद्धिमत्तेपर्यंतचा मार्ग दर्शवते.
🎧 हे मार्गदर्शक ऐका
ट्रान्सक्रिप्ट पहा
कार्यकारी सारांश
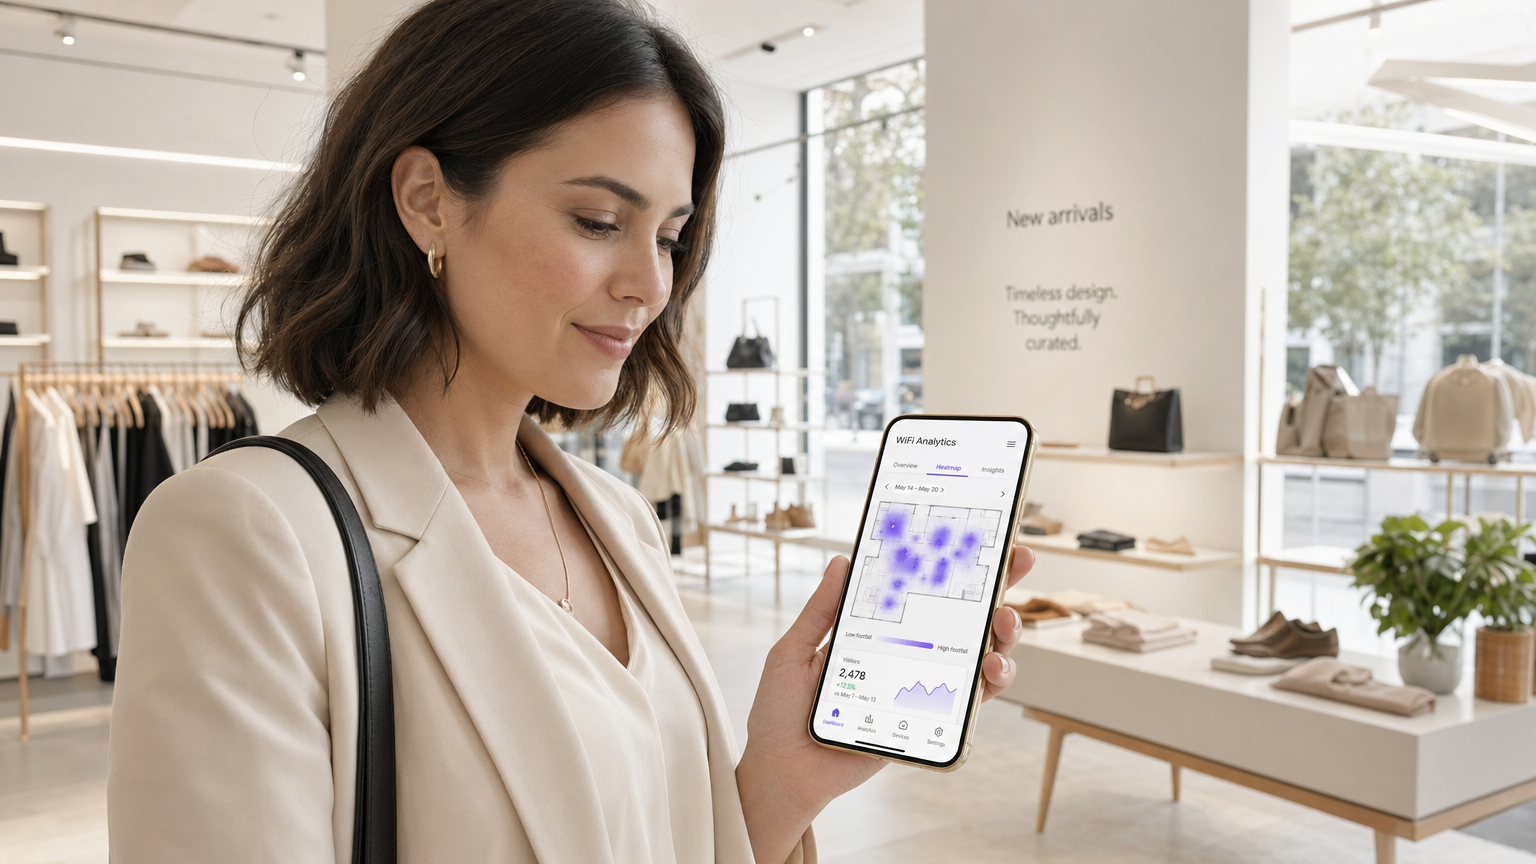
IT नेते आणि स्थळ संचालन संचालकांसाठी, एक मजबूत वायरलेस नेटवर्क तैनात करणे म्हणजे केवळ इंटरनेट प्रवेश प्रदान करणे नव्हे — तर स्थानिक बुद्धिमत्तेमध्ये ही एक धोरणात्मक गुंतवणूक आहे. हे मार्गदर्शक एंटरप्राइझ वातावरणातील व्यावहारिक WiFi ॲनालिटिक्स वापर प्रकरणे शोधते, ज्यात संस्था स्थान डेटाचा वापर करून ऑपरेशन्स कसे ऑप्टिमाइझ करतात, ग्राहकांचे अनुभव कसे वाढवतात आणि मोजता येण्याजोगा ROI कसा वाढवतात हे सविस्तरपणे सांगितले आहे. मानक ॲक्सेस पॉइंट्सना एका सर्वसमावेशक Guest WiFi आणि WiFi Analytics इंजिनमध्ये रूपांतरित करून, व्यवसाय डिव्हाइस प्रोब विनंत्या आणि असोसिएशन डेटामधून कृतीयोग्य अंतर्दृष्टी काढू शकतात. किरकोळ विक्रीतील फूटफॉल मॅपिंगपासून ते आरोग्य सेवा सुविधांमधील रांग व्यवस्थापनापर्यंत, आम्ही कनेक्टिव्हिटीला व्यावसायिक फायद्यात रूपांतरित करण्यासाठी आवश्यक असलेले तांत्रिक आर्किटेक्चर, उपयोजन धोरणे आणि जोखीम कमी करण्याचे प्रोटोकॉल तपासतो. तंत्रज्ञानाच्या मूलभूत विहंगावलोकनासाठी, WiFi ॲनालिटिक्स म्हणजे काय? एक संपूर्ण मार्गदर्शक पहा.
तांत्रिक सखोल अभ्यास
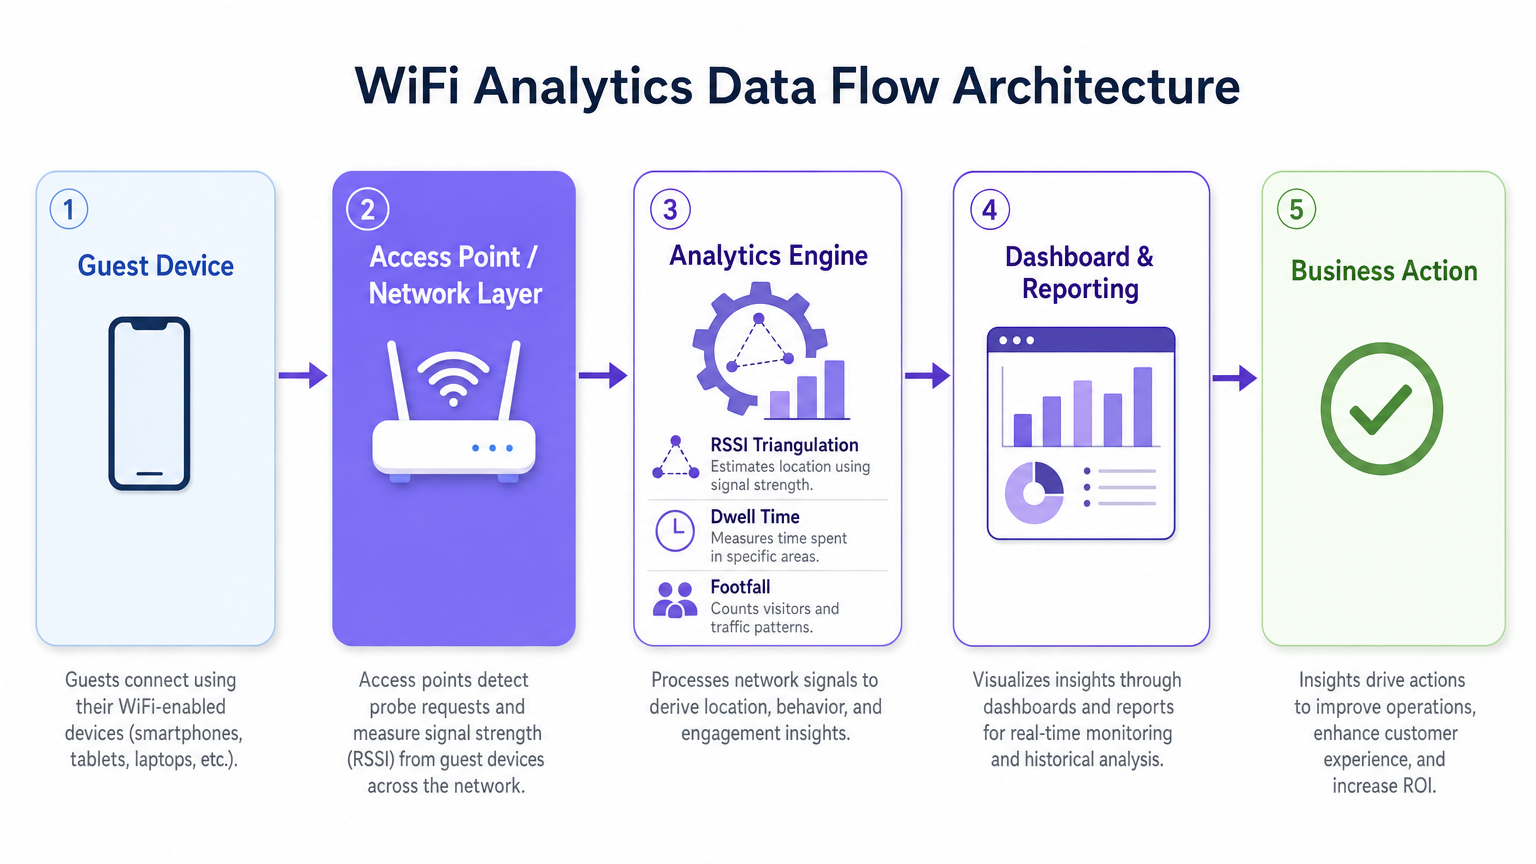
WiFi Analytics प्लॅटफॉर्मच्या कार्यप्रणाली समजून घेण्यासाठी क्लायंट डिव्हाइसपासून ॲनालिटिक्स इंजिनपर्यंतच्या डेटा प्रवाहाची तपासणी करणे आवश्यक आहे. आधुनिक ॲक्सेस पॉइंट्स (APs) ज्ञात नेटवर्क शोधणाऱ्या स्मार्टफोनद्वारे प्रसारित केलेल्या असंबंधित प्रोब विनंत्या शोधतात. अनेक APs वर Received Signal Strength Indicator (RSSI) मूल्यांचे एकत्रीकरण करून, प्रणाली डिव्हाइसच्या स्थानांची अचूकता निश्चित करते, जी उपयोजन घनता आणि पर्यावरणीय RF परिस्थितीनुसार बदलते.
जेव्हा एखादा वापरकर्ता Captive Portal द्वारे सक्रियपणे कनेक्ट होतो, तेव्हा ॲनालिटिक्स इंजिन MAC ॲड्रेसला प्रमाणित वापरकर्ता प्रोफाइलशी जोडते. अनामिक उपस्थिती ॲनालिटिक्समधून प्रमाणित लोकसंख्याशास्त्रीय डेटामध्ये हे संक्रमण एंटरप्राइझ स्थानिक बुद्धिमत्तेचा आधार आहे. Purple च्या Guest WiFi सोल्यूशनसारखे प्लॅटफॉर्म विशेषतः मोठ्या प्रमाणावर हे संक्रमण सुलभ करण्यासाठी तयार केले आहेत, जे Captive Portal व्यवस्थापन, संमती संकलन आणि ॲनालिटिक्स एकाच उपयोजनात समाकलित करतात.
डेटा संकलन यंत्रणा
WiFi ॲनालिटिक्स उपयोजनातील डेटा संकलनाच्या तीन प्राथमिक यंत्रणा म्हणजे उपस्थिती ॲनालिटिक्स, स्थान ॲनालिटिक्स आणि प्रमाणित ॲनालिटिक्स. उपस्थिती ॲनालिटिक्स हॅश केलेल्या MAC ॲड्रेसवर आधारित फूटफॉल मोजण्यासाठी, थांबण्याचा वेळ मोजण्यासाठी आणि परत येणाऱ्या अभ्यागतांना ओळखण्यासाठी असंबंधित प्रोब विनंत्या वापरते, ज्यामुळे सक्रिय कनेक्शनची आवश्यकता नसताना स्थळाच्या रहदारीची विस्तृत दृश्यमानता मिळते. स्थान ॲनालिटिक्स फ्लोअर प्लॅनवर डिव्हाइसची हालचाल मॅप करण्यासाठी ट्रायलेटरेशन अल्गोरिदम वापरते; प्रगत उपयोजनांमध्ये Indoor Positioning System: UWB, BLE, & WiFi Guide मध्ये तपशीलवार पूरक पोझिशनिंग तंत्रज्ञान समाकलित केले जाऊ शकते, ज्यामुळे मानक WiFi क्षमतेपलीकडे अचूकता वाढते. प्रमाणित ॲनालिटिक्स वापरकर्ते Captive Portal द्वारे प्रमाणीकरण करतात तेव्हा लोकसंख्याशास्त्रीय आणि वर्तणूक डेटा कॅप्चर करते, CRM प्रणाली आणि लॉयल्टी प्रोग्राम्ससह एकत्रित होऊन सर्वसमावेशक, दीर्घकालीन वापरकर्ता प्रोफाइल तयार करते.
एक महत्त्वाचा तांत्रिक विचार म्हणजे MAC ॲड्रेस रँडमायझेशन. आधुनिक iOS आणि Android ऑपरेटिंग सिस्टिम वापरकर्त्याच्या गोपनीयतेचे संरक्षण करण्यासाठी डिव्हाइस MAC ॲड्रेस रँडमाइज करतात, याचा अर्थ असा की केवळ असंबंधित प्रोब विनंत्यांवर आधारित उपस्थिती ॲनालिटिक्स दीर्घ कालावधीत अद्वितीय अभ्यागतांची संख्या जास्त मोजेल. जोखीम कमी करण्याची रणनीती म्हणजे सक्रिय प्रमाणीकरणास प्रोत्साहन देणे — आकर्षक Captive Portal ऑफर्स, अखंड सोशल लॉगिन किंवा OpenRoaming एकत्रीकरणाद्वारे — जेणेकरून ॲनालिटिक्स इंजिन क्षणिक रँडमाइज्ड MACs ऐवजी प्रमाणित सत्रांचा मागोवा घेईल. हे तुमच्या पोर्टल अनुभवाची गुणवत्ता थेट तुमच्या ॲनालिटिक्स डेटाच्या गुणवत्तेशी जोडते.
आर्किटेक्चर आणि मानके
उत्पादन-श्रेणी WiFi ॲनालिटिक्स उपयोजन पाच-स्तरीय आर्किटेक्चरचे अनुसरण करते: क्लायंट डिव्हाइस लेयर, ॲक्सेस पॉइंट आणि नेटवर्क लेयर (उच्च-घनता वातावरणासाठी IEEE 802.11ax / Wi-Fi 6 ला समर्थन देणारे), RSSI ट्रायंगुलेशन आणि थांबण्याच्या वेळेची गणना करणारे ॲनालिटिक्स इंजिन, डॅशबोर्ड आणि रिपोर्टिंग लेयर, आणि व्यवसाय कृती लेयर जिथे अंतर्दृष्टी कार्यात्मक निर्णयांना चालना देते. उच्च-घनता स्थळांसाठी — स्टेडियम, कॉन्फरन्स सेंटर्स, मोठे किरकोळ विक्रीचे मजले — Wi-Fi 6 हे किमान शिफारस केलेले मानक आहे, जे थ्रुपुट कमी न करता समवर्ती कनेक्शन व्यवस्थापित करण्यासाठी OFDMA आणि BSS Colouring सादर करते.
GDPR, CCPA आणि PCI DSS (जिथे पेमेंट डेटा नेटवर्क इन्फ्रास्ट्रक्चरशी संबंधित आहे) चे पालन करणे अनिवार्य आहे. MAC ॲड्रेस हॅशिंग, Captive Portal वर स्पष्ट संमती कॅप्चर करणे, डेटा कमी करणे आणि परिभाषित डेटा धारणा धोरणे ही वैयक्तिक डेटा हाताळणाऱ्या कोणत्याही उपयोजनासाठी मूलभूत आवश्यकता आहेत.
अंमलबजावणी मार्गदर्शक
WiFi ॲनालिटिक्स सोल्यूशन यशस्वीरित्या तैनात करण्यासाठी नेटवर्क डिझाइन, हार्डवेअर निवड आणि सॉफ्टवेअर कॉन्फिगरेशनसाठी एक संरचित दृष्टिकोन आवश्यक आहे.
टप्पा 1 — नेटवर्क मूल्यांकन आणि साइट सर्वेक्षण. सध्याचे कव्हरेज तपासण्यासाठी, हस्तक्षेपाचे स्रोत ओळखण्यासाठी आणि इष्टतम AP प्लेसमेंट निश्चित करण्यासाठी एक सर्वसमावेशक RF साइट सर्वेक्षण करा. स्थान ॲनालिटिक्सच्या अचूकतेसाठी, तुम्हाला एकाच वेळी कोणतेही दिलेले डिव्हाइस शोधणारे किमान तीन APs आवश्यक आहेत. व्यवहारात, याचा अर्थ खुल्या जागेत APs चे अंदाजे 15–20 मीटर अंतर-परियोजना वातावरणे, किरकोळ विक्रीचे चेकआउट क्षेत्रे किंवा रुग्णालयातील प्रतीक्षा कक्ष यांसारख्या उच्च-मूल्याच्या क्षेत्रांमध्ये अधिक घनतेने स्थानांकन करून.
टप्पा 2 — Captive Portal डिझाइन आणि प्रमाणीकरण धोरण. एक Captive Portal डिझाइन करा जे डेटा संपादन वाढवताना अडथळे कमी करते. प्रोग्रेसिव्ह प्रोफाइलिंग लागू करा — पहिल्या कनेक्शनवर किमान डेटा संच (ईमेल पत्ता आणि संमती) गोळा करा आणि त्यानंतरच्या भेटींमध्ये प्रोफाइल समृद्ध करा. अनेक प्रमाणीकरण पद्धतींना समर्थन द्या: सोशल लॉगिन (Google, Facebook), ईमेल नोंदणी आणि अखंड रोमिंग वापरकर्त्यांसाठी OpenRoaming. पोर्टल मोबाइल-अनुकूलित असल्याची खात्री करा आणि 4G कनेक्शनवर तीन सेकंदांच्या आत लोड होते.
टप्पा 3 — ॲनालिटिक्स प्लॅटफॉर्म एकत्रीकरण. ॲनालिटिक्स प्लॅटफॉर्मला सध्याच्या व्यवसाय बुद्धिमत्ता साधने, CRM प्रणाली आणि मार्केटिंग ऑटोमेशन प्लॅटफॉर्मसह एकत्रित करा. Purple चे WiFi Analytics प्लॅटफॉर्म प्रमुख CRM आणि मार्केटिंग प्लॅटफॉर्मसह पूर्व-निर्मित एकत्रीकरण प्रदान करते, ज्यामुळे क्रॉस-फंक्शनल टीम्सना विशेष विकासाची आवश्यकता नसताना स्थानिक अंतर्दृष्टीवर कार्य करता येते. प्रयोजनापूर्वी तुमचे प्रमुख कार्यप्रदर्शन निर्देशक (KPIs) परिभाषित करा — पादचारी संख्या, थांबण्याचा वेळ, परत भेट देण्याचे दर, झोन-स्तरीय हीट मॅप्स — आणि त्यानुसार डॅशबोर्ड कॉन्फिगर करा.
टप्पा 4 — अनुपालन आणि डेटा प्रशासन. प्रयोजनापूर्वी डेटा संरक्षण प्रभाव मूल्यांकन (DPIA) लागू करा. गोपनीयता सूचना अचूक असल्याची, संमती यंत्रणा स्पष्ट आणि सखोल असल्याची आणि डेटा धारणा धोरणे प्लॅटफॉर्म स्तरावर लागू केली असल्याची खात्री करा. सततच्या अनुपालन निरीक्षणासाठी जबाबदार डेटा मालकाची नियुक्ती करा.
सर्वोत्तम पद्धती
WiFi ॲनालिटिक्स गुंतवणुकीचे मूल्य वाढवण्यासाठी, खालील उद्योग-मानक शिफारसींचे पालन करा.
केवळ कव्हरेजसाठी नव्हे, तर स्थान ॲनालिटिक्ससाठी AP घनता विशेषतः ऑप्टिमाइझ करा. मूलभूत इंटरनेट ॲक्सेससाठी डिझाइन केलेल्या नेटवर्कमध्ये विश्वसनीय ट्रायलेटरेशनसाठी सहसा अपुरा AP ओव्हरलॅप असतो. स्थान-ॲनालिटिक्स-विशिष्ट स्वतंत्र सर्वेक्षण करा आणि AP स्थानांकन समायोजित करा किंवा उच्च-मूल्याच्या क्षेत्रांमध्ये पूरक APs जोडा.
आकर्षक Captive Portal डिझाइनद्वारे MAC रँडमायझेशन कमी करणे लागू करा. कनेक्शन दर — प्रमाणीकरण करणाऱ्या शोधलेल्या उपकरणांचे प्रमाण — ॲनालिटिक्स डेटा गुणवत्तेसाठी सर्वात महत्त्वाचे मेट्रिक आहे. स्पष्ट मूल्य प्रस्ताव (मोफत WiFi, लॉयल्टी पॉइंट्स, विशेष सामग्री) असलेले सु-डिझाइन केलेले पोर्टल किरकोळ आणि आदरातिथ्य वातावरणात सातत्याने 40-60% कनेक्शन दर प्राप्त करते.
स्थान अल्गोरिदम नियमितपणे कॅलिब्रेट करा. पर्यावरणीय बदल — नवीन भौतिक रचना, हंगामी उत्पादन प्रदर्शन, गर्दीची बदलती घनता — RF प्रसारणावर परिणाम करतात आणि कालांतराने स्थानाची अचूकता कमी करू शकतात. त्रैमासिक कॅलिब्रेशन पुनरावलोकने शेड्यूल करा आणि स्थळातील कोणत्याही महत्त्वपूर्ण भौतिक बदलांनंतर पुन्हा कॅलिब्रेट करा.
WiFi ॲनालिटिक्स डेटा इतर ऑपरेशनल डेटा स्रोतांसह एकत्रित करा. जेव्हा पॉइंट-ऑफ-सेल डेटा, कर्मचारी वेळापत्रक आणि मार्केटिंग मोहिमेच्या टाइमलाइनशी संबंधित असतात, तेव्हा अंतर्दृष्टी लक्षणीयरीत्या अधिक शक्तिशाली बनते. हे क्रॉस-फंक्शनल एकत्रीकरण आहे जिथे वरिष्ठ भागधारकांसाठी ROI प्रकरण आकर्षक बनते.
ऑटोमोटिव्ह किंवा वाहतूक वातावरणात तैनात करणाऱ्या संस्थांसाठी, Wi-Fi in Auto: The Complete 2026 Enterprise Guide आणि Internet of Things Architecture: A Complete Guide पारंपरिक स्थळांच्या पलीकडे WiFi ॲनालिटिक्सचा विस्तार करण्यासाठी संबंधित आर्किटेक्चरल संदर्भ प्रदान करतात.
समस्यानिवारण आणि जोखीम कमी करणे
एंटरप्राइझ प्रयोजनांमध्ये सामान्यतः तीन क्षेत्रांमध्ये आव्हाने येतात: डेटा अचूकता, वापरकर्ता स्वीकार्यता आणि अनुपालन.
अचूक नसलेला स्थान डेटा सामान्यतः अपुऱ्या AP घनतेमुळे, शेजारच्या नेटवर्कमधून किंवा भौतिक अडथळ्यांमुळे होणाऱ्या महत्त्वपूर्ण RF हस्तक्षेपांमुळे किंवा MAC रँडमायझेशनचा विचार न केल्यामुळे होतो. नियंत्रित चाचणी कालावधीत अपेक्षित पादचारी संख्या मॅन्युअल निरीक्षण संख्यांशी तुलना करून निदान करा. जर विचलन 20% पेक्षा जास्त असेल, तर नवीन साइट सर्वेक्षण करा आणि AP स्थानाचे पुनरावलोकन करा.
कमी प्रमाणीकरण दर अतिशय क्लिष्ट, खूप मंद किंवा पुरेसे आकर्षक नसलेल्या Captive Portal अनुभवाचे संकेत देतात. पोर्टल लोड वेळ, प्रमाणीकरणासाठी आवश्यक असलेल्या पायऱ्यांची संख्या आणि मूल्य प्रस्तावाची स्पष्टता तपासा. सर्वाधिक रूपांतरित होणारे कॉन्फिगरेशन ओळखण्यासाठी विविध पोर्टल डिझाइन आणि ऑफरची A/B चाचणी करा.
डेटा गोपनीयतेचे उल्लंघन सर्वात महत्त्वपूर्ण धोका दर्शवतात, ज्यात GDPR दंड जागतिक वार्षिक उलाढालीच्या 4% पर्यंत पोहोचू शकतो. सुरुवातीपासूनच कठोर अनुपालन कार्यक्रम लागू करून धोका कमी करा: स्पष्ट संमती संपादन, अचूक गोपनीयता सूचना, डेटा कमी करणे, उपस्थिती ॲनालिटिक्स डेटाचे अनामीकरण आणि नियमित अनुपालन ऑडिट. तुमचा ॲनालिटिक्स प्लॅटफॉर्म विक्रेता डेटा प्रोसेसिंग करार (DPA) प्रदान करतो आणि ISO 27001 किंवा समतुल्य प्रमाणित आहे याची खात्री करा.
ROI आणि व्यवसाय परिणाम
सामान्य डेटा संकलनाऐवजी विशिष्ट ऑपरेशनल परिणामांवर आधारित असताना WiFi ॲनालिटिक्ससाठी व्यवसाय प्रकरण सर्वात मजबूत असते. खालील बेंचमार्क Purple च्या ग्राहक आधारावरील सामान्य एंटरप्राइझ प्रयोजनांवर आधारित आहेत.
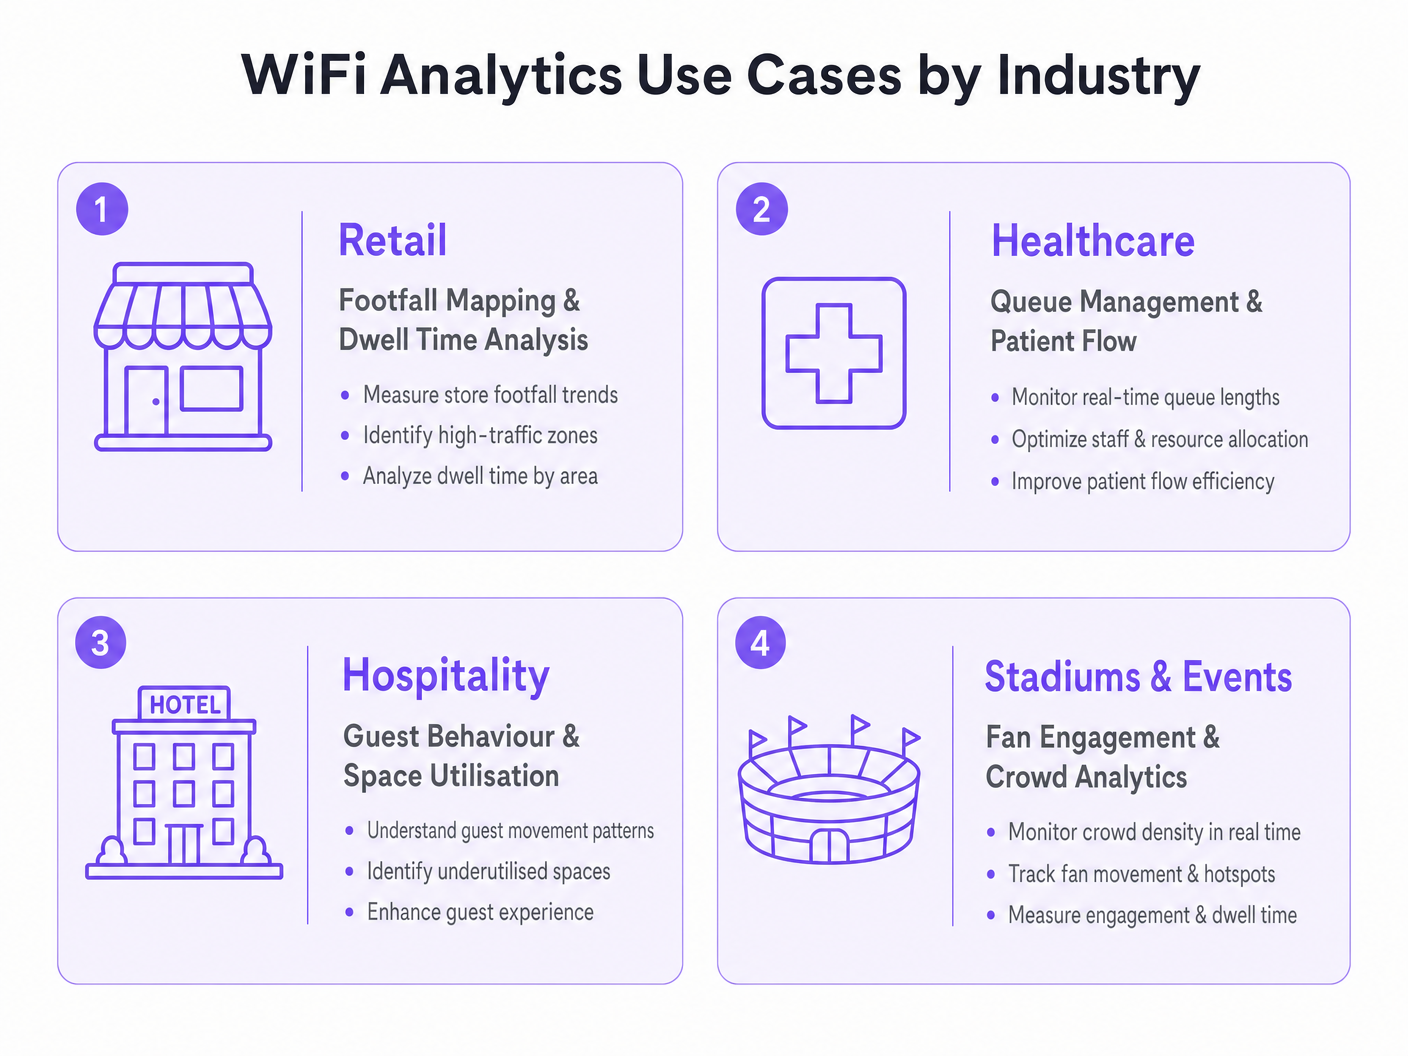
| क्षेत्र | प्राथमिक वापर प्रकरण | सामान्य परिणाम |
|---|---|---|
| किरकोळ विक्री | पादचारी मॅपिंग आणि झोन ऑप्टिमायझेशन | सरासरी व्यवहार मूल्यात 8–15% वाढ |
| आरोग्यसेवा | रांग व्यवस्थापन आणि रुग्ण प्रवाह | सरासरी प्रतीक्षा वेळेत 20–30% घट |
| आदरातिथ्य | अतिथी वर्तन आणि जागेचा वापर | प्रति अतिथी F&B महसुलात 12–18% सुधारणा |
| वाहतूक | प्रवासी प्रवाह आणि सवलत ऑप्टिमायझेशन | किरकोळ सवलत महसुलात 10–20% वाढ |
प्रयोजनापूर्वीच्या साइट सर्वेक्षणादरम्यान स्थापित केलेल्या परिभाषित बेसलाइनच्या विरुद्ध यश मोजा. तुमचे प्रमुख मेट्रिक्स — पादचारी, थांबण्याचा वेळ, परत भेट देण्याचे दर, प्रमाणीकृत कनेक्शन दर — प्रयोजनानंतरच्या पहिल्या तिमाहीसाठी साप्ताहिक आधारावर, आणि त्यानंतर मासिक आधारावर ट्रॅक करा. वरिष्ठ भागधारकांसाठी ROI कथा तयार करण्यासाठी आणि पुढील गुंतवणुकीचे समर्थन करण्यासाठी ॲनालिटिक्स डेटाला आर्थिक कार्यप्रदर्शन मेट्रिक्सशी संबंधित करा.प्लॅटफॉर्ममधील गुंतवणूक.
चांगल्या प्रकारे अंमलात आणलेल्या WiFi ॲनालिटिक्स उपयोजनासाठी गुंतवणुकीचा परतावा कालावधी साधारणपणे 12 ते 18 महिन्यांपर्यंत असतो, ज्यात सततच्या कार्यात्मक ऑप्टिमायझेशनद्वारे आणि मार्केटिंग व लॉयल्टी कार्यक्रमांसाठी समृद्ध फर्स्ट-पार्टी डेटाद्वारे सततच्या वार्षिक मूल्य वितरणाचा समावेश असतो.
महत्त्वाच्या संज्ञा आणि व्याख्या
RSSI (Received Signal Strength Indicator)
A measurement of the power level of a received radio signal, expressed in decibels relative to one milliwatt (dBm). In WiFi analytics, RSSI values from multiple access points are used to triangulate the approximate location of a client device.
IT teams encounter RSSI when configuring location analytics engines and when troubleshooting inaccurate positioning data. A higher RSSI (closer to 0 dBm) indicates a stronger signal and more reliable location data.
Probe Request
A management frame broadcast by a WiFi-enabled device to discover available networks. Probe requests are transmitted even when the device is not connected to any network, making them the basis for passive presence analytics.
The foundation of anonymous footfall counting. IT teams should understand that modern devices randomise the MAC address in probe requests, which affects the accuracy of unique visitor counts in presence analytics deployments.
MAC Address Randomisation
A privacy feature implemented in modern mobile operating systems (iOS 14+, Android 10+) that causes devices to use randomised MAC addresses in probe requests and, in some configurations, when connecting to networks. This prevents persistent tracking of devices across time and locations.
The primary technical challenge for WiFi analytics deployments relying on passive presence data. Mitigation requires incentivising active authentication through the captive portal, where the authenticated session provides a stable identifier.
Captive Portal
A web page presented to users when they connect to a public or guest WiFi network, requiring authentication or acceptance of terms before granting internet access. In WiFi analytics deployments, the captive portal is the primary mechanism for collecting authenticated user data and consent.
The design and performance of the captive portal directly determines the authentication rate, which is the key driver of analytics data quality. IT teams should treat captive portal optimisation as a continuous improvement activity.
Trilateration
A geometric technique for determining the position of a point by measuring its distance from three or more known reference points. In WiFi analytics, trilateration uses RSSI values from multiple access points to estimate device location on a floor plan.
The core algorithm behind WiFi-based indoor positioning. IT teams should understand that trilateration accuracy degrades with fewer than three reference APs, with significant RF interference, or in environments with complex physical layouts.
Dwell Time
The duration a device (and by proxy, a person) remains within a defined zone or venue. Dwell time is a key metric in WiFi analytics, used to measure customer engagement with specific areas of a retail store, waiting times in healthcare settings, or fan engagement in stadium concourse areas.
One of the most commercially actionable metrics in WiFi analytics. High dwell time in a retail zone correlates with purchase intent; low dwell time in a hospitality venue may indicate a poor customer experience. Used alongside footfall data to calculate zone efficiency.
Presence Analytics
The analysis of WiFi probe request data to determine the number of devices (and by proxy, people) present in a venue or zone, without requiring active network connection. Provides passive footfall counting and dwell time measurement.
The entry-level capability of most WiFi analytics platforms. Useful for broad traffic trend analysis but subject to distortion from MAC randomisation. IT teams should use presence analytics for directional insights and authenticated analytics for precise, demographically segmented data.
OpenRoaming
A Wireless Broadband Alliance (WBA) standard that enables seamless, automatic WiFi authentication across participating networks using identity credentials from trusted providers (mobile operators, social identity providers). Eliminates the need for manual captive portal interaction for participating users.
Increasingly relevant for enterprise deployments seeking to maximise authenticated connection rates without increasing portal friction. Purple supports OpenRoaming as an authentication method, enabling venues to capture analytics data from roaming users who would otherwise bypass the captive portal.
Heat Map
A data visualisation technique that uses colour gradients to represent the density or intensity of a variable across a geographic area. In WiFi analytics, heat maps display footfall density or dwell time intensity across a venue floor plan, enabling rapid identification of high-traffic and low-traffic zones.
The most commonly used visualisation in WiFi analytics dashboards. IT teams and operations directors use heat maps to communicate spatial insights to non-technical stakeholders and to inform decisions about store layout, staffing allocation, and facility management.
केस स्टडीज
A UK fashion retailer with 12 stores notices that conversion rates are declining despite stable footfall. Store managers report that customers seem to browse the front of the store but rarely reach the back sections where higher-margin products are displayed. How should the IT and operations teams deploy WiFi analytics to diagnose and address this problem?
Deploy Purple's WiFi Analytics platform across all 12 stores, ensuring sufficient AP density (minimum 3 APs per zone) to support zone-level location tracking. Configure floor plan maps for each store within the analytics platform, defining zones that correspond to product categories and store sections. Run a 4-week baseline data collection period to establish footfall heat maps, dwell times by zone, and customer journey paths. Analyse the data to identify the specific point in the store layout where customer flow drops off. Cross-reference with point-of-sale data to identify which zones correlate with higher transaction values. Use the insights to inform a store layout redesign — repositioning high-margin categories into high-traffic zones identified by the heat maps. Implement a captive portal offering a loyalty discount to incentivise authentication, enabling demographic segmentation of the analytics data. Re-measure after the layout change to quantify the uplift.
An NHS trust is experiencing patient satisfaction issues related to waiting times in its outpatient departments. The operations director wants to use WiFi analytics to gain real-time visibility into patient flow and queue lengths. What are the technical and compliance considerations for this deployment?
Deploy WiFi analytics across the outpatient department, mapping waiting areas, consultation rooms, and corridors as distinct zones. Configure real-time alerting within the analytics platform to trigger notifications to the operations team when queue lengths in specific waiting areas exceed defined thresholds (e.g., more than 15 devices detected in a waiting zone for more than 30 minutes). Integrate the analytics platform with the existing patient management system via API to correlate WiFi presence data with appointment schedules. For compliance, conduct a DPIA before deployment, as patient location data in a healthcare setting is particularly sensitive. Implement strict data anonymisation — ensure that WiFi analytics data cannot be linked back to individual patient records. Use presence analytics (unassociated probe requests) for queue monitoring rather than authenticated analytics, minimising the personal data collected. Provide clear signage in waiting areas informing patients that WiFi analytics are in use for service improvement purposes.
परिस्थिती विश्लेषण
Q1. A 500-bed hospital trust wants to deploy WiFi analytics to monitor patient flow through its A&E department. The CISO raises concerns about GDPR compliance, specifically whether location tracking of patients constitutes processing of sensitive personal data. How do you structure the deployment to achieve the operational objective while satisfying the compliance requirement?
💡 संकेत:Consider whether the operational objective (queue monitoring) requires authenticated personal data, or whether anonymous presence analytics would be sufficient. Think about the distinction between presence analytics and authenticated analytics in the context of GDPR's data minimisation principle.
शिफारस केलेला दृष्टिकोन दाखवा
Structure the deployment using presence analytics only for queue monitoring — unassociated probe request data provides sufficient signal for counting devices in waiting zones and measuring dwell times without requiring authentication or the collection of personal data. Implement strict data anonymisation: hash all MAC addresses before storage, apply a rolling anonymisation window of no more than 24 hours, and ensure the analytics platform cannot link WiFi data to patient records. Provide clear signage in the A&E department informing visitors that anonymous WiFi analytics are in use for service improvement. Conduct a DPIA documenting the data minimisation approach and the technical controls in place. This approach achieves the operational objective — real-time queue visibility and dwell time monitoring — while processing no personal data, thereby avoiding the GDPR compliance risk entirely.
Q2. A retail chain deploys WiFi analytics across 20 stores and finds that the footfall counts from the analytics platform are consistently 40% higher than manual door counter readings. What are the most likely causes and how do you diagnose and resolve the discrepancy?
💡 संकेत:Think about the sources of overcounting in presence analytics. Consider the impact of MAC randomisation, the behaviour of devices in adjacent areas (car parks, neighbouring stores), and the configuration of the detection zone boundaries.
शिफारस केलेला दृष्टिकोन दाखवा
The most likely causes of overcounting are: (1) MAC randomisation causing individual devices to be counted multiple times as their MAC address changes; (2) probe requests from devices outside the store perimeter being detected by APs near windows or entrances — devices in the car park or on the street are being included in the count; (3) staff devices being included in the footfall count. Diagnose by comparing the analytics data against manual counts at specific time windows and correlating with known variables (e.g., is the discrepancy consistent across all stores or concentrated in stores with large car parks?). Resolution: configure detection zone boundaries to exclude the perimeter area, implement a minimum dwell time threshold (e.g., only count devices detected for more than 2 minutes) to filter out pass-by devices, exclude known staff MAC addresses or implement a staff device exclusion list, and use authenticated session data as a cross-validation source. Accept that presence analytics will always produce higher counts than door counters due to multi-device households and use the data for trend analysis rather than absolute counts.
Q3. A stadium operator wants to use WiFi analytics to improve the fan experience during match days, specifically to reduce queuing at concession stands and to enable targeted push notifications to fans in specific zones. The IT team has a Wi-Fi 6 network with 200 APs deployed across the venue. What additional configuration and integrations are required to deliver both use cases?
💡 संकेत:Consider the different data requirements for the two use cases: queue monitoring is an operational use case that can use presence analytics, while targeted push notifications require authenticated user profiles with location data and a notification delivery mechanism.
शिफारस केलेला दृष्टिकोन दाखवा
For queue monitoring at concession stands: configure zone-level presence analytics for each concession area, set up real-time alerting when device counts in a zone exceed a defined threshold, and integrate the alerts with the stadium operations centre dashboard. This use case can be delivered using presence analytics alone and does not require user authentication. For targeted push notifications: deploy a captive portal on the stadium WiFi with a compelling authentication offer (e.g., match day loyalty points, exclusive content). Integrate the WiFi analytics platform with the stadium's CRM and mobile app via API. Configure zone-level location tracking to identify which fans are in which areas of the stadium. Use the analytics platform's segmentation capability to create audience segments based on location (e.g., fans in the East Stand concourse) and trigger push notifications via the mobile app integration. Ensure the captive portal consent capture explicitly covers location-based marketing communications, and provide fans with a clear opt-out mechanism. Test the notification latency — from zone detection to notification delivery — to ensure it is under 60 seconds for time-sensitive offers.
