Casos de Uso de Análisis WiFi: Cómo las Empresas Utilizan los Datos de Ubicación
Esta guía proporciona a gerentes de TI, arquitectos de red, CTOs y directores de operaciones de recintos una referencia práctica y autorizada sobre los casos de uso de análisis WiFi — cubriendo cómo las empresas de comercio minorista, atención médica, hotelería y eventos están aprovechando los datos de ubicación de la infraestructura inalámbrica existente para impulsar la eficiencia operativa y el ROI comercial. Examina la arquitectura técnica que sustenta las plataformas de inteligencia espacial, recorre escenarios de implementación del mundo real y ofrece orientación de implementación neutral para el proveedor junto con marcos de cumplimiento y mitigación de riesgos. Para cualquier organización que opere un recinto físico con Guest WiFi, esta guía traza el camino desde la conectividad pasiva hasta la inteligencia de negocios activa.
🎧 Escucha esta guía
Ver transcripción

Resumen Ejecutivo
Para los líderes de TI y directores de operaciones de recintos, implementar una red inalámbrica robusta ya no se trata solo de proporcionar acceso a internet, es una inversión estratégica en inteligencia espacial. Esta guía explora casos de uso prácticos de análisis WiFi en entornos empresariales, detallando cómo las organizaciones aprovechan los datos de ubicación para optimizar operaciones, mejorar las experiencias del cliente e impulsar un ROI medible. Al transformar los puntos de acceso estándar en un motor integral de Guest WiFi y WiFi Analytics , las empresas pueden extraer información procesable de las solicitudes de sondeo de dispositivos y los datos de asociación. Desde el mapeo de afluencia en el comercio minorista hasta la gestión de colas en instalaciones de atención médica, examinamos la arquitectura técnica, las estrategias de implementación y los protocolos de mitigación de riesgos necesarios para convertir la conectividad en una ventaja comercial. Para una visión general fundamental de la tecnología, consulte ¿Qué es el Análisis WiFi? Una Guía Completa .
Análisis Técnico Detallado
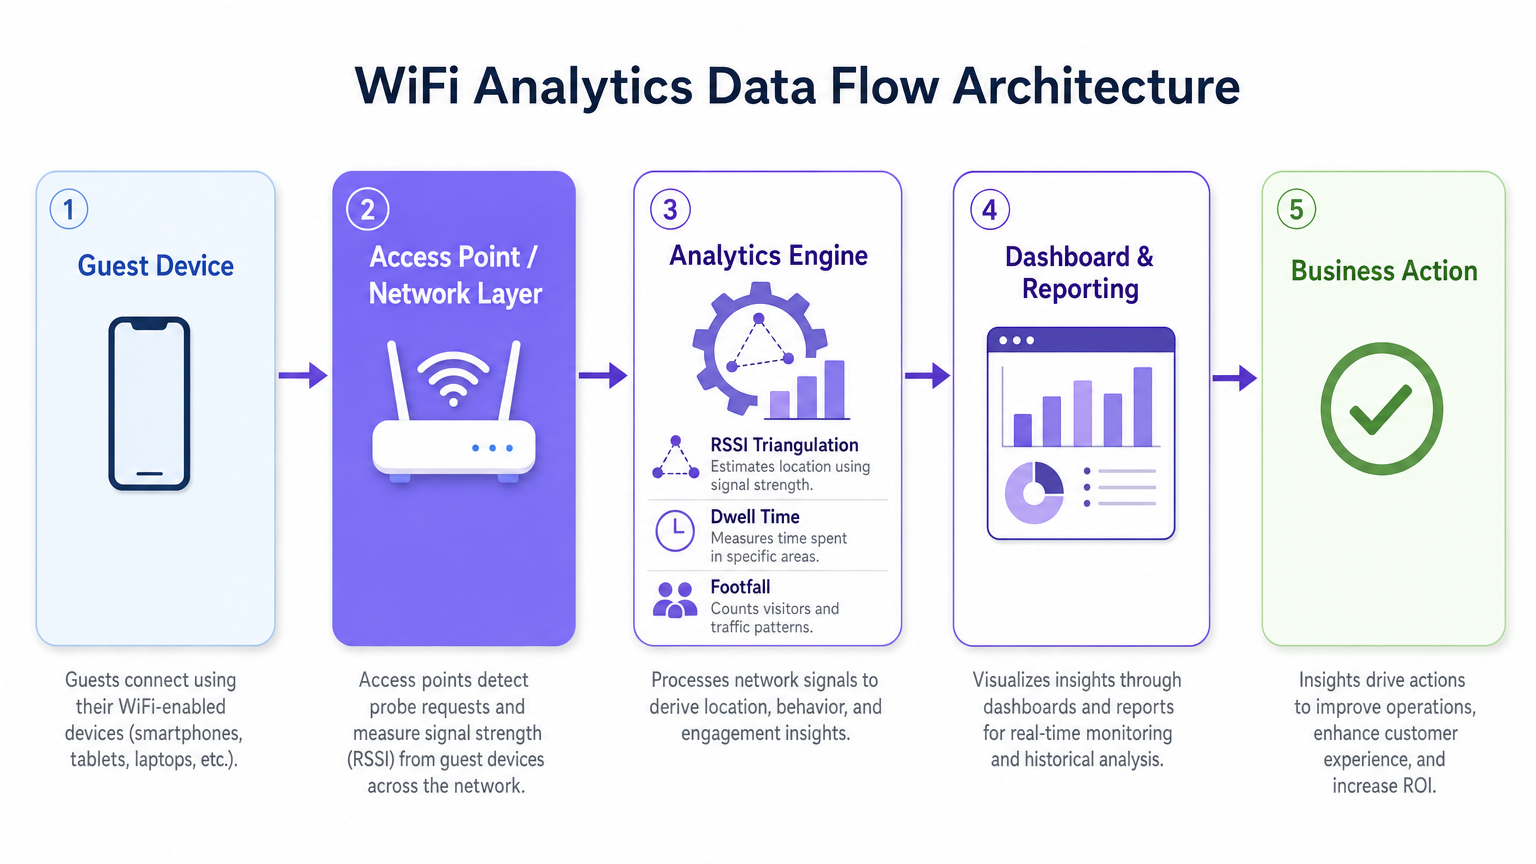
Comprender la mecánica de una plataforma de WiFi Analytics requiere examinar el flujo de datos desde el dispositivo cliente hasta el motor de análisis. Los puntos de acceso (APs) modernos detectan solicitudes de sondeo no asociadas transmitidas por smartphones que buscan redes conocidas. Al agregar los valores del Indicador de Intensidad de Señal Recibida (RSSI) a través de múltiples APs, el sistema triangula las ubicaciones de los dispositivos con una precisión que varía según la densidad de implementación y las condiciones ambientales de RF.
Cuando un usuario se conecta activamente a través de un Captive Portal, el motor de análisis vincula la dirección MAC a un perfil de usuario autenticado. Esta transición del análisis de presencia anónima a datos demográficos autenticados es la base de la inteligencia espacial empresarial. Plataformas como la solución Guest WiFi de Purple están específicamente diseñadas para facilitar esta transición a escala, integrando la gestión del Captive Portal, la recopilación de consentimiento y el análisis en una única implementación.
Mecanismos de Recopilación de Datos
Los tres mecanismos principales de recopilación de datos en una implementación de análisis WiFi son el análisis de presencia, el análisis de ubicación y el análisis autenticado. El análisis de presencia utiliza solicitudes de sondeo no asociadas para contar la afluencia, medir los tiempos de permanencia e identificar visitantes recurrentes basándose en direcciones MAC con hash, proporcionando una amplia visibilidad del tráfico del recinto sin requerir conexiones activas. El análisis de ubicación emplea algoritmos de trilateración para mapear el movimiento de dispositivos a través de un plano; las implementaciones avanzadas pueden integrar tecnologías de posicionamiento complementarias, como se detalla en la Guía de Sistemas de Posicionamiento Interior: UWB, BLE y WiFi , para mejorar la precisión más allá de las capacidades estándar de WiFi. El análisis autenticado captura datos demográficos y de comportamiento cuando los usuarios se autentican a través del Captive Portal, integrándose con sistemas CRM y programas de lealtad para construir perfiles de usuario completos y longitudinales.
Una consideración técnica crítica es la aleatorización de direcciones MAC. Los sistemas operativos modernos iOS y Android aleatorizan las direcciones MAC de los dispositivos para proteger la privacidad del usuario, lo que significa que el análisis de presencia basado únicamente en solicitudes de sondeo no asociadas contará en exceso a los visitantes únicos durante períodos prolongados. La estrategia de mitigación es incentivar la autenticación activa —a través de ofertas atractivas del Captive Portal, inicio de sesión social sin interrupciones o integración con OpenRoaming— para que el motor de análisis rastree las sesiones autenticadas en lugar de las MACs aleatorizadas efímeras. Esto vincula directamente la calidad de la experiencia de su portal con la calidad de sus datos de análisis.
Arquitectura y Estándares
Una implementación de análisis WiFi de grado de producción sigue una arquitectura de cinco capas: la capa de dispositivo cliente, la capa de punto de acceso y red (compatible con IEEE 802.11ax / Wi-Fi 6 para entornos de alta densidad), el motor de análisis que realiza la triangulación RSSI y el cálculo del tiempo de permanencia, la capa de panel y generación de informes, y la capa de acción empresarial donde los conocimientos impulsan las decisiones operativas. Para recintos de alta densidad —estadios, centros de conferencias, grandes superficies comerciales— Wi-Fi 6 es el estándar mínimo recomendado, introduciendo OFDMA y BSS Colouring para gestionar conexiones concurrentes sin degradación del rendimiento.
El cumplimiento con GDPR, CCPA y PCI DSS (donde los datos de pago se cruzan con la infraestructura de red) no es negociable. El hashing de direcciones MAC, la captura de consentimiento explícito en el Captive Portal, la minimización de datos y las políticas de retención definidas son requisitos básicos para cualquier implementación que maneje datos personales.
Guía de Implementación
Implementar con éxito una solución de análisis WiFi requiere un enfoque estructurado para el diseño de la red, la selección de hardware y la configuración del software.
Fase 1 — Evaluación de la Red y Estudio de Sitio. Realice un estudio de sitio de RF exhaustivo para evaluar la cobertura existente, identificar fuentes de interferencia y determinar la ubicación óptima de los AP. Para la precisión del análisis de ubicación, necesita un mínimo de tres APs detectando cualquier dispositivo dado simultáneamente. En la práctica, esto significa un espaciado de AP de aproximadamente 15 a 20 metros en espacios abiertos-entornos de planificación, con una ubicación más densa en zonas de alto valor como áreas de pago en tiendas minoristas o salas de espera de hospitales.
Fase 2 — Diseño del Captive Portal y Estrategia de Autenticación. Diseñe un Captive Portal que minimice la fricción y maximice la adquisición de datos. Implemente la elaboración de perfiles progresiva: recopile un conjunto mínimo de datos en la primera conexión (dirección de correo electrónico y consentimiento) y enriquezca el perfil en visitas posteriores. Admita múltiples métodos de autenticación: inicio de sesión social (Google, Facebook), registro por correo electrónico y OpenRoaming para usuarios en itinerancia sin interrupciones. Asegúrese de que el portal esté optimizado para dispositivos móviles y se cargue en menos de tres segundos con una conexión 4G.
Fase 3 — Integración de la Plataforma de Análisis. Integre la plataforma de análisis con las herramientas de inteligencia empresarial, los sistemas CRM y las plataformas de automatización de marketing existentes. La plataforma WiFi Analytics de Purple ofrece integraciones preestablecidas con las principales plataformas CRM y de marketing, lo que permite a los equipos multifuncionales actuar sobre los conocimientos espaciales sin necesidad de un desarrollo a medida. Defina sus indicadores clave de rendimiento antes de la implementación (recuento de afluencia, tiempos de permanencia, tasas de visitas recurrentes, mapas de calor a nivel de zona) y configure los paneles de control en consecuencia.
Fase 4 — Cumplimiento y Gobernanza de Datos. Implemente una Evaluación de Impacto de Protección de Datos (DPIA) antes de la puesta en marcha. Asegúrese de que los avisos de privacidad sean precisos, los mecanismos de consentimiento sean explícitos y granulares, y las políticas de retención de datos se apliquen a nivel de plataforma. Designe un propietario de datos responsable del monitoreo continuo del cumplimiento.
Mejores Prácticas
Para maximizar el valor de una inversión en análisis WiFi, siga las siguientes recomendaciones estándar de la industria.
Optimice la densidad de los AP específicamente para el análisis de ubicación, no solo para la cobertura. Una red diseñada para el acceso básico a Internet normalmente tendrá una superposición de AP insuficiente para una trilateración confiable. Realice una encuesta separada específica para el análisis de ubicación y ajuste la ubicación de los AP o agregue AP suplementarios en zonas de alto valor.
Implemente la mitigación de la aleatorización de MAC a través de un diseño de Captive Portal atractivo. La tasa de conexión (la proporción de dispositivos detectados que se autentican) es la métrica más importante para la calidad de los datos analíticos. Un portal bien diseñado con una propuesta de valor clara (WiFi gratuito, puntos de fidelidad, contenido exclusivo) logra consistentemente tasas de conexión del 40-60% en entornos minoristas y hoteleros.
Calibre los algoritmos de ubicación regularmente. Los cambios ambientales (nuevas estructuras físicas, exhibiciones de productos de temporada, densidades de multitudes variables) afectan la propagación de RF y pueden degradar la precisión de la ubicación con el tiempo. Programe revisiones de calibración trimestrales y recalibre después de cualquier cambio físico significativo en el lugar.
Integre los datos de análisis WiFi con otras fuentes de datos operativos. Los conocimientos se vuelven significativamente más potentes cuando se correlacionan con datos de puntos de venta, horarios de personal y cronogramas de campañas de marketing. Esta integración multifuncional es donde el caso de ROI se vuelve convincente para los altos directivos.
Para organizaciones que implementan en entornos automotrices o de transporte, las guías Wi-Fi in Auto: The Complete 2026 Enterprise Guide y Internet of Things Architecture: A Complete Guide proporcionan un contexto arquitectónico relevante para extender el análisis WiFi más allá de los entornos de lugares tradicionales.
Solución de Problemas y Mitigación de Riesgos
Las implementaciones empresariales comúnmente encuentran desafíos en tres áreas: precisión de los datos, adopción por parte del usuario y cumplimiento.
Los datos de ubicación inexactos suelen ser causados por una densidad insuficiente de AP, una interferencia de RF significativa de redes adyacentes u obstrucciones físicas, o la falta de consideración de la aleatorización de MAC. Diagnostique comparando los recuentos de afluencia esperados con los recuentos de observación manual durante un período de prueba controlado. Si la varianza supera el 20%, realice una nueva encuesta del sitio y revise la ubicación de los AP.
Las bajas tasas de autenticación indican una experiencia de Captive Portal demasiado compleja, demasiado lenta o insuficientemente atractiva. Audite el tiempo de carga del portal, el número de pasos para la autenticación y la claridad de la propuesta de valor. Realice pruebas A/B de diferentes diseños y ofertas de portal para identificar la configuración con mayor tasa de conversión.
Las violaciones de la privacidad de los datos representan el riesgo más significativo, con multas de GDPR que alcanzan hasta el 4% de la facturación anual global. Mitigue implementando un programa de cumplimiento riguroso desde el principio: captura de consentimiento explícito, avisos de privacidad precisos, minimización de datos, anonimización de datos de análisis de presencia y auditorías de cumplimiento regulares. Asegúrese de que su proveedor de plataforma de análisis proporcione un Acuerdo de Procesamiento de Datos (DPA) y esté certificado según ISO 27001 o equivalente.
ROI e Impacto Comercial
El caso de negocio para el análisis WiFi es más sólido cuando se enmarca en torno a resultados operativos específicos en lugar de la recopilación genérica de datos. Los siguientes puntos de referencia se basan en implementaciones empresariales típicas en la base de clientes de Purple.
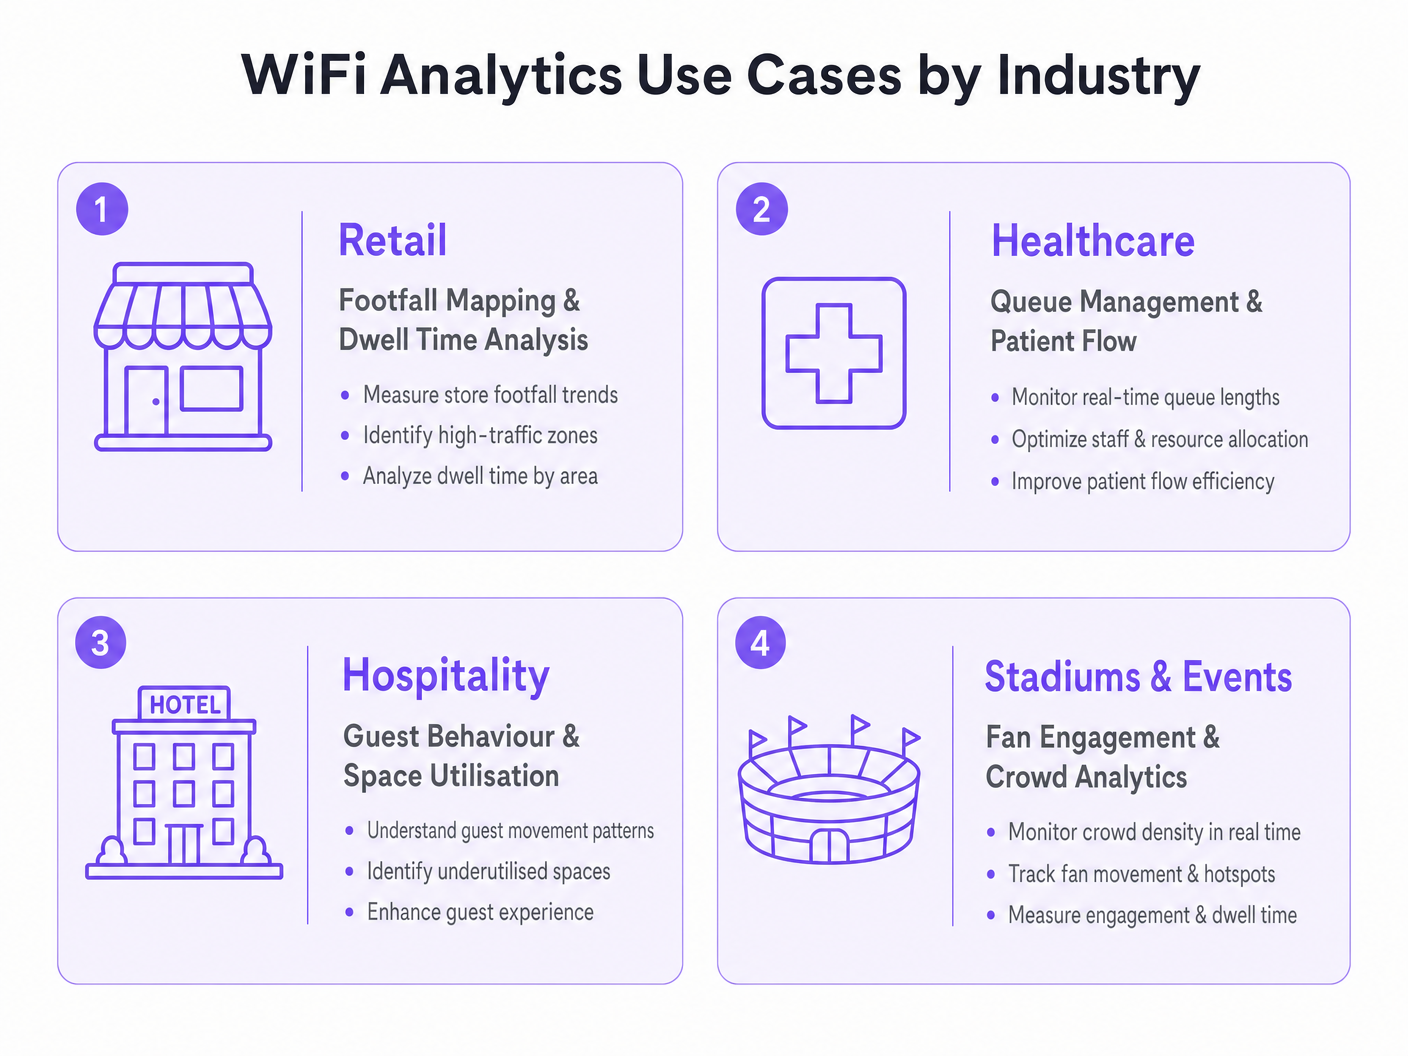
| Vertical | Caso de Uso Principal | Resultado Típico |
|---|---|---|
| Retail | Mapeo de afluencia y optimización de zonas | Aumento del 8-15% en el valor promedio de la transacción |
| Healthcare | Gestión de colas y flujo de pacientes | Reducción del 20-30% en los tiempos de espera promedio |
| Hospitality | Comportamiento del huésped y utilización del espacio | Mejora del 12-18% en los ingresos de alimentos y bebidas por huésped |
| Transport | Flujo de pasajeros y optimización de concesiones | Aumento del 10-20% en los ingresos por concesiones minoristas |
Mida el éxito con respecto a una línea de base definida establecida durante la encuesta del sitio previa a la implementación. Realice un seguimiento de sus métricas clave (afluencia, tiempo de permanencia, tasa de visitas recurrentes, tasa de conexión autenticada) con una cadencia semanal durante el primer trimestre posterior a la implementación, y luego mensualmente. Correlacione los datos de análisis con las métricas de rendimiento financiero para construir la narrativa de ROI para los altos directivos y justificar una mayor inversión.miento en la plataforma.
El período de recuperación de la inversión para una implementación de análisis de WiFi bien ejecutada generalmente oscila entre 12 y 18 meses, con una entrega de valor anual continua a través de la optimización operativa continua y datos propios enriquecidos para programas de marketing y lealtad.
Términos clave y definiciones
RSSI (Received Signal Strength Indicator)
A measurement of the power level of a received radio signal, expressed in decibels relative to one milliwatt (dBm). In WiFi analytics, RSSI values from multiple access points are used to triangulate the approximate location of a client device.
IT teams encounter RSSI when configuring location analytics engines and when troubleshooting inaccurate positioning data. A higher RSSI (closer to 0 dBm) indicates a stronger signal and more reliable location data.
Probe Request
A management frame broadcast by a WiFi-enabled device to discover available networks. Probe requests are transmitted even when the device is not connected to any network, making them the basis for passive presence analytics.
The foundation of anonymous footfall counting. IT teams should understand that modern devices randomise the MAC address in probe requests, which affects the accuracy of unique visitor counts in presence analytics deployments.
MAC Address Randomisation
A privacy feature implemented in modern mobile operating systems (iOS 14+, Android 10+) that causes devices to use randomised MAC addresses in probe requests and, in some configurations, when connecting to networks. This prevents persistent tracking of devices across time and locations.
The primary technical challenge for WiFi analytics deployments relying on passive presence data. Mitigation requires incentivising active authentication through the captive portal, where the authenticated session provides a stable identifier.
Captive Portal
A web page presented to users when they connect to a public or guest WiFi network, requiring authentication or acceptance of terms before granting internet access. In WiFi analytics deployments, the captive portal is the primary mechanism for collecting authenticated user data and consent.
The design and performance of the captive portal directly determines the authentication rate, which is the key driver of analytics data quality. IT teams should treat captive portal optimisation as a continuous improvement activity.
Trilateration
A geometric technique for determining the position of a point by measuring its distance from three or more known reference points. In WiFi analytics, trilateration uses RSSI values from multiple access points to estimate device location on a floor plan.
The core algorithm behind WiFi-based indoor positioning. IT teams should understand that trilateration accuracy degrades with fewer than three reference APs, with significant RF interference, or in environments with complex physical layouts.
Dwell Time
The duration a device (and by proxy, a person) remains within a defined zone or venue. Dwell time is a key metric in WiFi analytics, used to measure customer engagement with specific areas of a retail store, waiting times in healthcare settings, or fan engagement in stadium concourse areas.
One of the most commercially actionable metrics in WiFi analytics. High dwell time in a retail zone correlates with purchase intent; low dwell time in a hospitality venue may indicate a poor customer experience. Used alongside footfall data to calculate zone efficiency.
Presence Analytics
The analysis of WiFi probe request data to determine the number of devices (and by proxy, people) present in a venue or zone, without requiring active network connection. Provides passive footfall counting and dwell time measurement.
The entry-level capability of most WiFi analytics platforms. Useful for broad traffic trend analysis but subject to distortion from MAC randomisation. IT teams should use presence analytics for directional insights and authenticated analytics for precise, demographically segmented data.
OpenRoaming
A Wireless Broadband Alliance (WBA) standard that enables seamless, automatic WiFi authentication across participating networks using identity credentials from trusted providers (mobile operators, social identity providers). Eliminates the need for manual captive portal interaction for participating users.
Increasingly relevant for enterprise deployments seeking to maximise authenticated connection rates without increasing portal friction. Purple supports OpenRoaming as an authentication method, enabling venues to capture analytics data from roaming users who would otherwise bypass the captive portal.
Heat Map
A data visualisation technique that uses colour gradients to represent the density or intensity of a variable across a geographic area. In WiFi analytics, heat maps display footfall density or dwell time intensity across a venue floor plan, enabling rapid identification of high-traffic and low-traffic zones.
The most commonly used visualisation in WiFi analytics dashboards. IT teams and operations directors use heat maps to communicate spatial insights to non-technical stakeholders and to inform decisions about store layout, staffing allocation, and facility management.
Casos de éxito
A UK fashion retailer with 12 stores notices that conversion rates are declining despite stable footfall. Store managers report that customers seem to browse the front of the store but rarely reach the back sections where higher-margin products are displayed. How should the IT and operations teams deploy WiFi analytics to diagnose and address this problem?
Deploy Purple's WiFi Analytics platform across all 12 stores, ensuring sufficient AP density (minimum 3 APs per zone) to support zone-level location tracking. Configure floor plan maps for each store within the analytics platform, defining zones that correspond to product categories and store sections. Run a 4-week baseline data collection period to establish footfall heat maps, dwell times by zone, and customer journey paths. Analyse the data to identify the specific point in the store layout where customer flow drops off. Cross-reference with point-of-sale data to identify which zones correlate with higher transaction values. Use the insights to inform a store layout redesign — repositioning high-margin categories into high-traffic zones identified by the heat maps. Implement a captive portal offering a loyalty discount to incentivise authentication, enabling demographic segmentation of the analytics data. Re-measure after the layout change to quantify the uplift.
An NHS trust is experiencing patient satisfaction issues related to waiting times in its outpatient departments. The operations director wants to use WiFi analytics to gain real-time visibility into patient flow and queue lengths. What are the technical and compliance considerations for this deployment?
Deploy WiFi analytics across the outpatient department, mapping waiting areas, consultation rooms, and corridors as distinct zones. Configure real-time alerting within the analytics platform to trigger notifications to the operations team when queue lengths in specific waiting areas exceed defined thresholds (e.g., more than 15 devices detected in a waiting zone for more than 30 minutes). Integrate the analytics platform with the existing patient management system via API to correlate WiFi presence data with appointment schedules. For compliance, conduct a DPIA before deployment, as patient location data in a healthcare setting is particularly sensitive. Implement strict data anonymisation — ensure that WiFi analytics data cannot be linked back to individual patient records. Use presence analytics (unassociated probe requests) for queue monitoring rather than authenticated analytics, minimising the personal data collected. Provide clear signage in waiting areas informing patients that WiFi analytics are in use for service improvement purposes.
Análisis de escenarios
Q1. A 500-bed hospital trust wants to deploy WiFi analytics to monitor patient flow through its A&E department. The CISO raises concerns about GDPR compliance, specifically whether location tracking of patients constitutes processing of sensitive personal data. How do you structure the deployment to achieve the operational objective while satisfying the compliance requirement?
💡 Sugerencia:Consider whether the operational objective (queue monitoring) requires authenticated personal data, or whether anonymous presence analytics would be sufficient. Think about the distinction between presence analytics and authenticated analytics in the context of GDPR's data minimisation principle.
Mostrar enfoque recomendado
Structure the deployment using presence analytics only for queue monitoring — unassociated probe request data provides sufficient signal for counting devices in waiting zones and measuring dwell times without requiring authentication or the collection of personal data. Implement strict data anonymisation: hash all MAC addresses before storage, apply a rolling anonymisation window of no more than 24 hours, and ensure the analytics platform cannot link WiFi data to patient records. Provide clear signage in the A&E department informing visitors that anonymous WiFi analytics are in use for service improvement. Conduct a DPIA documenting the data minimisation approach and the technical controls in place. This approach achieves the operational objective — real-time queue visibility and dwell time monitoring — while processing no personal data, thereby avoiding the GDPR compliance risk entirely.
Q2. A retail chain deploys WiFi analytics across 20 stores and finds that the footfall counts from the analytics platform are consistently 40% higher than manual door counter readings. What are the most likely causes and how do you diagnose and resolve the discrepancy?
💡 Sugerencia:Think about the sources of overcounting in presence analytics. Consider the impact of MAC randomisation, the behaviour of devices in adjacent areas (car parks, neighbouring stores), and the configuration of the detection zone boundaries.
Mostrar enfoque recomendado
The most likely causes of overcounting are: (1) MAC randomisation causing individual devices to be counted multiple times as their MAC address changes; (2) probe requests from devices outside the store perimeter being detected by APs near windows or entrances — devices in the car park or on the street are being included in the count; (3) staff devices being included in the footfall count. Diagnose by comparing the analytics data against manual counts at specific time windows and correlating with known variables (e.g., is the discrepancy consistent across all stores or concentrated in stores with large car parks?). Resolution: configure detection zone boundaries to exclude the perimeter area, implement a minimum dwell time threshold (e.g., only count devices detected for more than 2 minutes) to filter out pass-by devices, exclude known staff MAC addresses or implement a staff device exclusion list, and use authenticated session data as a cross-validation source. Accept that presence analytics will always produce higher counts than door counters due to multi-device households and use the data for trend analysis rather than absolute counts.
Q3. A stadium operator wants to use WiFi analytics to improve the fan experience during match days, specifically to reduce queuing at concession stands and to enable targeted push notifications to fans in specific zones. The IT team has a Wi-Fi 6 network with 200 APs deployed across the venue. What additional configuration and integrations are required to deliver both use cases?
💡 Sugerencia:Consider the different data requirements for the two use cases: queue monitoring is an operational use case that can use presence analytics, while targeted push notifications require authenticated user profiles with location data and a notification delivery mechanism.
Mostrar enfoque recomendado
For queue monitoring at concession stands: configure zone-level presence analytics for each concession area, set up real-time alerting when device counts in a zone exceed a defined threshold, and integrate the alerts with the stadium operations centre dashboard. This use case can be delivered using presence analytics alone and does not require user authentication. For targeted push notifications: deploy a captive portal on the stadium WiFi with a compelling authentication offer (e.g., match day loyalty points, exclusive content). Integrate the WiFi analytics platform with the stadium's CRM and mobile app via API. Configure zone-level location tracking to identify which fans are in which areas of the stadium. Use the analytics platform's segmentation capability to create audience segments based on location (e.g., fans in the East Stand concourse) and trigger push notifications via the mobile app integration. Ensure the captive portal consent capture explicitly covers location-based marketing communications, and provide fans with a clear opt-out mechanism. Test the notification latency — from zone detection to notification delivery — to ensure it is under 60 seconds for time-sensitive offers.
