Cas d'utilisation de l'analyse WiFi : Comment les entreprises utilisent les données de localisation
Ce guide fournit aux responsables informatiques, aux architectes réseau, aux CTO et aux directeurs des opérations de site une référence pratique et faisant autorité sur les cas d'utilisation de l'analyse WiFi — expliquant comment les entreprises des secteurs de la vente au détail, de la santé, de l'hôtellerie et de l'événementiel exploitent les données de localisation issues de l'infrastructure sans fil existante pour améliorer l'efficacité opérationnelle et le retour sur investissement commercial. Il examine l'architecture technique sous-jacente aux plateformes d'intelligence spatiale, présente des scénarios de déploiement réels et fournit des conseils de mise en œuvre neutres vis-à-vis des fournisseurs, ainsi que des cadres de conformité et d'atténuation des risques. Pour toute organisation exploitant un site physique avec un WiFi invité, ce guide trace le chemin de la connectivité passive à l'intelligence d'affaires active.
🎧 Écouter ce guide
Voir la transcription

Résumé Exécutif
Pour les leaders informatiques et les directeurs des opérations de site, le déploiement d'un réseau sans fil robuste ne se limite plus à la fourniture d'un accès à Internet — c'est un investissement stratégique dans l'intelligence spatiale. Ce guide explore des cas d'utilisation pratiques de l'analyse WiFi dans les environnements d'entreprise, détaillant comment les organisations exploitent les données de localisation pour optimiser les opérations, améliorer l'expérience client et générer un retour sur investissement mesurable. En transformant les points d'accès standard en un moteur complet de WiFi invité et d' Analyse WiFi , les entreprises peuvent extraire des informations exploitables à partir des requêtes de sondage des appareils et des données d'association. Du mappage de la fréquentation en magasin à la gestion des files d'attente dans les établissements de santé, nous examinons l'architecture technique, les stratégies de déploiement et les protocoles d'atténuation des risques nécessaires pour transformer la connectivité en avantage commercial. Pour un aperçu fondamental de la technologie, consultez Qu'est-ce que l'Analyse WiFi ? Un Guide Complet .
Approfondissement Technique
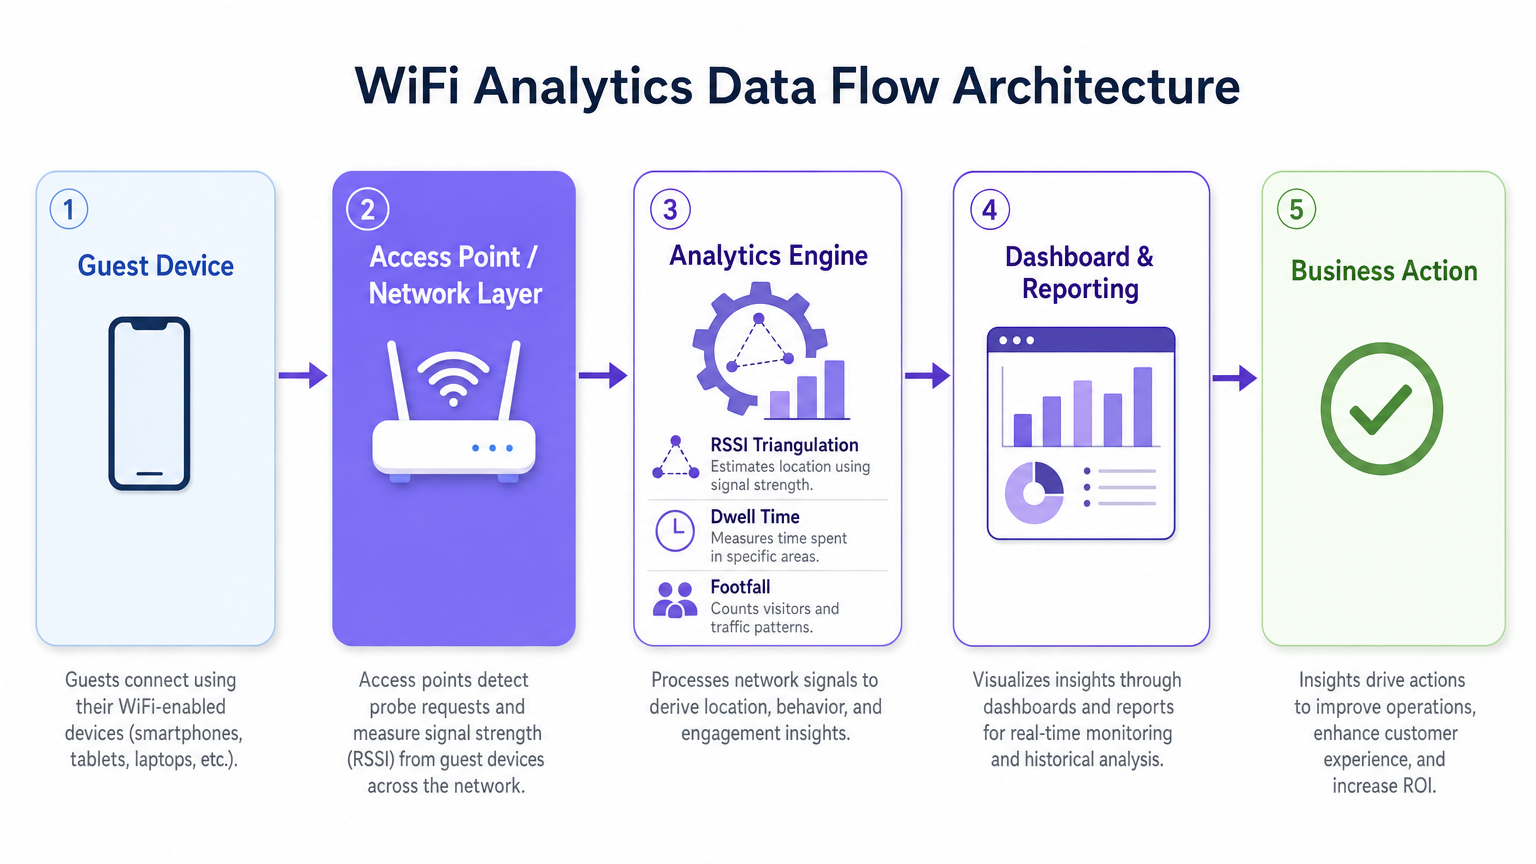
Comprendre les mécanismes d'une plateforme d' Analyse WiFi nécessite d'examiner le flux de données du périphérique client vers le moteur d'analyse. Les points d'accès (AP) modernes détectent les requêtes de sondage non associées émises par les smartphones à la recherche de réseaux connus. En agrégeant les valeurs de l'Indicateur de Force du Signal Reçu (RSSI) sur plusieurs AP, le système triangule les emplacements des appareils avec une précision qui varie en fonction de la densité de déploiement et des conditions RF environnementales.
Lorsqu'un utilisateur se connecte activement via un Captive Portal, le moteur d'analyse lie l'adresse MAC à un profil utilisateur authentifié. Cette transition de l'analyse de présence anonyme aux données démographiques authentifiées est le fondement de l'intelligence spatiale d'entreprise. Les plateformes comme la solution Guest WiFi de Purple sont spécifiquement conçues pour faciliter cette transition à grande échelle, en intégrant la gestion du Captive Portal, la collecte de consentement et l'analyse dans un déploiement unique.
Mécanismes de Collecte de Données
Les trois principaux mécanismes de collecte de données dans un déploiement d'analyse WiFi sont l'analyse de présence, l'analyse de localisation et l'analyse authentifiée. L'analyse de présence utilise les requêtes de sondage non associées pour compter la fréquentation, mesurer les temps de séjour et identifier les visiteurs récurrents basés sur les adresses MAC hachées, offrant une visibilité étendue du trafic sur le site sans nécessiter de connexions actives. L'analyse de localisation utilise des algorithmes de trilatération pour cartographier le mouvement des appareils sur un plan d'étage ; les déploiements avancés peuvent intégrer des technologies de positionnement complémentaires, comme détaillé dans le Guide des Systèmes de Positionnement Intérieur : UWB, BLE et WiFi , pour améliorer la précision au-delà des capacités WiFi standard. L'analyse authentifiée capture des données démographiques et comportementales lorsque les utilisateurs s'authentifient via le Captive Portal, s'intégrant aux systèmes CRM et aux programmes de fidélité pour construire des profils utilisateurs complets et longitudinaux.
Une considération technique critique est la randomisation des adresses MAC. Les systèmes d'exploitation modernes iOS et Android randomisent les adresses MAC des appareils pour protéger la vie privée des utilisateurs, ce qui signifie que l'analyse de présence basée uniquement sur les requêtes de sondage non associées surcomptera les visiteurs uniques sur des périodes prolongées. La stratégie d'atténuation consiste à inciter à l'authentification active — via des offres Captive Portal attrayantes, une connexion sociale fluide ou l'intégration OpenRoaming — afin que le moteur d'analyse suive les sessions authentifiées plutôt que les adresses MAC randomisées éphémères. Cela lie directement la qualité de votre expérience portail à la qualité de vos données d'analyse.
Architecture et Normes
Un déploiement d'analyse WiFi de qualité production suit une architecture à cinq couches : la couche des périphériques clients, la couche des points d'accès et du réseau (prenant en charge IEEE 802.11ax / Wi-Fi 6 pour les environnements à haute densité), le moteur d'analyse effectuant la triangulation RSSI et le calcul du temps de séjour, la couche de tableau de bord et de rapports, et la couche d'action commerciale où les informations guident les décisions opérationnelles. Pour les sites à haute densité — stades, centres de conférence, grandes surfaces de vente au détail — le Wi-Fi 6 est la norme minimale recommandée, introduisant l'OFDMA et le BSS Colouring pour gérer les connexions concurrentes sans dégradation du débit.
La conformité avec le GDPR, le CCPA et le PCI DSS (lorsque les données de paiement recoupent l'infrastructure réseau) est non négociable. Le hachage des adresses MAC, la capture explicite du consentement au niveau du Captive Portal, la minimisation des données et les politiques de rétention définies sont des exigences de base pour tout déploiement traitant des données personnelles.
Guide d'Implémentation
Le déploiement réussi d'une solution d'analyse WiFi nécessite une approche structurée de la conception du réseau, de la sélection du matériel et de la configuration logicielle.
Phase 1 — Évaluation du Réseau et Étude de Site. Menez une étude de site RF complète pour évaluer la couverture existante, identifier les sources d'interférence et déterminer l'emplacement optimal des AP. Pour la précision de l'analyse de localisation, vous avez besoin d'un minimum de trois AP détectant simultanément tout appareil donné. En pratique, cela signifie un espacement des AP d'environ 15 à 20 mètres en espace ouvert-environnements planifiés, avec un placement plus dense dans les zones à forte valeur ajoutée telles que les caisses de vente au détail ou les salles d'attente d'hôpitaux.
Phase 2 — Conception du Captive Portal et Stratégie d'Authentification. Concevez un Captive Portal qui minimise les frictions tout en maximisant l'acquisition de données. Mettez en œuvre le profilage progressif — collectez un ensemble de données minimal lors de la première connexion (adresse e-mail et consentement) et enrichissez le profil lors des visites ultérieures. Prenez en charge plusieurs méthodes d'authentification : social login (Google, Facebook), inscription par e-mail et OpenRoaming pour les utilisateurs en itinérance transparente. Assurez-vous que le portail est optimisé pour les mobiles et se charge en moins de trois secondes sur une connexion 4G.
Phase 3 — Intégration de la Plateforme d'Analyse. Intégrez la plateforme d'analyse avec les outils de business intelligence, les systèmes CRM et les plateformes d'automatisation du marketing existants. La plateforme WiFi Analytics de Purple offre des intégrations pré-construites avec les principales plateformes CRM et marketing, permettant aux équipes interfonctionnelles d'agir sur les informations spatiales sans nécessiter de développement sur mesure. Définissez vos indicateurs clés de performance avant le déploiement — nombre de visiteurs, temps de présence, taux de revisite, cartes thermiques par zone — et configurez les tableaux de bord en conséquence.
Phase 4 — Conformité et Gouvernance des Données. Mettez en œuvre une analyse d'impact relative à la protection des données (DPIA) avant la mise en service. Assurez-vous que les avis de confidentialité sont exacts, que les mécanismes de consentement sont explicites et granulaires, et que les politiques de conservation des données sont appliquées au niveau de la plateforme. Nommez un propriétaire des données responsable du suivi continu de la conformité.
Bonnes Pratiques
Pour maximiser la valeur d'un investissement dans l'analyse WiFi, respectez les recommandations standard de l'industrie suivantes.
Optimisez la densité des points d'accès (AP) spécifiquement pour l'analyse de localisation, et non seulement pour la couverture. Un réseau conçu pour un accès Internet de base aura généralement un chevauchement d'AP insuffisant pour une trilatération fiable. Menez une étude distincte spécifique à l'analyse de localisation et ajustez le placement des AP ou ajoutez des AP supplémentaires dans les zones à forte valeur ajoutée.
Mettez en œuvre l'atténuation de la randomisation MAC grâce à une conception de Captive Portal attrayante. Le taux de connexion — la proportion d'appareils détectés qui s'authentifient — est la métrique la plus importante pour la qualité des données d'analyse. Un portail bien conçu avec une proposition de valeur claire (WiFi gratuit, points de fidélité, contenu exclusif) atteint constamment des taux de connexion de 40 à 60 % dans les environnements de vente au détail et d'hôtellerie.
Calibrez régulièrement les algorithmes de localisation. Les changements environnementaux — nouvelles structures physiques, présentoirs de produits saisonniers, densités de foule variables — affectent la propagation RF et peuvent dégrader la précision de la localisation au fil du temps. Planifiez des examens de calibration trimestriels et recalibrez après tout changement physique significatif du lieu.
Intégrez les données d'analyse WiFi avec d'autres sources de données opérationnelles. Les informations deviennent considérablement plus puissantes lorsqu'elles sont corrélées avec les données de point de vente, les plannings du personnel et les calendriers des campagnes marketing. Cette intégration interfonctionnelle est l'endroit où le cas de ROI devient convaincant pour les parties prenantes seniors.
Pour les organisations déployant dans des environnements automobiles ou de transport, le Wi-Fi in Auto: The Complete 2026 Enterprise Guide et Internet of Things Architecture: A Complete Guide fournissent un contexte architectural pertinent pour étendre l'analyse WiFi au-delà des paramètres traditionnels des lieux.
Dépannage et Atténuation des Risques
Les déploiements d'entreprise rencontrent couramment des défis dans trois domaines : la précision des données, l'adoption par les utilisateurs et la conformité.
Les données de localisation inexactes sont généralement causées par une densité d'AP insuffisante, des interférences RF significatives provenant de réseaux adjacents ou d'obstructions physiques, ou l'incapacité à prendre en compte la randomisation MAC. Diagnostiquez en comparant les nombres de visiteurs attendus aux nombres observés manuellement pendant une période de test contrôlée. Si l'écart dépasse 20 %, effectuez une nouvelle étude de site et révisez le placement des AP.
Les faibles taux d'authentification indiquent une expérience de Captive Portal trop complexe, trop lente ou insuffisamment attrayante. Auditez le temps de chargement du portail, le nombre d'étapes d'authentification et la clarté de la proposition de valeur. Testez A/B différentes conceptions de portail et offres pour identifier la configuration la plus performante.
Les violations de la confidentialité des données représentent le risque le plus important, avec des amendes GDPR pouvant atteindre jusqu'à 4 % du chiffre d'affaires annuel mondial. Atténuez ce risque en mettant en œuvre un programme de conformité rigoureux dès le départ : capture de consentement explicite, avis de confidentialité précis, minimisation des données, anonymisation des données d'analyse de présence et audits de conformité réguliers. Assurez-vous que votre fournisseur de plateforme d'analyse fournit un accord de traitement des données (DPA) et est certifié ISO 27001 ou équivalent.
ROI et Impact Commercial
Le cas d'affaires pour l'analyse WiFi est le plus solide lorsqu'il est articulé autour de résultats opérationnels spécifiques plutôt que d'une collecte de données générique. Les repères suivants sont basés sur des déploiements d'entreprise typiques au sein de la clientèle de Purple.
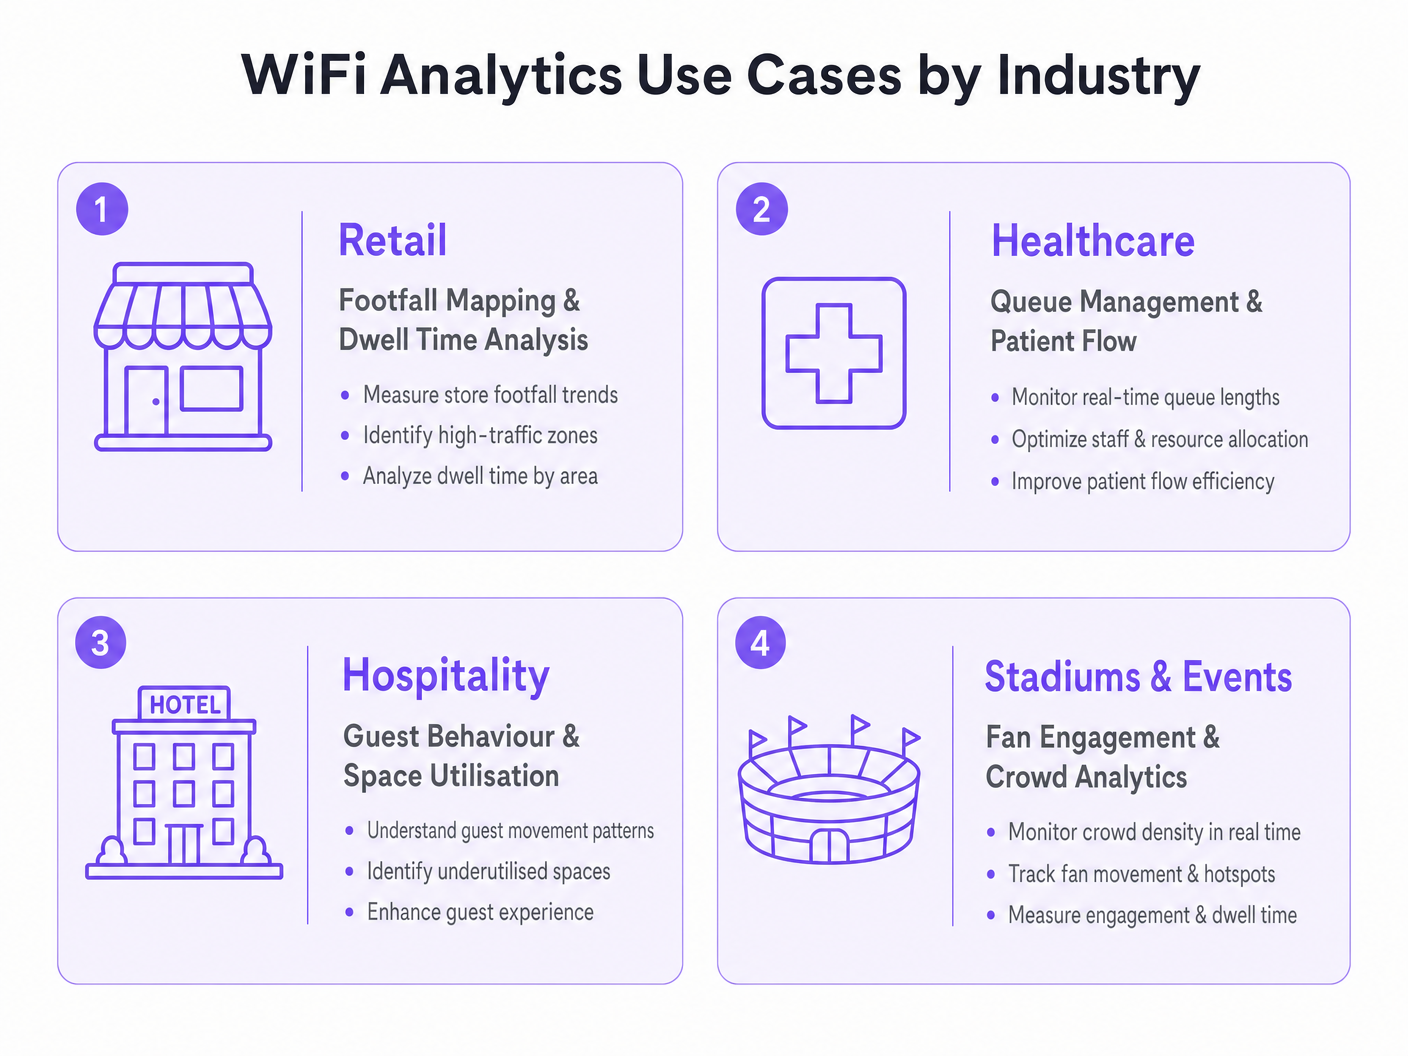
| Verticale | Cas d'Utilisation Principal | Résultat Typique |
|---|---|---|
| Commerce de détail | Cartographie du flux de visiteurs et optimisation des zones | Augmentation de 8 à 15 % de la valeur moyenne des transactions |
| Santé | Gestion des files d'attente et flux de patients | Réduction de 20 à 30 % des temps d'attente moyens |
| Hôtellerie | Comportement des clients et utilisation de l'espace | Amélioration de 12 à 18 % des revenus F&B par client |
| Transport | Flux de passagers et optimisation des concessions | Augmentation de 10 à 20 % des revenus des concessions de détail |
Mesurez le succès par rapport à une base de référence définie lors de l'étude de site préalable au déploiement. Suivez vos métriques clés — nombre de visiteurs, temps de présence, taux de revisite, taux de connexion authentifiée — à une cadence hebdomadaire pour le premier trimestre après le déploiement, puis mensuellement par la suite. Corrélez les données d'analyse avec les métriques de performance financière pour construire le récit du ROI pour les parties prenantes seniors et justifier de nouveaux investissements.ment dans la plateforme.
La période de retour sur investissement pour un déploiement d'analyse WiFi bien exécuté varie généralement de 12 à 18 mois, avec une création de valeur annuelle continue grâce à l'optimisation opérationnelle constante et à des données de première partie enrichies pour les programmes de marketing et de fidélisation.
Termes clés et définitions
RSSI (Received Signal Strength Indicator)
A measurement of the power level of a received radio signal, expressed in decibels relative to one milliwatt (dBm). In WiFi analytics, RSSI values from multiple access points are used to triangulate the approximate location of a client device.
IT teams encounter RSSI when configuring location analytics engines and when troubleshooting inaccurate positioning data. A higher RSSI (closer to 0 dBm) indicates a stronger signal and more reliable location data.
Probe Request
A management frame broadcast by a WiFi-enabled device to discover available networks. Probe requests are transmitted even when the device is not connected to any network, making them the basis for passive presence analytics.
The foundation of anonymous footfall counting. IT teams should understand that modern devices randomise the MAC address in probe requests, which affects the accuracy of unique visitor counts in presence analytics deployments.
MAC Address Randomisation
A privacy feature implemented in modern mobile operating systems (iOS 14+, Android 10+) that causes devices to use randomised MAC addresses in probe requests and, in some configurations, when connecting to networks. This prevents persistent tracking of devices across time and locations.
The primary technical challenge for WiFi analytics deployments relying on passive presence data. Mitigation requires incentivising active authentication through the captive portal, where the authenticated session provides a stable identifier.
Captive Portal
A web page presented to users when they connect to a public or guest WiFi network, requiring authentication or acceptance of terms before granting internet access. In WiFi analytics deployments, the captive portal is the primary mechanism for collecting authenticated user data and consent.
The design and performance of the captive portal directly determines the authentication rate, which is the key driver of analytics data quality. IT teams should treat captive portal optimisation as a continuous improvement activity.
Trilateration
A geometric technique for determining the position of a point by measuring its distance from three or more known reference points. In WiFi analytics, trilateration uses RSSI values from multiple access points to estimate device location on a floor plan.
The core algorithm behind WiFi-based indoor positioning. IT teams should understand that trilateration accuracy degrades with fewer than three reference APs, with significant RF interference, or in environments with complex physical layouts.
Dwell Time
The duration a device (and by proxy, a person) remains within a defined zone or venue. Dwell time is a key metric in WiFi analytics, used to measure customer engagement with specific areas of a retail store, waiting times in healthcare settings, or fan engagement in stadium concourse areas.
One of the most commercially actionable metrics in WiFi analytics. High dwell time in a retail zone correlates with purchase intent; low dwell time in a hospitality venue may indicate a poor customer experience. Used alongside footfall data to calculate zone efficiency.
Presence Analytics
The analysis of WiFi probe request data to determine the number of devices (and by proxy, people) present in a venue or zone, without requiring active network connection. Provides passive footfall counting and dwell time measurement.
The entry-level capability of most WiFi analytics platforms. Useful for broad traffic trend analysis but subject to distortion from MAC randomisation. IT teams should use presence analytics for directional insights and authenticated analytics for precise, demographically segmented data.
OpenRoaming
A Wireless Broadband Alliance (WBA) standard that enables seamless, automatic WiFi authentication across participating networks using identity credentials from trusted providers (mobile operators, social identity providers). Eliminates the need for manual captive portal interaction for participating users.
Increasingly relevant for enterprise deployments seeking to maximise authenticated connection rates without increasing portal friction. Purple supports OpenRoaming as an authentication method, enabling venues to capture analytics data from roaming users who would otherwise bypass the captive portal.
Heat Map
A data visualisation technique that uses colour gradients to represent the density or intensity of a variable across a geographic area. In WiFi analytics, heat maps display footfall density or dwell time intensity across a venue floor plan, enabling rapid identification of high-traffic and low-traffic zones.
The most commonly used visualisation in WiFi analytics dashboards. IT teams and operations directors use heat maps to communicate spatial insights to non-technical stakeholders and to inform decisions about store layout, staffing allocation, and facility management.
Études de cas
A UK fashion retailer with 12 stores notices that conversion rates are declining despite stable footfall. Store managers report that customers seem to browse the front of the store but rarely reach the back sections where higher-margin products are displayed. How should the IT and operations teams deploy WiFi analytics to diagnose and address this problem?
Deploy Purple's WiFi Analytics platform across all 12 stores, ensuring sufficient AP density (minimum 3 APs per zone) to support zone-level location tracking. Configure floor plan maps for each store within the analytics platform, defining zones that correspond to product categories and store sections. Run a 4-week baseline data collection period to establish footfall heat maps, dwell times by zone, and customer journey paths. Analyse the data to identify the specific point in the store layout where customer flow drops off. Cross-reference with point-of-sale data to identify which zones correlate with higher transaction values. Use the insights to inform a store layout redesign — repositioning high-margin categories into high-traffic zones identified by the heat maps. Implement a captive portal offering a loyalty discount to incentivise authentication, enabling demographic segmentation of the analytics data. Re-measure after the layout change to quantify the uplift.
An NHS trust is experiencing patient satisfaction issues related to waiting times in its outpatient departments. The operations director wants to use WiFi analytics to gain real-time visibility into patient flow and queue lengths. What are the technical and compliance considerations for this deployment?
Deploy WiFi analytics across the outpatient department, mapping waiting areas, consultation rooms, and corridors as distinct zones. Configure real-time alerting within the analytics platform to trigger notifications to the operations team when queue lengths in specific waiting areas exceed defined thresholds (e.g., more than 15 devices detected in a waiting zone for more than 30 minutes). Integrate the analytics platform with the existing patient management system via API to correlate WiFi presence data with appointment schedules. For compliance, conduct a DPIA before deployment, as patient location data in a healthcare setting is particularly sensitive. Implement strict data anonymisation — ensure that WiFi analytics data cannot be linked back to individual patient records. Use presence analytics (unassociated probe requests) for queue monitoring rather than authenticated analytics, minimising the personal data collected. Provide clear signage in waiting areas informing patients that WiFi analytics are in use for service improvement purposes.
Analyse de scénario
Q1. A 500-bed hospital trust wants to deploy WiFi analytics to monitor patient flow through its A&E department. The CISO raises concerns about GDPR compliance, specifically whether location tracking of patients constitutes processing of sensitive personal data. How do you structure the deployment to achieve the operational objective while satisfying the compliance requirement?
💡 Astuce :Consider whether the operational objective (queue monitoring) requires authenticated personal data, or whether anonymous presence analytics would be sufficient. Think about the distinction between presence analytics and authenticated analytics in the context of GDPR's data minimisation principle.
Afficher l'approche recommandée
Structure the deployment using presence analytics only for queue monitoring — unassociated probe request data provides sufficient signal for counting devices in waiting zones and measuring dwell times without requiring authentication or the collection of personal data. Implement strict data anonymisation: hash all MAC addresses before storage, apply a rolling anonymisation window of no more than 24 hours, and ensure the analytics platform cannot link WiFi data to patient records. Provide clear signage in the A&E department informing visitors that anonymous WiFi analytics are in use for service improvement. Conduct a DPIA documenting the data minimisation approach and the technical controls in place. This approach achieves the operational objective — real-time queue visibility and dwell time monitoring — while processing no personal data, thereby avoiding the GDPR compliance risk entirely.
Q2. A retail chain deploys WiFi analytics across 20 stores and finds that the footfall counts from the analytics platform are consistently 40% higher than manual door counter readings. What are the most likely causes and how do you diagnose and resolve the discrepancy?
💡 Astuce :Think about the sources of overcounting in presence analytics. Consider the impact of MAC randomisation, the behaviour of devices in adjacent areas (car parks, neighbouring stores), and the configuration of the detection zone boundaries.
Afficher l'approche recommandée
The most likely causes of overcounting are: (1) MAC randomisation causing individual devices to be counted multiple times as their MAC address changes; (2) probe requests from devices outside the store perimeter being detected by APs near windows or entrances — devices in the car park or on the street are being included in the count; (3) staff devices being included in the footfall count. Diagnose by comparing the analytics data against manual counts at specific time windows and correlating with known variables (e.g., is the discrepancy consistent across all stores or concentrated in stores with large car parks?). Resolution: configure detection zone boundaries to exclude the perimeter area, implement a minimum dwell time threshold (e.g., only count devices detected for more than 2 minutes) to filter out pass-by devices, exclude known staff MAC addresses or implement a staff device exclusion list, and use authenticated session data as a cross-validation source. Accept that presence analytics will always produce higher counts than door counters due to multi-device households and use the data for trend analysis rather than absolute counts.
Q3. A stadium operator wants to use WiFi analytics to improve the fan experience during match days, specifically to reduce queuing at concession stands and to enable targeted push notifications to fans in specific zones. The IT team has a Wi-Fi 6 network with 200 APs deployed across the venue. What additional configuration and integrations are required to deliver both use cases?
💡 Astuce :Consider the different data requirements for the two use cases: queue monitoring is an operational use case that can use presence analytics, while targeted push notifications require authenticated user profiles with location data and a notification delivery mechanism.
Afficher l'approche recommandée
For queue monitoring at concession stands: configure zone-level presence analytics for each concession area, set up real-time alerting when device counts in a zone exceed a defined threshold, and integrate the alerts with the stadium operations centre dashboard. This use case can be delivered using presence analytics alone and does not require user authentication. For targeted push notifications: deploy a captive portal on the stadium WiFi with a compelling authentication offer (e.g., match day loyalty points, exclusive content). Integrate the WiFi analytics platform with the stadium's CRM and mobile app via API. Configure zone-level location tracking to identify which fans are in which areas of the stadium. Use the analytics platform's segmentation capability to create audience segments based on location (e.g., fans in the East Stand concourse) and trigger push notifications via the mobile app integration. Ensure the captive portal consent capture explicitly covers location-based marketing communications, and provide fans with a clear opt-out mechanism. Test the notification latency — from zone detection to notification delivery — to ensure it is under 60 seconds for time-sensitive offers.
