Medición del ROI del WiFi de invitados: un marco de referencia para CMOs
Esta guía técnica exhaustiva proporciona un marco robusto para calcular el retorno de la inversión de las implementaciones de WiFi para invitados empresariales. Detalla las metodologías para atribuir ingresos a través de la captura de datos, la automatización de marketing, el aumento del tiempo de permanencia y la retención de clientes, ofreciendo puntos de referencia accionables para líderes de TI y marketing.
Escucha esta guía
Ver transcripción del podcast

Resumen ejecutivo
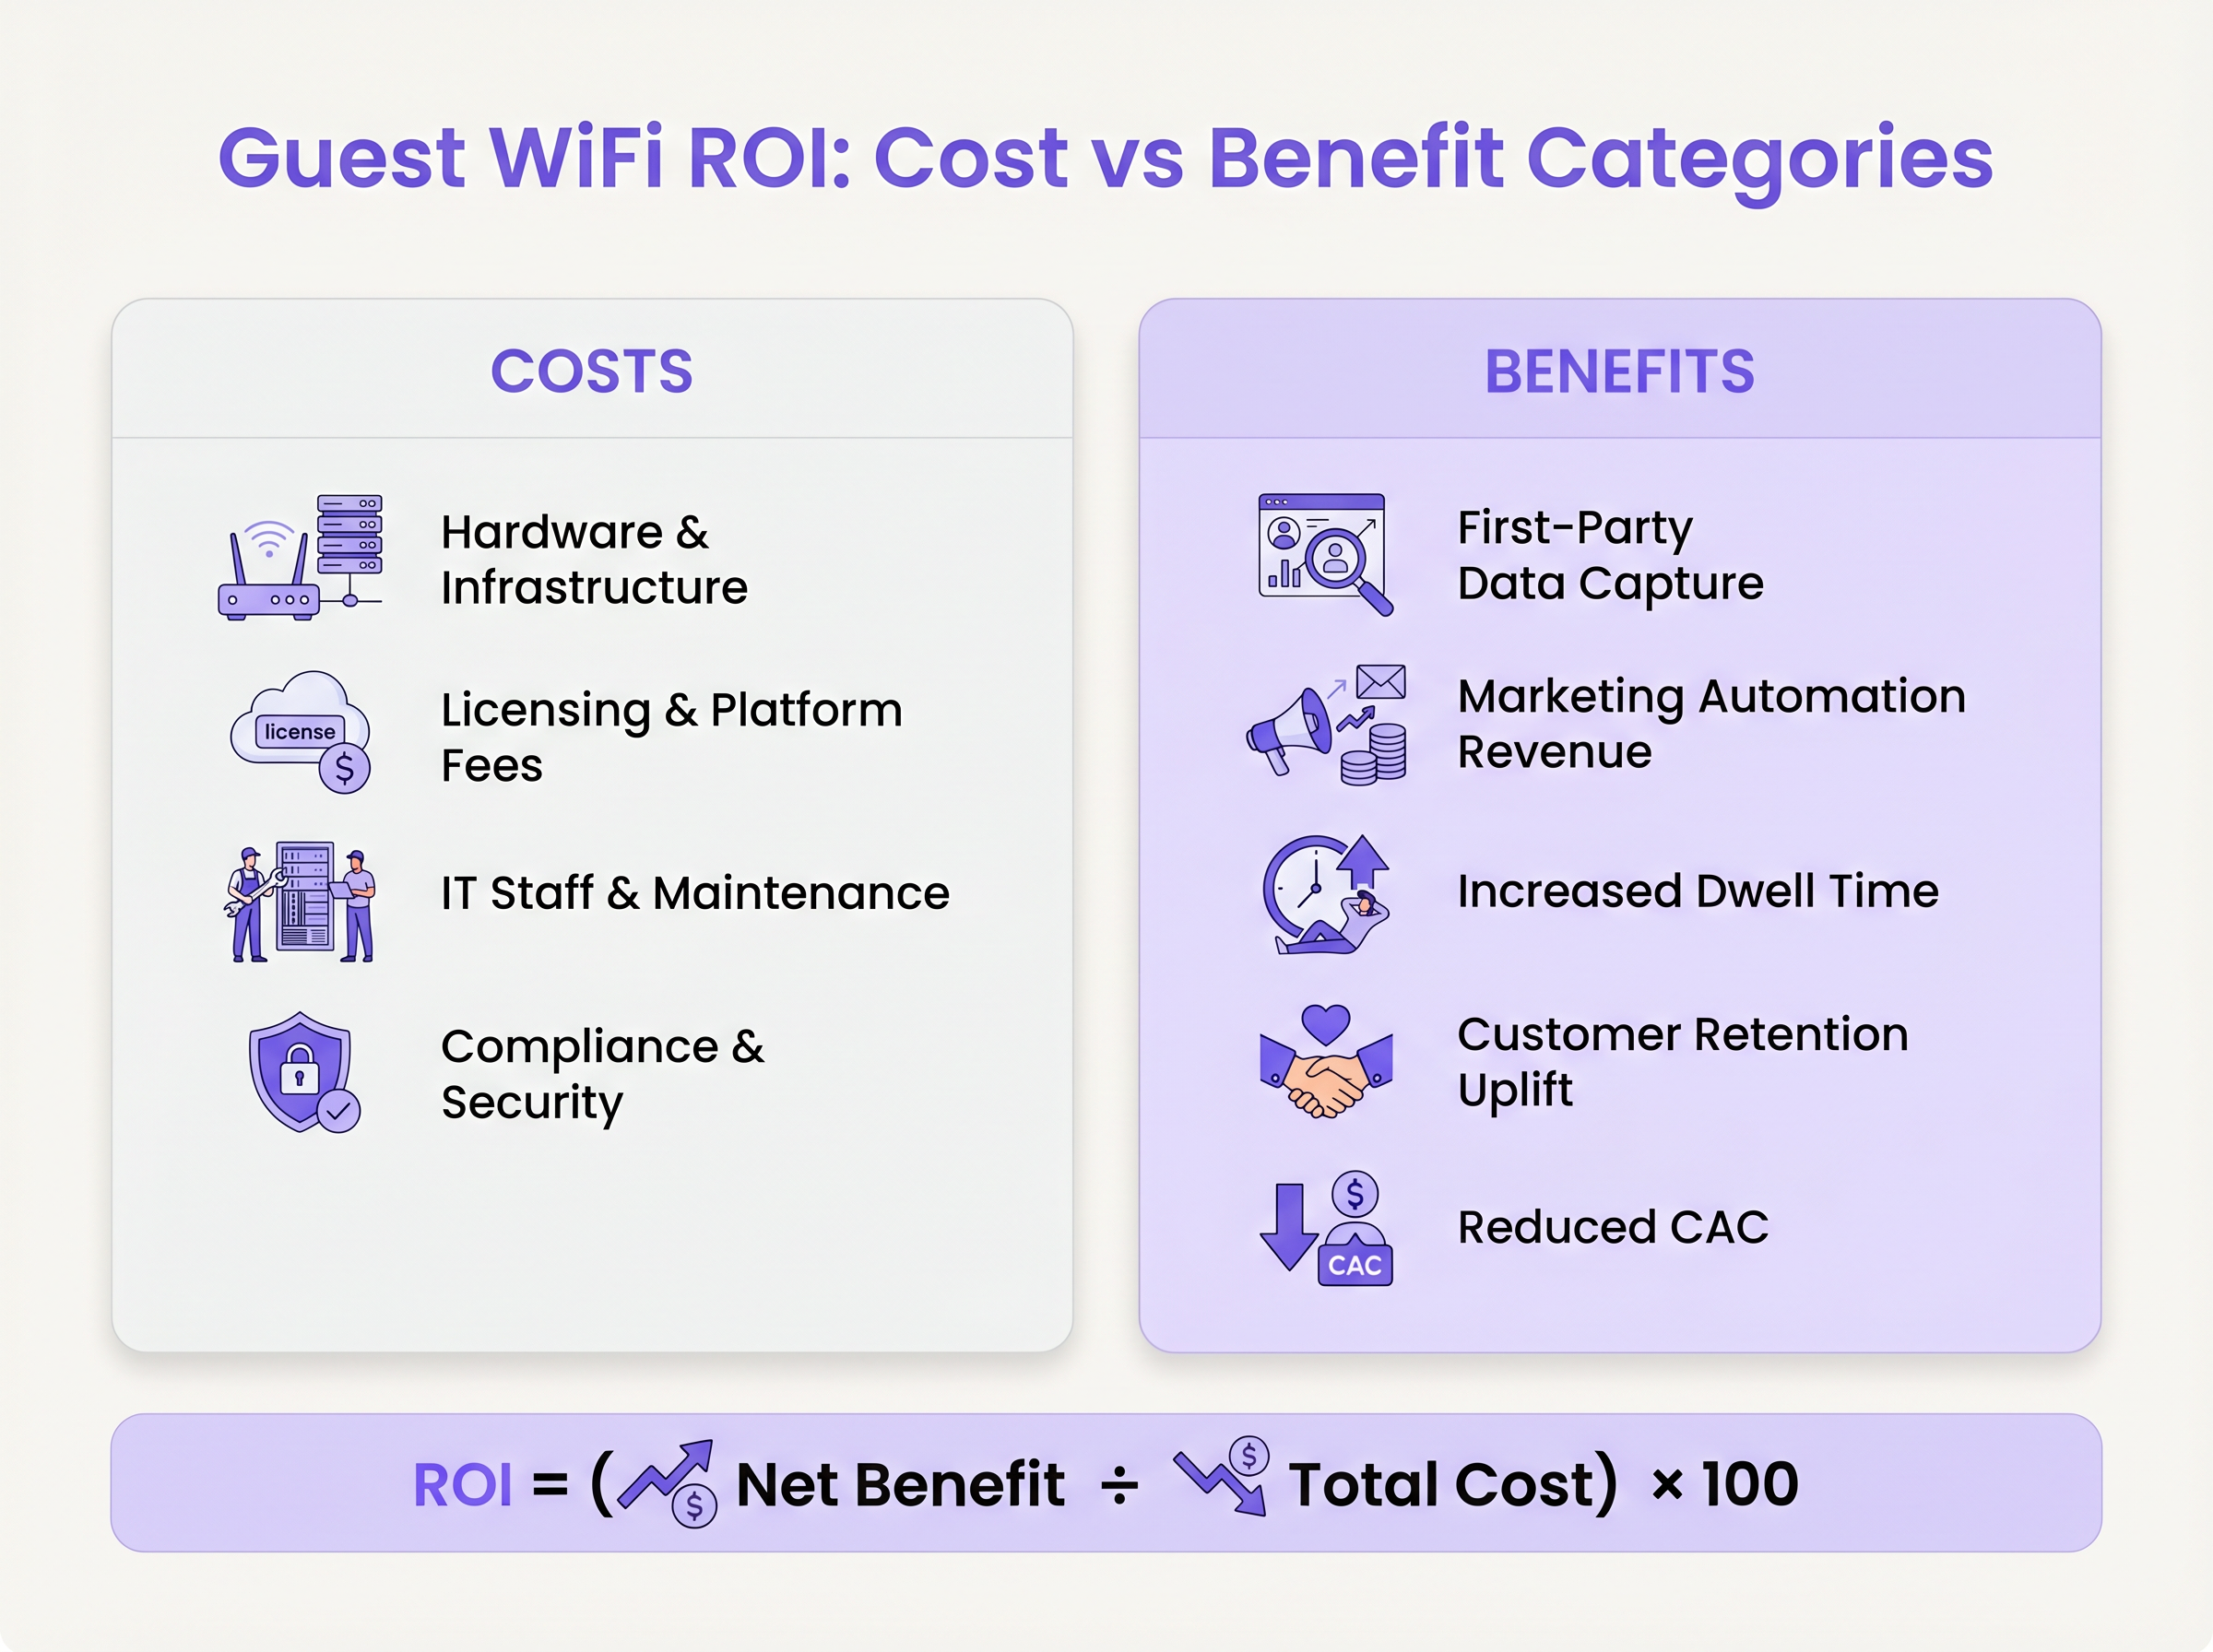
Para los espacios físicos modernos —desde amplias tiendas minoristas y estadios de alta densidad hasta grupos hoteleros multipropiedad—, el WiFi para invitados ya no es solo un costo de servicio básico. Es un motor crítico de adquisición de datos y engagement. Sin embargo, calcular el retorno de inversión (ROI) de estas implementaciones suele ser un desafío porque su valor se distribuye en múltiples canales operativos y de marketing. Esta guía proporciona a los Directores de Marketing (CMO) y a sus homólogos técnicos un marco de trabajo definitivo para medir, atribuir y maximizar el ROI de las inversiones en WiFi para invitados. Al desglosar el impacto financiero en cuatro pilares fundamentales (captura de datos de primera mano [first-party data], ingresos por automatización de marketing, aumento del tiempo de permanencia y retención de clientes), ofrecemos un enfoque técnicamente fundamentado y neutral respecto al proveedor para construir un caso de negocio sólido.
Análisis técnico profundo: Los cuatro pilares del ROI del WiFi para invitados
Comprender el ROI de las implementaciones de WiFi para invitados requiere ir más allá de la contabilidad tradicional de la red como centro de costos. Los enfoques modernos tratan el extremo de la red (network edge) como un activo generador de ingresos. Esta arquitectura se basa en una integración fluida entre los controladores de LAN inalámbrica, los servidores de autenticación de Portal Cautivo (que a menudo utilizan RADIUS/802.1X para una incorporación segura) y las plataformas de gestión de relaciones con el cliente (CRM) o de automatización de marketing de la organización.
Pilar 1: Captura de datos de primera mano (First-Party Data)
El retorno más inmediato y cuantificable de una plataforma de WiFi para invitados es la adquisición de datos de primera mano. Cuando un usuario se conecta a la red a través de un Portal Cautivo, proporciona información de contacto verificable —normalmente una dirección de correo electrónico o un número de teléfono móvil— a cambio de acceso a internet. Esta transacción se rige por estrictos marcos de cumplimiento, en particular el Reglamento General de Protección de Datos (GDPR) en Europa y la Ley de Privacidad del Consumidor de California (CCPA) en los EE. UU.
El mecanismo técnico implica un enfoque de entorno cerrado (walled garden) donde el tráfico no autenticado se intercepta y se redirige a un portal seguro y personalizado con la marca. Tras una autenticación exitosa (por ejemplo, mediante verificación por SMS o correo electrónico), la dirección MAC del usuario se vincula a su perfil de identidad. El cálculo del ROI aquí es sencillo: es el ahorro de costos al evitar la adquisición de un contacto nuevo y verificado a través de canales de medios pagados. Para profundizar en los métodos de autenticación, consulte nuestra guía sobre Verificación por SMS vs. correo electrónico para WiFi para invitados: cuál elegir .
Pilar 2: Atribución de ingresos por automatización de marketing
Capturar datos es solo el primer paso; el valor posterior se obtiene a través de la automatización de marketing dirigida. Una vez que se crea el perfil de usuario, la plataforma de WiFi envía estos datos al CRM a través de APIs o webhooks. Esta integración es fundamental para atribuir los ingresos posteriores a la conexión WiFi inicial.
La implementación técnica requiere un etiquetado y seguimiento sólidos. Las URL de redireccionamiento posteriores a la conexión deben incluir parámetros UTM para realizar un seguimiento de las conversiones inmediatas. Además, el CRM debe etiquetar la fuente del contacto como "WiFi en el establecimiento". Cuando se ejecutan campañas de marketing dirigidas a estos segmentos, los ingresos resultantes se pueden atribuir directamente a la infraestructura de WiFi. Este informe de ciclo cerrado (closed-loop) es esencial para demostrar el valor de la plataforma al resto de la empresa.
Pilar 3: Análisis de tiempo de permanencia y afluencia
Más allá de la captura explícita de datos, la infraestructura de red genera valor pasivo a través de WiFi Analytics . Al analizar las solicitudes de sondeo (probe requests) y los eventos de asociación de los dispositivos móviles, el sistema puede calcular con precisión la afluencia, el tiempo de permanencia y los patrones de movimiento en todo el establecimiento.
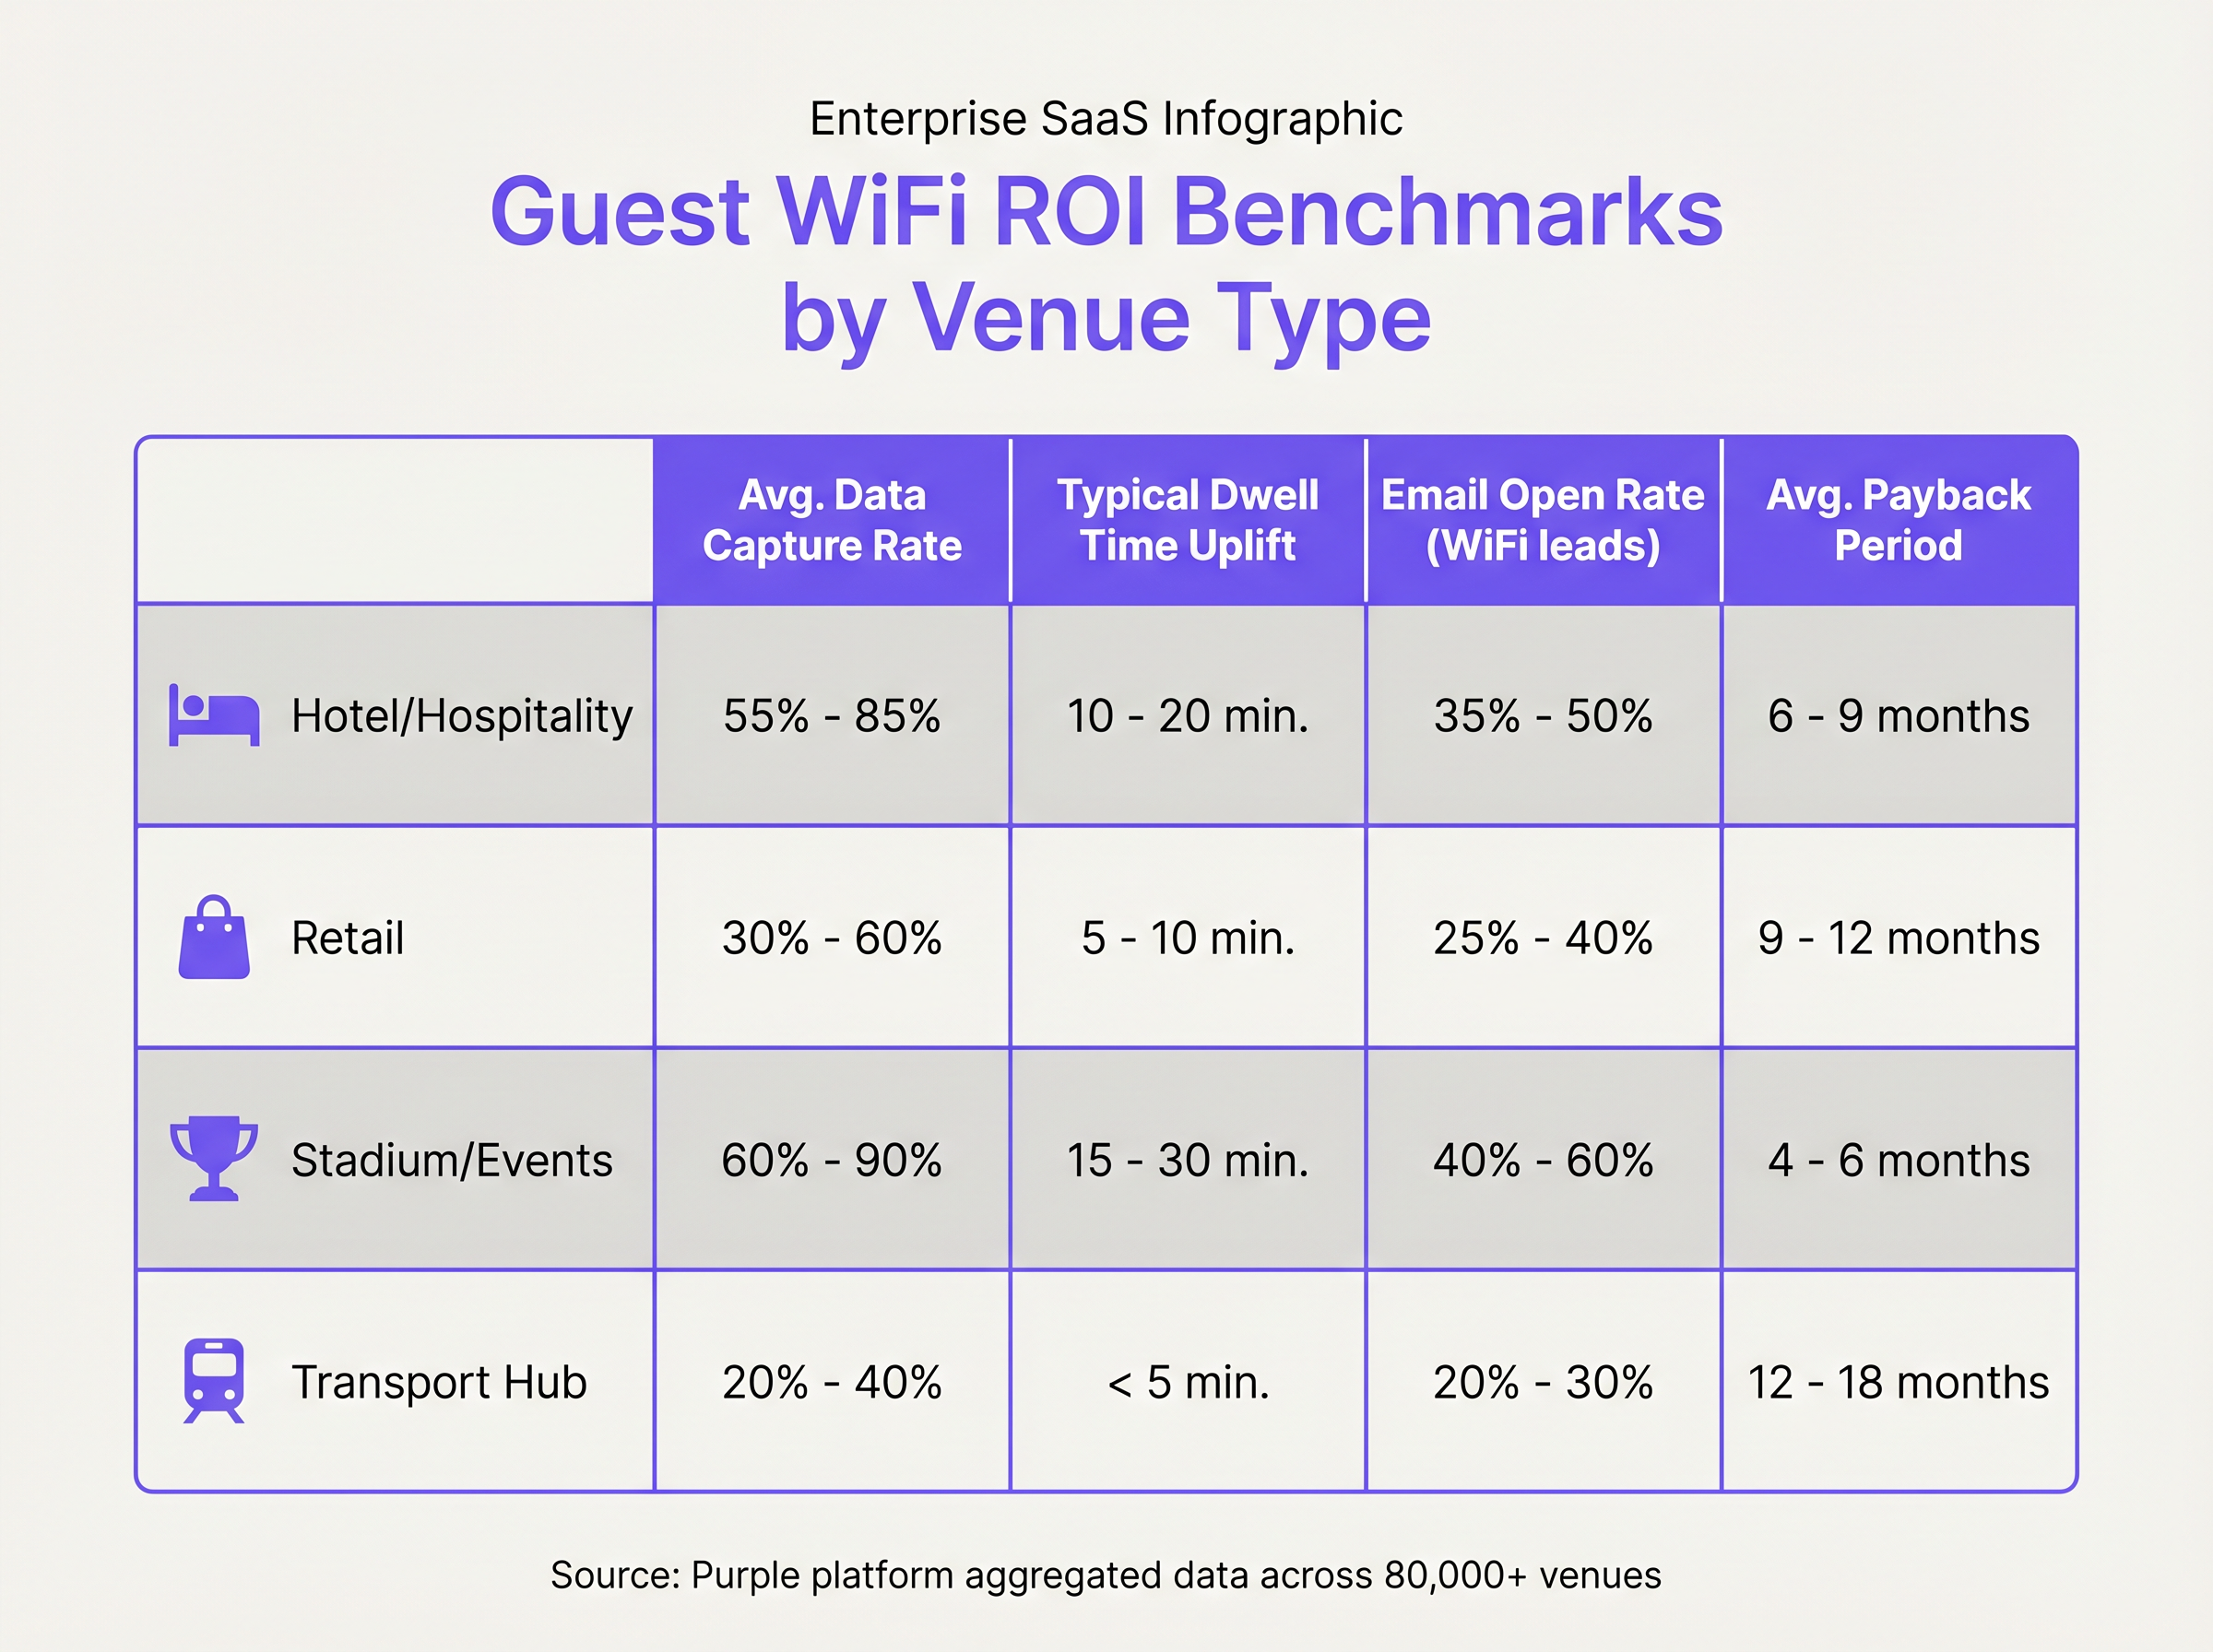
Esta inteligencia espacial es muy valiosa para la optimización operativa. En entornos de Retail (comercio minorista), comprender la correlación entre los diseños de tienda específicos y el aumento del tiempo de permanencia puede informar directamente las estrategias de merchandising. Para los centros de Transporte , ayuda en la gestión de multitudes y en la optimización de las valoraciones de arrendamiento de los inquilinos en función de los flujos de tráfico de pasajeros verificados. El ROI se calcula correlacionando estas mejoras operativas con los aumentos correspondientes en el volumen de transacciones o la eficiencia operativa.
Pilar 4: Retención de clientes y valor de vida del cliente
El último pilar se centra en el impacto a largo plazo del WiFi para invitados en la lealtad del cliente. Al proporcionar una experiencia de conexión fluida y de alta calidad —a menudo facilitada por tecnologías como Passpoint/OpenRoaming que permiten una reconexión automática y segura—, los establecimientos pueden mejorar significativamente la experiencia del invitado.
El modelo financiero para este pilar se basa en calcular la tasa de conversión de los usuarios de WiFi en miembros formales del programa de lealtad. El valor de vida del cliente (CLV) incremental de estos miembros en comparación con los no miembros representa el valor de retención generado por la red.
Guía de implementación: Cómo construir un modelo de ROI
Para construir un modelo de ROI defendible, las organizaciones deben registrar con precisión tanto el Costo Total de Propiedad (TCO) como los flujos de beneficios proyectados.
- Definir el TCO: Esto incluye los gastos de capital (CapEx) para hardware (puntos de acceso, switches, cableado), los gastos operativos (OpEx) para licencias de plataformas y los recursos internos de TI necesarios para la implementación y el mantenimiento continuo.
- Cuantificar el valor de la captura de datos: Multiplique el número proyectado de nuevos contactos verificados capturados mensualmente por el Costo por Adquisición (CPA) promedio de su organización para clientes potenciales (leads) de calidad similar.
- Modelar los ingresos de marketing: Estime la tasa de conversión y el valor promedio de los pedidos para las campañas de marketing dirigidas a segmentos provenientes de WiFi.
- Estimar el aumento del tiempo de permanencia: Utilice puntos de referencia (benchmarks) de la industria o datos piloto para proyectar el impacto en los ingresos del aumento del tiempo de permanencia (por ejemplo, un aumento del 5% en el tiempo de permanencia que conduce a un aumento del 2% en el tamaño promedio del ticket de compra).
- Calcular el aumento de la retención: Estime el número de usuarios que se convierten al programa de lealtad y multiplíquelo por el CLV incremental.
Mejores prácticas y estándares de la industria
Las implementaciones exitosas se adhieren a estrictos estándares técnicos y operativos.
- Seguridad y cumplimiento: Asegúrese de que el Portal Cautivo y las bases de datos subyacentes cumplan con PCI DSS (si manejan indirectamente datos de pago) y GDPR. Implemente políticas sólidas de retención de datos, eliminando automáticamente los perfiles inactivos de acuerdo con las regulaciones locales.
- Diseño de red: Para establecimientos de alta capacidad, una planificación de RF adecuada no es negociable. Para garantizar que la infraestructura pueda soportar las cargas de usuarios concurrentes proyectadas sin degradar el rendimiento, consulte nuestra guía completa sobre Diseño de WiFi de alta densidad: mejores prácticas para estadios y arenas .
- Autenticación fluida: Minimice la fricción en el proceso de incorporación. Considere implementar métodos de autenticación basados en perfiles para facilitar la reconexión automática en visitas posteriores, mejorando la experiencia del usuario y aumentando las tasas de captura de datos.
- Arquitectura API-First: Seleccione plataformas con APIs sólidas y bien documentadas para garantizar un flujo de datos fluido entre el motor de WiFi analytics y el ecosistema tecnológico de marketing en general.
Resolución de problemas y mitigación de riesgos
Incluso las implementaciones meticulosamente planificadas pueden enfrentar desafíos que reduzcan el ROI.
- Bajas tasas de captura de datos: Esto a menudo se debe a Portales Cautivos mal diseñados o flujos de autenticación demasiado complejos. Mitigación: Realice pruebas A/B de los diseños de los portales, simplifique los requisitos de entrada de datos y articule claramente el intercambio de valor (por ejemplo, "Inicie sesión para obtener un 10% de descuento en su próxima compra").
- Fallas de integración: Si la conexión API entre la plataforma de WiFi y el CRM falla, la cadena de atribución se rompe. Mitigación: Implemente alertas automatizadas para tiempos de espera de API o fallas en la sincronización de datos. Audite regularmente los flujos de datos para garantizar su integridad.
- Bajo rendimiento de la red: Si la infraestructura subyacente es inadecuada, los usuarios abandonarán el proceso de conexión. Mitigación: Realice estudios de sitio (site surveys) y ejercicios de planificación de capacidad con regularidad, especialmente antes de eventos importantes o temporadas altas. Para obtener información sobre las arquitecturas de red modernas que admiten estas implementaciones, consulte Los beneficios principales de SD-WAN para las empresas modernas .
ROI e impacto comercial: Medir el éxito
La medida definitiva del éxito es un ROI positivo y demostrable. Una estrategia de WiFi para invitados bien ejecutada debería transformar la red de un centro de costos a un centro de ganancias.
Al realizar un seguimiento meticuloso de las métricas descritas en este marco de trabajo (Costo por Adquisición, atribución de marketing, impacto del tiempo de permanencia y conversión de lealtad), los líderes de TI y marketing pueden construir una narrativa convincente y basada en datos para justificar la inversión continua en la infraestructura digital del establecimiento. La integración de tecnologías de Sensores y Wayfinding puede enriquecer aún más este conjunto de datos, proporcionando una comprensión aún más detallada del comportamiento de los visitantes e impulsando eficiencias operativas adicionales.
> [!TIP] > Para simplificar el caso de negocio para su equipo de liderazgo, utilice nuestra Calculadora de ROI de WiFi Marketing para estimar los ingresos de las campañas y el valor de la base de datos en función del tamaño de su establecimiento.
Definiciones clave
Captive Portal
A web page that the user of a public-access network is obliged to view and interact with before access is granted. It is the primary mechanism for first-party data capture.
Critical for IT teams to configure securely, ensuring seamless authentication while complying with data privacy regulations.
First-Party Data
Information a company collects directly from its customers and owns entirely, such as email addresses captured via a WiFi login.
Highly valuable for marketing teams as it reduces reliance on third-party cookies and paid advertising channels.
Probe Request
A frame sent by a client device (like a smartphone) to discover available 802.11 networks within its proximity.
Used by WiFi analytics engines to track footfall and device movement, even if the device does not fully authenticate to the network.
MAC Address Randomization
A privacy feature in modern mobile operating systems that periodically changes the device's MAC address to prevent persistent tracking.
IT teams must account for this when designing analytics solutions, often requiring authenticated sessions (profile-based authentication) to accurately track returning visitors over time.
Total Cost of Ownership (TCO)
The comprehensive assessment of all costs associated with deploying and maintaining the WiFi infrastructure, including CapEx (hardware) and OpEx (licensing, support).
Essential for finance and IT leaders to calculate accurately to determine the true ROI of the platform.
Customer Lifetime Value (CLV)
A prediction of the net profit attributed to the entire future relationship with a customer.
Used to model the long-term ROI of converting WiFi guests into loyalty program members.
UTM Parameters
Tags added to a URL that allow marketing teams to track the effectiveness of campaigns and identify the source of traffic.
Crucial for tracking post-connection redirects and attributing downstream revenue to the initial WiFi login event.
Passpoint / OpenRoaming
Protocols that enable seamless, secure, and automatic roaming between different Wi-Fi networks without requiring the user to repeatedly log in via a captive portal.
Improves the guest experience and increases connection rates, driving higher data capture volumes over time.
Ejemplos resueltos
A 200-room hotel chain is evaluating a guest WiFi platform upgrade. They currently spend £35 to acquire a new email lead via paid social. The proposed WiFi platform costs £2 per room per month in licensing. They expect 150 unique guests per day across the property, with a projected 60% captive portal completion rate. Calculate the monthly data capture value and the simple ROI based solely on this pillar (excluding hardware costs).
- Calculate monthly connections: 150 guests/day * 30 days = 4,500 total connections/month.
- Calculate successful captures: 4,500 * 0.60 = 2,700 verified emails/month.
- Calculate Data Capture Value: 2,700 emails * £35 CPA = £94,500 value generated/month.
- Calculate Platform Cost: 200 rooms * £2 = £400/month.
- Calculate ROI: ((£94,500 - £400) / £400) * 100 = 23,525%.
A large retail mall implements WiFi analytics to track dwell time. Baseline data shows an average dwell time of 45 minutes, with an average spend of £60 per visitor. Following a reconfiguration of the food court seating and the introduction of targeted push notifications via the captive portal, average dwell time increases to 55 minutes. Industry benchmarks suggest a 10% increase in dwell time yields a 5% increase in spend. Calculate the projected new average spend per visitor.
- Calculate the percentage increase in dwell time: ((55 - 45) / 45) * 100 = 22.2% increase.
- Apply the benchmark multiplier: If a 10% dwell increase = 5% spend increase, then a 22.2% dwell increase = (22.2 / 10) * 5 = 11.1% projected spend increase.
- Calculate new average spend: £60 * 1.111 = £66.66 per visitor.
Preguntas de práctica
Q1. A stadium operations director is evaluating the ROI of a major network upgrade. The primary goal is to increase food and beverage (F&B) sales during halftime. The IT team proposes a high-density deployment with a sophisticated captive portal, while the marketing team wants to ensure seamless CRM integration. What is the most critical technical dependency to ensure the ROI can be accurately measured?
Sugerencia: Consider how the initial connection event must be linked to the final purchase event.
Ver respuesta modelo
The most critical dependency is establishing a closed-loop attribution system. This requires the WiFi platform to successfully push the captured user identity (e.g., email or phone number) via API to the CRM, and for the CRM to be integrated with the Point of Sale (POS) system. Without this end-to-end integration, the marketing team cannot definitively prove that a promotional offer sent via the WiFi platform resulted in a specific F&B transaction at the concession stand.
Q2. A retail chain is experiencing a high drop-off rate at the captive portal. Users connect to the SSID but fail to complete the registration form, resulting in poor data capture ROI. The current portal requires first name, last name, email, date of birth, and postal code. What is the recommended architectural or operational change?
Sugerencia: Evaluate the balance between the value of the data requested and the friction introduced to the user.
Ver respuesta modelo
The recommended approach is to reduce the friction in the onboarding process by simplifying the data requirements. The IT and marketing teams should implement progressive profiling. Initially, require only a single, high-value identifier (such as an email address or mobile number via SMS verification) to grant access. Subsequent data points (like date of birth or postal code) can be collected later through targeted marketing campaigns or upon subsequent visits, thereby significantly increasing the initial completion rate and overall data capture volume.
Q3. When building a Total Cost of Ownership (TCO) model for a multi-site hospitality deployment, the finance partner questions the inclusion of GDPR compliance auditing costs as a line item against the WiFi project. How should the IT architect justify this inclusion?
Sugerencia: Consider the legal basis for processing the data captured by the network.
Ver respuesta modelo
The IT architect must explain that the guest WiFi platform acts as a primary data controller/processor. Because the system is actively capturing Personally Identifiable Information (PII) to generate marketing ROI, it fundamentally alters the venue's risk profile compared to providing an open, unauthenticated network. Therefore, the costs associated with ensuring the captive portal's consent mechanisms, data retention policies, and subject access request workflows are compliant with GDPR are direct, unavoidable operational expenses (OpEx) of running the platform as a revenue-generating asset.
Continúe leyendo esta serie
Privacidad desde el Diseño: Anonimización de Datos WiFi para el Cumplimiento del GDPR
Esta guía autorizada detalla la arquitectura técnica y las estrategias de implementación para anonimizar datos WiFi y asegurar el cumplimiento del GDPR. Proporciona a los líderes de TI y arquitectos de red marcos de trabajo accionables para equilibrar análisis robustos de recintos con estrictos requisitos de privacidad de datos.
Heatmapping vs Presence Analytics: Diferencias Técnicas
Esta guía técnica autorizada detalla las diferencias arquitectónicas y operativas críticas entre el WiFi heatmapping y el presence analytics para operadores de recintos empresariales. Proporciona a los líderes de TI, arquitectos de red y directores de operaciones marcos de implementación accionables, escenarios de implementación reales y mejores prácticas neutrales al proveedor para extraer el máximo ROI de su infraestructura inalámbrica existente.
Cómo calcular el tiempo de permanencia utilizando análisis de ubicación WiFi
Esta guía ofrece una referencia técnica completa para calcular el tiempo de permanencia WiFi utilizando análisis de ubicación WiFi, cubriendo la arquitectura completa desde la captura de solicitudes de sondeo 802.11, pasando por la trilateración basada en RSSI, hasta el análisis de zonas geocercadas. Está diseñada para gerentes de TI, arquitectos de redes y directores de operaciones de recintos que necesitan implementar inteligencia de ubicación precisa y escalable en entornos minoristas, hoteleros, de atención médica y del sector público. Los lectores obtendrán orientación de implementación práctica, estudios de casos reales y un marco claro para traducir datos espaciales brutos en resultados comerciales medibles.