ग्राहक अनुभव धोरण कसे तयार करावे
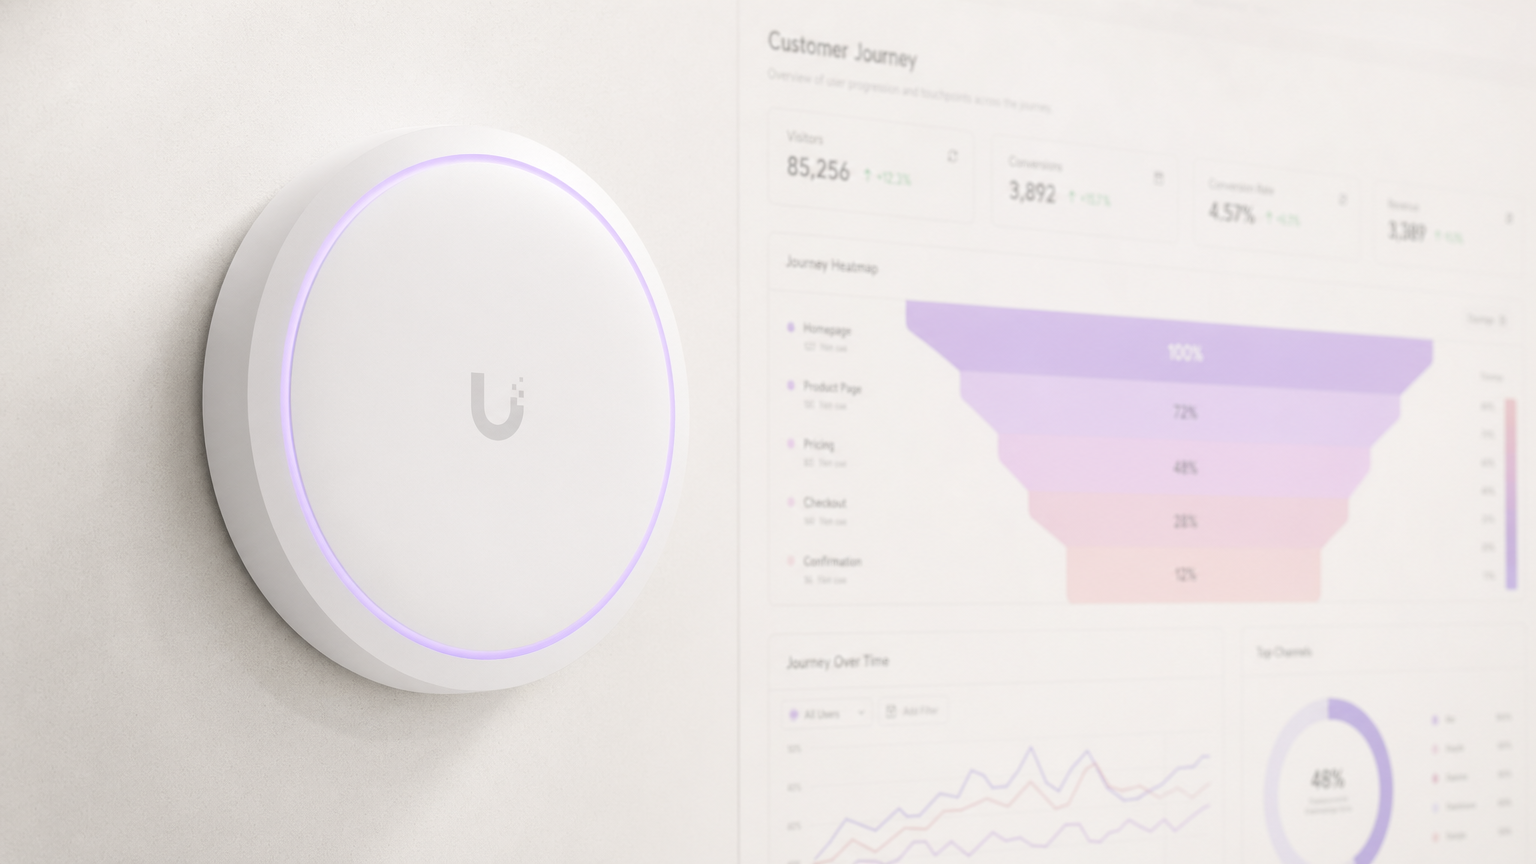
हे तांत्रिक संदर्भ मार्गदर्शक IT नेते, नेटवर्क आर्किटेक्ट आणि ठिकाण संचालन संचालकांसाठी डेटा-आधारित ग्राहक अनुभव धोरण कसे तयार करावे याबद्दल एक व्यावहारिक चौकट प्रदान करते. यात गेस्ट WiFi प्रमाणीकरण आणि Captive Portal डिझाइनपासून ते स्थानिक विश्लेषण, CRM एकीकरण आणि मोजता येण्याजोगा ROI पर्यंत संपूर्ण आर्किटेक्चर समाविष्ट आहे — आदरातिथ्य, किरकोळ आणि सार्वजनिक क्षेत्रातील वातावरणातून घेतलेल्या ठोस अंमलबजावणीच्या परिस्थितीसह. Purple चे गेस्ट WiFi आणि विश्लेषण प्लॅटफॉर्म सक्षम पायाभूत सुविधा स्तर म्हणून सर्वत्र स्थानबद्ध आहे.
🎧 हे मार्गदर्शक ऐका
ट्रान्सक्रिप्ट पहा
कार्यकारी सारांश
एंटरप्राइझ IT नेते आणि ठिकाण संचालन संचालकांसाठी, ग्राहक अनुभव (CX) धोरण तयार करणे हे आता केवळ मार्केटिंगचे कार्यक्षेत्र राहिलेले नाही. किरकोळ साखळ्यांपासून ते मोठ्या स्टेडियमपर्यंतची भौतिक ठिकाणे अधिकाधिक डिजिटलाइज्ड होत असल्याने, अंतर्निहित नेटवर्क पायाभूत सुविधा ग्राहक डेटा मिळवण्यासाठी प्राथमिक इंजिन आहे. हे मार्गदर्शक विद्यमान वायरलेस पायाभूत सुविधांचा लाभ घेऊन कृतीयोग्य बुद्धिमत्ता मिळवण्यासाठी, सहभाग स्वयंचलित करण्यासाठी आणि मोजता येण्याजोगा गुंतवणुकीवरील परतावा देण्यासाठी CX धोरण कसे तयार करावे हे सविस्तरपणे सांगते.
एक मजबूत Guest WiFi सोल्यूशन तैनात करून, संस्था एक परिचालन खर्च केंद्र (operational cost centre) एका धोरणात्मक मालमत्तेत रूपांतरित करू शकतात. एक यशस्वी CX धोरण अखंड डेटा संकलन, कठोर अनुपालन (GDPR आणि PCI DSS सह) आणि विद्यमान CRM व मार्केटिंग ऑटोमेशन प्लॅटफॉर्मसह एकीकरणावर अवलंबून असते. हे दस्तऐवज Hospitality , Retail , Healthcare आणि Transport वातावरणात डेटा-आधारित ग्राहक अनुभव आर्किटेक्चर डिझाइन, अंमलबजावणी आणि स्केलिंगसाठी विक्रेता-निरपेक्ष, तांत्रिक चौकट प्रदान करते.
तांत्रिक सखोल अभ्यास: CX डेटा फाउंडेशनची रचना
भौतिक ठिकाणातील कोणत्याही आधुनिक CX धोरणाचा पाया म्हणजे वापरकर्त्यांना त्यांच्या भेटीच्या जीवनचक्रात विश्वासार्हपणे ओळखण्याची आणि त्यांचा मागोवा घेण्याची क्षमता. यासाठी एक मजबूत नेटवर्क आर्किटेक्चर आवश्यक आहे जे उच्च समवर्ती डिव्हाइस संख्या हाताळू शकेल आणि प्रमाणीकरण रहदारी Captive Portal किंवा ओळख प्रदात्याकडे अखंडपणे रूट करू शकेल.
प्रमाणीकरण आणि डेटा कॅप्चर यंत्रणा
जेव्हा वापरकर्ता गेस्ट SSID शी संबंधित होतो, तेव्हा ॲक्सेस पॉइंट (AP) किंवा वायरलेस LAN कंट्रोलर (WLC) HTTP/HTTPS विनंती अडवतो आणि Captive Portal कडे पुनर्निर्देशित करतो. हे पोर्टल प्राथमिक डेटा इनजेस्टेशन पॉइंट म्हणून कार्य करते — अनामिक अभ्यागत आणि ओळखलेल्या ग्राहकादरम्यानची डिजिटल मर्यादा.
प्रमाणीकरण, अधिकृतता आणि लेखा (AAA) साठी मानक उपयोजन मॉडेल्स RADIUS (रिमोट ऑथेंटिकेशन डायल-इन यूजर सर्व्हिस) वापरतात. Purple च्या WiFi Analytics सारख्या प्लॅटफॉर्मसह एकत्रित करताना, Captive Portal नेटवर्क ॲक्सेस RADIUS ॲक्सेस-ॲक्सेप्ट संदेशाद्वारे मंजूर करण्यापूर्वी विशिष्ट वापरकर्ता विशेषता — ईमेल पत्ता, लोकसंख्याशास्त्रीय डेटा किंवा सोशल लॉगिन टोकन — विनंती करतो. डेटा एकाच वेळी ॲनालिटिक्स प्लॅटफॉर्मच्या ग्राहक डेटाबेसमध्ये आणि API वेबहुकद्वारे कनेक्ट केलेल्या CRM मध्ये लिहिला जातो.
प्रगत उपयोजनांसाठी, Passpoint (Hotspot 2.0) आणि OpenRoaming सारख्या तंत्रज्ञानामुळे IEEE 802.1X आणि WPA3 Enterprise एन्क्रिप्शन वापरून अखंड, सुरक्षित ऑनबोर्डिंग शक्य होते. Purple कनेक्ट परवान्याअंतर्गत OpenRoaming साठी विनामूल्य ओळख प्रदाता म्हणून कार्य करते, ज्यामुळे वारंवार Captive Portal परस्परसंवादाशिवाय स्वयंचलित प्रमाणीकरण सक्षम होते — परत येणाऱ्या अभ्यागतांसाठी सुरक्षित डेटा ॲट्रिब्यूशन राखताना घर्षण लक्षणीयरीत्या कमी होते.
स्थान विश्लेषण आणि वर्तणूक ट्रॅकिंग
प्रारंभिक प्रमाणीकरणापलीकडे, ठिकाणांमधील संपूर्ण ग्राहक प्रवास समजून घेण्यासाठी सतत स्थानिक विश्लेषण महत्त्वपूर्ण आहे. हे अनेक APs वर असंबद्ध प्रोब विनंत्या आणि संबंधित क्लायंट रहदारी या दोन्हीच्या Received Signal Strength Indicator (RSSI) चा मागोवा घेऊन साध्य केले जाते.
या सिग्नल्सचे त्रिकोणीकरण करून, नेटवर्क थांबण्याचा वेळ (dwell times) मोजते, उच्च-रहदारीचे झोन ओळखते आणि सामान्य अभ्यागत प्रवाह नमुने (flow patterns) नकाशावर दर्शवते. अधिक सूक्ष्म अचूकतेसाठी, उपयोजनांमध्ये Bluetooth Low Energy (BLE) बीकन्स किंवा Ultra-Wideband (UWB) सेन्सर्स समाकलित केले जाऊ शकतात, जसे की Indoor Positioning System: UWB, BLE, & WiFi Guide मध्ये तपशीलवार आहे. हा स्थानिक डेटा नंतर एकत्रित केला जातो आणि हीटमॅप्स व प्रवास प्रवाहांद्वारे (journey flows) दृश्यमान केला जातो, ज्यामुळे भौतिक मांडणी, कर्मचारी मॉडेल आणि ठिकाणांमधील मार्केटिंग प्लेसमेंट ऑप्टिमाइझ करण्यासाठी आवश्यक असलेले अनुभवजन्य पुरावे मिळतात.
अंमलबजावणी मार्गदर्शक: धोरण उपयोजित करणे
WiFi-आधारित CX धोरण अंमलात आणण्यासाठी IT, मार्केटिंग आणि ऑपरेशन्स यांच्यात क्रॉस-फंक्शनल संरेखन आवश्यक आहे. पायाभूत सुविधांची स्थिरता, डेटाची अखंडता आणि प्रत्येक टप्प्यावर मोजता येण्याजोगे परिणाम सुनिश्चित करण्यासाठी उपयोजनाने टप्प्याटप्प्याने दृष्टिकोन अवलंबला पाहिजे.
टप्पा 1: पायाभूत सुविधा मूल्यांकन आणि RF डिझाइन
विश्लेषण ओव्हरलेज (analytics overlays) उपयोजित करण्यापूर्वी, अंतर्निहित RF (Radio Frequency) वातावरणाने उच्च-घनतेच्या क्लायंट लोडला समर्थन दिले पाहिजे. क्लायंट डिव्हाइसवर पुरेसे सिग्नल कव्हरेज — सामान्यतः -65 dBm किंवा त्याहून चांगले — आणि पुरेशी AP क्षमता सुनिश्चित करण्यासाठी भविष्यसूचक आणि सक्रिय साइट सर्वेक्षण दोन्ही करा. ऑटोमोटिव्ह शोरूमसारख्या जटिल किंवा विशेष वातावरणासाठी, उपयोजन-विशिष्ट मार्गदर्शनासाठी Wi Fi in Auto: The Complete 2026 Enterprise Guide चा संदर्भ घ्या.
पुढे जाण्यापूर्वी सत्यापित करण्यासाठी प्रमुख पायाभूत सुविधा पॅरामीटर्स:
| Parameter | Minimum Threshold | Notes |
|---|---|---|
| सिग्नल कव्हरेज | -65 dBm | क्लायंट डिव्हाइसच्या उंचीवर |
| AP-ते-क्लायंट गुणोत्तर | 1:25 (दाट) | इव्हेंट ठिकाणांसाठी समायोजित करा |
| चॅनेल वापर | <60% | प्रति AP, 2.4 GHz आणि 5 GHz |
| Captive Portal विलंबता | <500ms | पुनर्निर्देशन प्रतिसाद वेळ |
| RADIUS राउंड-ट्रिप | <100ms | प्रमाणीकरण प्रतिसाद |
टप्पा 2: Captive Portal कॉन्फिगरेशन आणि CRM एकीकरण
Captive Portal ने डेटा संपादन आणि वापरकर्ता अनुभव यांच्यात संतुलन राखले पाहिजे. प्रोग्रेसिव्ह प्रोफाइलिंग लागू करा — पहिल्या भेटीदरम्यान किमान डेटाची विनंती करा आणि त्यानंतरच्या लॉगिनवर अतिरिक्त विशेषता हळूहळू गोळा करा. चांगल्या प्रकारे ऑप्टिमाइझ केलेल्या पोर्टलने एकूण ठिकाण अभ्यागतांपैकी 40-60% लॉगिन रूपांतरण दर (conversion rate) प्राप्त केला पाहिजे.
WiFi ॲनालिटिक्स प्लॅटफॉर्म आणि कॉर्पोरेट CRM (Salesforce, HubSpot, Microsoft Dynamics, किंवा समतुल्य) यांच्यात अखंड API एकीकरण सुनिश्चित करा.ivalent). यामुळे प्रत्यक्ष उपस्थितीवर आधारित रिअल-टाइम डेटा सिंक्रोनाइझेशन आणि स्वयंचलित मार्केटिंग ट्रिगर्स सक्षम होतात — उदाहरणार्थ, जेव्हा लॉयल्टी प्रोग्राम सदस्य किरकोळ वातावरणात प्रवेश करतो तेव्हा वैयक्तिकृत स्वागत संदेश पाठवणे, किंवा निघून गेल्यानंतर 30 मिनिटांनी भेटीनंतरचे समाधान सर्वेक्षण सुरू करणे.
किरकोळ-विशिष्ट डेटा संकलन धोरणांसाठी, How to Collect Customer Data In-Store: A Retailer's Guide एक तपशीलवार कार्यात्मक चौकट प्रदान करते.
टप्पा 3: ॲनालिटिक्स बेसलाइन आणि प्रेक्षक विभाजन
एकदा डेटा प्रवाहित झाल्यावर, किमान 30 दिवसांच्या कालावधीसाठी अभ्यागत कॅप्चर दर, सरासरी थांबण्याचा वेळ आणि पुन्हा भेट देण्याची वारंवारता यासाठी बेसलाइन मेट्रिक्स स्थापित करा. या डेटाचा वापर करून विभाजित प्रेक्षक प्रोफाइल तयार करा. उदाहरणार्थ, आदरातिथ्य संदर्भात, तुम्ही वापरकर्त्यांना व्यावसायिक प्रवासी (कमी थांबण्याचा वेळ, जास्त भेटीची वारंवारता, आठवड्याच्या दिवसांमध्ये जास्त) आणि मनोरंजक पाहुणे (जास्त थांबण्याचा वेळ, कमी भेटीची वारंवारता, आठवड्याच्या शेवटी जास्त) अशा गटांमध्ये विभागू शकता, त्यानुसार डिजिटल संवाद आणि ठिकाणावरील अनुभव तयार करू शकता.
टप्पा 4: सक्रियकरण आणि वैयक्तिकरण
विभाजित प्रोफाइल स्थापित झाल्यावर, लक्ष्यित संवाद आणि ठिकाणावरील वैयक्तिकरणाद्वारे डेटा सक्रिय करा. ट्रिगर केलेले ईमेल सिक्वेन्स, SMS मोहिमा आणि ॲप पुश नोटिफिकेशन्स हे सर्व WiFi इन्फ्रास्ट्रक्चरद्वारे शोधलेल्या प्रत्यक्ष उपस्थितीच्या घटनांद्वारे चालवले जाऊ शकतात. या सक्रियकरणाला आधार देणारा IoT एकत्रीकरण स्तर Internet of Things Architecture: A Complete Guide मध्ये सखोलपणे समाविष्ट केला आहे.
एंटरप्राइझ डिप्लॉयमेंट्ससाठी सर्वोत्तम पद्धती
डिझाइननुसार गोपनीयता आणि अनुपालनाला प्राधान्य द्या. सर्व डेटा संकलन यंत्रणांनी GDPR, CCPA आणि लागू स्थानिक गोपनीयता नियमांनुसार वापरकर्त्याची संमती स्पष्टपणे मागितली पाहिजे. AP किंवा WLC वर — कोणत्याही डेटा ॲनालिटिक्स प्लॅटफॉर्मवर पोहोचण्यापूर्वी — नेटवर्क एजवर अप्रमाणित प्रोब विनंत्यांसाठी MAC ॲड्रेस अनामीकरण लागू करा. संमती रेकॉर्ड टाइमस्टॅम्प आणि सादर केलेल्या विशिष्ट गोपनीयता सूचनेच्या आवृत्ती संदर्भांसह संग्रहित करणे आवश्यक आहे.
मोबाइल-फर्स्ट प्रमाणीकरणासाठी ऑप्टिमाइझ करा. Captive Portal आणि त्यानंतरचे सर्व डिजिटल संवाद iOS आणि Android वर निर्दोषपणे प्रतिसाद देणारे असावेत. प्रमाणीकरण प्रक्रियेदरम्यानची लेटन्सी थेट परित्याग दरांशी संबंधित असते. 4G कनेक्शनवर दोन सेकंदांपेक्षा कमी पोर्टल लोड वेळेचे लक्ष्य ठेवा.
IT आणि मार्केटिंग KPIs संरेखित करा. IT नेटवर्क अपटाइम, थ्रूपुट आणि प्रमाणीकरण लेटन्सीसाठी जबाबदार आहे. मार्केटिंग डेटा कॅप्चर दर आणि मोहिमेच्या कार्यक्षमतेसाठी जबाबदार आहे. यशस्वी CX धोरणासाठी सामायिक उद्दिष्टे आवश्यक आहेत — WiFi कॅप्चर दर (ठिकाणाला भेट देणाऱ्या अभ्यागतांची प्रमाणीकरण टक्केवारी), प्रति ओळखलेला अभ्यागत खर्च आणि पुन्हा भेट देण्याचा दर यांसारखी मेट्रिक्स दोन्ही कार्यांना जोडतात.
तुमच्या नेटवर्क आर्किटेक्चरचे योग्य विभाजन करा. गेस्ट WiFi नेटवर्क VLANs आणि कठोर स्टेटफुल फायरवॉल नियमांचा वापर करून कॉर्पोरेट LAN पासून तार्किकदृष्ट्या वेगळे केले पाहिजे. हे किरकोळ आणि आदरातिथ्य वातावरणात PCI DSS ची आवश्यकता आहे जिथे पेमेंट कार्ड डेटा त्याच साइटवर प्रक्रिया केला जातो. नेटवर्क बाउंड्रीचे नियमित भेदक चाचणी (penetration testing) आवश्यक आहे.
समस्यानिवारण आणि जोखीम कमी करणे
एक व्यापक CX ॲनालिटिक्स प्लॅटफॉर्म तैनात केल्याने विशिष्ट अपयश मोड (failure modes) येतात जे IT टीम्सनी सक्रियपणे अपेक्षित आणि कमी केले पाहिजेत.
कमी कॅप्चर दर (20% पेक्षा कमी). जर WiFi वर प्रमाणीकरण करणाऱ्या अभ्यागतांची टक्केवारी कमी असेल, तर त्याचे मुख्य कारण जवळजवळ नेहमीच Captive Portal घर्षण (friction) असते. पोर्टल UX चे ऑडिट करा: पहिल्या भेटीवर आवश्यक फील्डची संख्या एकपर्यंत कमी करा, सोशल लॉगिन पर्याय (Google, Apple, Facebook) जोडा आणि ईमेल ॲड्रेसच्या बदल्यात जलद, विश्वसनीय इंटरनेट ॲक्सेस — हा मूल्य विनिमय स्प्लॅश पेजवर स्पष्टपणे संप्रेषित केला आहे याची खात्री करा.
अचूक नसलेला स्थान डेटा. RSSI-आधारित स्थान ट्रॅकिंग भौतिक अडथळ्यांमुळे (काँक्रीटच्या भिंती, धातूचे शेल्फिंग, काचेचे विभाजन) RF ॲटेन्युएशन आणि जटिल इनडोअर वातावरणात मल्टीपाथ इंटरफेरन्ससाठी संवेदनशील आहे. RF मॉडेल नियमितपणे कॅलिब्रेट करा आणि उत्पादन डिस्प्ले किंवा सेवा काउंटरसारख्या उच्च-मूल्याच्या ॲनालिटिक्स झोनमध्ये BLE बीकन्ससह WiFi पोझिशनिंग पूरक करण्याचा विचार करा.
एकत्रीकरण पाइपलाइनमधील अपयश. WiFi ॲनालिटिक्स प्लॅटफॉर्म आणि CRM मधील API दर मर्यादा किंवा स्कीमा विसंगती हे डेटा गमावण्याचे एक सामान्य कारण आहे. इडेम्पोटेंट वेबहुक हाताळणी, अयशस्वी घटनांसाठी डेड-लेटर क्यूज आणि इव्हेंट पाइपलाइन अपेक्षित थ्रूपुट थ्रेशोल्डपेक्षा कमी झाल्यास स्वयंचलित अलर्टिंग लागू करा.
सुरक्षा सीमा उल्लंघने. चुकीच्या पद्धतीने कॉन्फिगर केलेले VLANs किंवा फायरवॉल नियम कॉर्पोरेट नेटवर्कला गेस्ट ट्रॅफिकसाठी अनवधानाने उघड करू शकतात. त्रैमासिक नेटवर्क सेगमेंटेशन ऑडिट करा आणि फायरवॉलवर डीफॉल्टनुसार सर्व इंटर-VLAN राउटिंग स्पष्टपणे नाकारले आहे याची खात्री करा, केवळ आवश्यक आउटबाउंड इंटरनेट ॲक्सेस गेस्ट SSID साठी परवानगी आहे.
ROI आणि व्यावसायिक परिणाम
CX धोरणाचे अंतिम माप म्हणजे व्यावसायिक परिणामांवर त्याचा होणारा परिणाम. भौतिक जागेचे डिजिटायझेशन करून, संस्था ई-कॉमर्सची विश्लेषणात्मक कठोरता प्रत्यक्ष व्यवसायांना लागू करू शकतात.
| मेट्रिक | सामान्य बेसलाइन | डिप्लॉयमेंटनंतरचे लक्ष्य | मापन पद्धत |
|---|---|---|---|
| WiFi कॅप्चर दर | 10-15% | 40-60% | Analytics platform |
| पुन्हा भेट देण्याचा दर | मोजले नाही | +15-25% वाढ | CRM attribution |
| ईमेल उघडण्याचा दर | उद्योग सरासरी 20% | 35-45% (स्थान-ट्रिगर केलेले) | Marketing platform |
| प्रति भेट अतिरिक्त महसूल | बेसलाइन | +8-12% वाढ | POS एकत्रीकरण |
| कर्मचारी तैनाती कार्यक्षमता | मॅन्युअल शेड्युलिंग | मागणी-आधारित (थांबण्याचा डेटा) | ऑपरेशन्स डॅशबोर्ड |
ग्राहक आजीवन मूल्य (CLV) वृद्धी. स्थान आणि वर्तणूक डेटाद्वारे चालवलेले वैयक्तिकृत संवाद पुन्हा भेट देण्याचे प्रमाण आणि सरासरी व्यवहार मूल्य वाढवतात. ट्रिगर केलेले, उपस्थिती-आधारित संवाद वापरणाऱ्या संस्था पहिल्या वर्षात CLV मध्ये 10-20% वाढ सातत्याने नोंदवतात.
कार्यक्षमतेत वाढ. हीटमॅप्स आणि थांबण्याच्या वेळेचा डेटा मागणीनुसार कर्मचाऱ्यांचे वाटप सक्षम करतो, ज्यामुळे ऑफ-पीक कालावधीत कामगार खर्च कमी होतो आणि पीक मागणीच्या वेळी सेवेची गुणवत्ता सुधारते. स्टेडियमच्या संदर्भात, याचा थेट अर्थ रांगेतील वेळ कमी होणे आणि प्रति-व्यक्ती सवलतीवरील खर्च वाढणे असा होतो.
विपणन गुणधर्म अचूकता. डिजिटल मोहिमेच्या प्रदर्शनासह प्रत्यक्ष भेटींच्या घटनांचा संबंध जोडून, विपणन संघ ऑनलाइन खर्चाचा ऑफलाइन परिणाम अशा अचूकतेने मोजू शकतात जी यापूर्वी केवळ शुद्ध ई-कॉमर्स ऑपरेटर्सना उपलब्ध होती. हे संभाषण प्रॉक्सी मेट्रिक्स (इम्प्रेशन्स, क्लिक्स) पासून ठोस व्यावसायिक परिणामांकडे (स्टोअर भेटी, व्यवहार वृद्धी) नेते.
महत्त्वाच्या संज्ञा आणि व्याख्या
Captive Portal
A web page that a user of a public-access network is required to interact with before internet access is granted. It serves as the primary data ingestion point in a guest WiFi deployment.
IT teams encounter this as the first digital touchpoint in the physical venue. Portal design directly determines WiFi capture rates and data quality.
RSSI (Received Signal Strength Indicator)
A measurement of the power level of a received radio signal, expressed in dBm. Used by analytics platforms to estimate the distance between a client device and an access point.
The foundational input for location analytics and zone-based dwell time measurement. Accuracy is typically 3-10 metres in a well-designed RF environment.
OpenRoaming
A global roaming federation service, built on Passpoint (IEEE 802.11u/Hotspot 2.0), that enables automatic and secure WiFi onboarding without captive portal interactions.
Critical for reducing login friction for returning visitors while maintaining secure identity attribution. Purple provides a free identity provider service for OpenRoaming under the Connect licence.
MAC Address Anonymisation
The process of cryptographically hashing a device's Media Access Control address before storage, preventing the identification of individual devices from the stored data.
A mandatory GDPR compliance step when tracking unauthenticated devices via probe requests. Must be implemented at the network edge, not in the analytics database.
Dwell Time
The duration of time a device remains within a specific defined zone or venue, measured from first detection to last detection within that zone.
A primary operational metric for measuring engagement, identifying queue bottlenecks, and optimising staff deployment. Typically measured in minutes.
Progressive Profiling
A data collection methodology that gathers customer attributes incrementally across multiple interactions, rather than requesting all information at a single point.
The standard best practice for captive portal design. Reduces initial login friction while building comprehensive customer profiles over time.
Passpoint (Hotspot 2.0)
A Wi-Fi Alliance certification programme based on IEEE 802.11u that enables seamless, secure roaming between Wi-Fi networks using WPA2/WPA3 Enterprise authentication.
Provides enterprise-grade security for guest networks and automates the authentication process for returning users, eliminating repetitive captive portal interactions.
WiFi Capture Rate
The percentage of total venue visitors who successfully authenticate to the guest WiFi network, providing a consented identity record.
The primary KPI for measuring the effectiveness of the captive portal and the health of the first-party data pipeline. Industry benchmarks range from 15% (poor) to 60%+ (optimised).
Spatial Analytics
The analysis of location-based data to understand movement patterns, zone utilisation, and spatial relationships within a physical environment.
Enables venue operators to visualise customer journeys, measure zone conversion rates, and make evidence-based decisions about physical layout and resource allocation.
केस स्टडीज
A 200-room hotel is experiencing low guest WiFi adoption rates — under 15% of guests are logging in — and is failing to capture sufficient first-party data to support a new loyalty programme initiative. The hotel uses a legacy captive portal with a six-field registration form.
Step 1 — Diagnose the Friction Point: Pull the captive portal analytics to identify the drop-off rate at each form field. In most cases, the majority of abandonment occurs after the second or third required field. Step 2 — Streamline Authentication: Replace the six-field form with a single-click social login (Google, Apple, or Facebook OAuth) as the primary option, with email-only as a secondary option. This reduces the time-to-internet from 45-60 seconds to under 10 seconds. Step 3 — Implement Progressive Profiling: Configure the analytics platform to request only the email address on the first visit. On the second visit, display a prompt offering 500 loyalty points in exchange for a phone number. On the third visit, request a date of birth for a birthday reward. Step 4 — Deploy OpenRoaming for Returning Guests: For guests who have previously authenticated, configure Passpoint/OpenRoaming so their device reconnects automatically on future visits without seeing the captive portal, while still attributing the visit to their profile. Step 5 — Measure and Iterate: Track the WiFi Capture Rate weekly. Target 40% within 60 days of deployment.
A large retail chain wants to measure the commercial effectiveness of a new store layout in driving traffic to a high-margin accessories display area, and needs to justify the capital expenditure on the refit to the board.
Step 1 — Define the Analytics Zone: Within the WiFi analytics platform, draw a geofence around the accessories display area. Ensure AP coverage within the zone is sufficient for accurate RSSI triangulation (minimum two APs with clear line of sight). Step 2 — Establish a Pre-Refit Baseline: Over a 30-day period before the layout change, measure: Zone Conversion Rate (percentage of total store visitors who enter the accessories zone), Average Dwell Time within the zone, and Bounce Rate (visitors who enter and leave within under 30 seconds). Step 3 — Implement the Layout Change. Step 4 — Measure Post-Refit Performance: Over the equivalent 30-day period post-refit, collect the same metrics. Step 5 — Correlate with POS Data: Integrate the WiFi analytics platform with the POS system to correlate zone dwell time with accessories transaction volume. Calculate the incremental revenue attributable to the layout change. Step 6 — Calculate ROI: Divide the incremental annual revenue by the refit capital cost to produce a payback period for the board presentation.
परिस्थिती विश्लेषण
Q1. A stadium IT director wants to track queue times at concession stands in real time to dynamically deploy additional staff during peak periods. The venue has standard WiFi coverage across the concourse. What is the most appropriate technological approach, and what are the limitations of relying solely on WiFi RSSI data for this use case?
💡 संकेत:Consider the accuracy requirements for measuring a dense, slow-moving queue versus general concourse crowd flow. What is the typical RSSI accuracy range, and is it sufficient for distinguishing a 2-metre queue from a 5-metre queue?
शिफारस केलेला दृष्टिकोन दाखवा
Standard WiFi RSSI tracking provides positional accuracy of approximately 3-10 metres in a well-calibrated indoor environment, which is insufficient for precise queue length measurement at a concession stand. The recommended approach is to supplement the WiFi infrastructure with either: (a) BLE beacons mounted directly above each concession counter, providing sub-2-metre accuracy for devices within the queue zone; or (b) overhead stereoscopic cameras with computer vision analytics for people-counting independent of device presence. The WiFi layer remains valuable for macro-level concourse crowd density and flow direction, while the supplementary technology handles the precision queue measurement use case. The integration point is the analytics platform, which should aggregate both data streams into a unified operational dashboard.
Q2. The marketing team at a retail chain wants to send a personalised push notification to a high-value loyalty member the moment they enter the store, before they have interacted with any staff. The current deployment uses a standard captive portal that takes approximately 45 seconds to complete. How should the IT team architect a solution that delivers a sub-10-second entry notification?
💡 संकेत:The captive portal authentication flow is too slow for an immediate entry notification. What authentication mechanism eliminates the portal interaction for returning users while still attributing the visit to their identity?
शिफारस केलेला दृष्टिकोन दाखवा
The solution requires implementing Passpoint/OpenRoaming for returning loyalty members. The workflow is: (1) On the member's first visit, they complete the standard captive portal and their device credentials are provisioned for Passpoint. (2) On all subsequent visits, the device automatically authenticates via 802.1X/WPA3 Enterprise without displaying the captive portal, completing the authentication handshake in under 2 seconds. (3) The WiFi analytics platform detects the association event and identifies the user via their provisioned identity token. (4) A real-time webhook fires to the marketing automation platform, which dispatches the push notification within 5-8 seconds of the device entering the RF coverage zone. The key architectural requirement is that the loyalty app must have push notification permissions enabled, and the member's device must have the Passpoint profile installed — typically achieved via the loyalty app onboarding flow.
Q3. During a routine network audit at a multi-site retail operator, it is discovered that the guest WiFi analytics platform has been storing raw, unhashed MAC addresses from unauthenticated probe requests for the past 18 months across all 47 stores. What is the primary regulatory risk, what is the immediate remediation action, and what architectural change is required to prevent recurrence?
💡 संकेत:Consider the GDPR classification of MAC addresses and the territorial scope of the regulation. What constitutes a 'personal data breach' under Article 33?
शिफारस केलेला दृष्टिकोन दाखवा
The primary risk is a material GDPR violation under Article 5(1)(b) (purpose limitation) and Article 5(1)(e) (storage limitation), as raw MAC addresses are classified as personal data under Recital 30 of the GDPR. The 18-month retention of unauthenticated probe data without a lawful basis or consent constitutes unlawful processing. Immediate remediation: (1) Notify the Data Protection Officer and conduct a Data Protection Impact Assessment (DPIA). (2) Assess whether the breach meets the Article 33 threshold for supervisory authority notification (within 72 hours if there is a risk to individuals' rights). (3) Purge all stored raw MAC addresses from the analytics database immediately. Architectural remediation: Configure the analytics platform or WLC to apply a SHA-256 hash with a rotating salt to all MAC addresses at the point of capture — on the AP or controller — before any data is transmitted to the analytics platform. This ensures that no raw MAC address ever enters the data pipeline, making the stored data non-personal by design. Implement a 90-day maximum retention policy for anonymised probe data, enforced by automated database purge jobs.
