Comment élaborer une stratégie d'expérience client
Ce guide de référence technique offre un cadre pratique aux leaders informatiques, aux architectes réseau et aux directeurs des opérations de sites pour élaborer une stratégie d'expérience client axée sur les données. Il couvre l'architecture complète, de l'authentification WiFi invité et de la conception du Captive Portal à l'analyse spatiale, l'intégration CRM et le ROI mesurable — avec des scénarios de mise en œuvre concrets tirés des secteurs de l'hôtellerie, du commerce de détail et du secteur public. La plateforme WiFi invité et d'analyse de Purple est présentée tout au long du guide comme la couche d'infrastructure habilitante.
🎧 Écouter ce guide
Voir la transcription
Résumé Exécutif
Pour les leaders informatiques d'entreprise et les directeurs des opérations de sites, l'élaboration d'une stratégie d'expérience client (CX) n'est plus le seul domaine du marketing. À mesure que les sites physiques — des chaînes de magasins aux grands stades — se numérisent de plus en plus, l'infrastructure réseau sous-jacente devient le moteur principal de l'acquisition de données clients. Ce guide explique comment architecturer une stratégie CX qui tire parti de l'infrastructure sans fil existante pour capturer des informations exploitables, automatiser l'engagement et générer un retour sur investissement mesurable.
En déployant une solution Guest WiFi robuste, les organisations peuvent transformer un centre de coûts opérationnel en un atout stratégique. Une stratégie CX réussie repose sur une collecte de données transparente, une conformité rigoureuse (y compris GDPR et PCI DSS) et une intégration avec les plateformes CRM et d'automatisation du marketing existantes. Ce document fournit un cadre technique, indépendant des fournisseurs, pour concevoir, implémenter et faire évoluer une architecture d'expérience client axée sur les données dans les environnements Hôtellerie , Commerce de détail , Santé et Transport .
Plongée technique : Architecturer la fondation des données CX
La fondation de toute stratégie CX moderne dans un site physique est la capacité d'identifier et de suivre de manière fiable les utilisateurs tout au long de leur cycle de visite. Cela nécessite une architecture réseau robuste capable de gérer un grand nombre d'appareils simultanés tout en acheminant de manière transparente le trafic d'authentification vers un Captive Portal ou un fournisseur d'identité.
Mécanismes d'authentification et de capture de données
Lorsqu'un utilisateur s'associe au SSID invité, le point d'accès (AP) ou le contrôleur de réseau local sans fil (WLC) intercepte la requête HTTP/HTTPS et la redirige vers un Captive Portal. Ce portail sert de point d'ingestion de données principal — le seuil numérique entre le visiteur anonyme et le client identifié.
Les modèles de déploiement standard utilisent RADIUS (Remote Authentication Dial-In User Service) pour l'authentification, l'autorisation et la comptabilité (AAA). Lors de l'intégration avec des plateformes comme WiFi Analytics de Purple, le Captive Portal demande des attributs utilisateur spécifiques — adresse e-mail, données démographiques ou jetons de connexion sociale — avant d'accorder l'accès au réseau via un message RADIUS Access-Accept. Les données sont simultanément écrites dans la base de données clients de la plateforme d'analyse et, via webhook API, dans le CRM connecté.
Pour les déploiements avancés, des technologies comme Passpoint (Hotspot 2.0) et OpenRoaming permettent un onboarding transparent et sécurisé en utilisant le chiffrement IEEE 802.1X et WPA3 Enterprise. Purple agit comme un fournisseur d'identité gratuit pour OpenRoaming sous la licence Connect, permettant une authentification automatique sans interactions répétitives avec le Captive Portal — réduisant considérablement la friction tout en maintenant une attribution de données sécurisée pour les visiteurs récurrents.
Analyse de localisation et suivi comportemental
Au-delà de l'authentification initiale, l'analyse spatiale continue est essentielle pour comprendre le parcours client complet au sein du site. Ceci est réalisé en suivant l'indicateur de force du signal reçu (RSSI) des requêtes de sondage non associées et du trafic client associé à travers plusieurs AP.
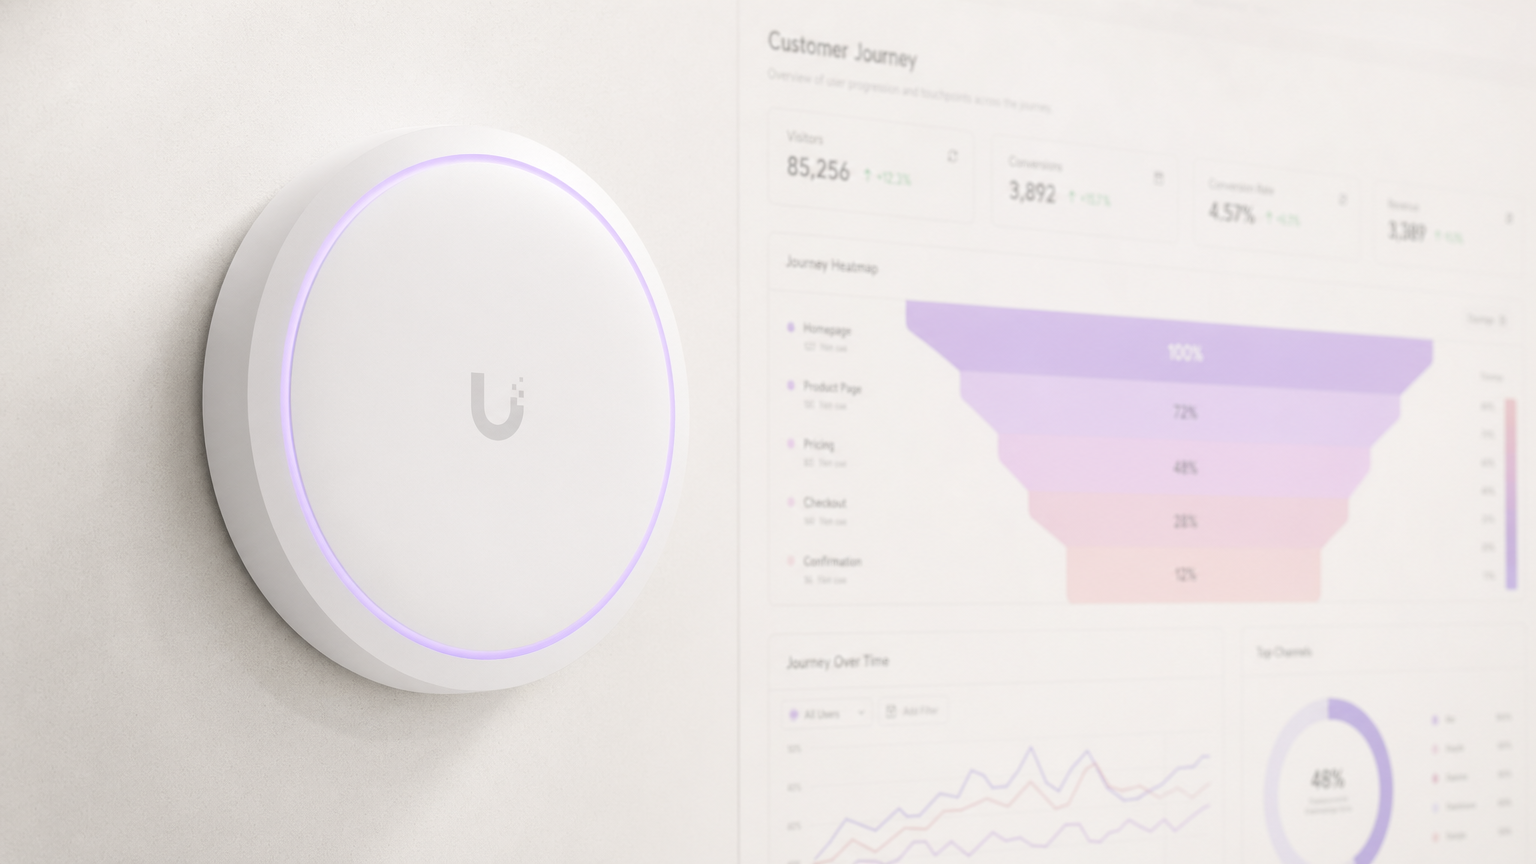
En triangulant ces signaux, le réseau calcule les temps de séjour, identifie les zones à fort trafic et cartographie les schémas de flux de visiteurs typiques. Pour une précision plus granulaire, les déploiements peuvent intégrer des balises Bluetooth Low Energy (BLE) ou des capteurs Ultra-Wideband (UWB) en complément de la couche WiFi, comme détaillé dans le Guide des systèmes de positionnement intérieur : UWB, BLE et WiFi . Ces données spatiales sont ensuite agrégées et visualisées via des cartes thermiques et des flux de parcours, fournissant les preuves empiriques nécessaires pour optimiser les aménagements physiques, les modèles de personnel et le placement marketing sur site.
Guide de mise en œuvre : Déployer la stratégie
La mise en œuvre d'une stratégie CX basée sur le WiFi nécessite un alignement interfonctionnel entre l'informatique, le marketing et les opérations. Le déploiement doit suivre une approche par phases pour garantir la stabilité de l'infrastructure, l'intégrité des données et des résultats mesurables à chaque étape.
Phase 1 : Évaluation de l'infrastructure et conception RF
Avant de déployer des superpositions d'analyse, l'environnement RF (Radio Fréquence) sous-jacent doit prendre en charge des charges client à haute densité. Effectuez des études de site prédictives et actives pour garantir une couverture de signal adéquate — généralement -65 dBm ou mieux au niveau de l'appareil client — et une capacité AP suffisante. Pour les environnements complexes ou spécialisés tels que les salles d'exposition automobiles, consultez le Guide complet 2026 de l'entreprise : Wi-Fi dans l'automobile pour des conseils spécifiques au déploiement.
Paramètres d'infrastructure clés à valider avant de poursuivre :
| Paramètre | Seuil minimum | Notes |
|---|---|---|
| Couverture du signal | -65 dBm | À la hauteur de l'appareil client |
| Ratio AP/Client | 1:25 (dense) | Ajuster pour les sites événementiels |
| Utilisation du canal | <60% | Par AP, 2.4 GHz et 5 GHz |
| Latence du Captive Portal | <500ms | Temps de réponse de la redirection |
| Aller-retour RADIUS | <100ms | Réponse d'authentification |
Phase 2 : Configuration du Captive Portal et intégration CRM
Le Captive Portal doit équilibrer l'acquisition de données et l'expérience utilisateur. Mettez en œuvre un profilage progressif — demandant un minimum de données lors de la première visite et collectant progressivement des attributs supplémentaires lors des connexions ultérieures. Un portail bien optimisé devrait atteindre un taux de conversion de connexion de 40 à 60 % du total des visiteurs du site.
Assurez une intégration API transparente entre la plateforme d'analyse WiFi et le CRM d'entreprise (Salesforce, HubSpot, Microsoft Dynamics, ou équiivalent). Cela permet une synchronisation des données en temps réel et des déclencheurs marketing automatisés basés sur la présence physique — par exemple, l'envoi d'un message de bienvenue personnalisé lorsqu'un membre d'un programme de fidélité entre dans un environnement de vente au détail, ou le déclenchement d'une enquête de satisfaction post-visite 30 minutes après le départ.
Pour les stratégies de collecte de données spécifiques au commerce de détail, le Comment collecter des données clients en magasin : un guide pour les détaillants fournit un cadre opérationnel détaillé.
Phase 3 : Référence Analytique et Segmentation d'Audience
Une fois les données en flux, établissez des métriques de référence pour les taux de capture de visiteurs, les temps de présence moyens et les fréquences de visites répétées sur une période minimale de 30 jours. Utilisez ces données pour construire des profils d'audience segmentés. Dans un contexte hôtelier, par exemple, vous pourriez segmenter les utilisateurs en Voyageurs d'Affaires (temps de présence courts, fréquence de visite élevée, prédominance en semaine) et Clients Loisirs (temps de présence prolongés, faible fréquence de visite, prédominance le week-end), en adaptant les communications numériques et les expériences sur place en conséquence.
Phase 4 : Activation et Personnalisation
Une fois les profils segmentés établis, activez les données par le biais de communications ciblées et de la personnalisation sur place. Les séquences d'e-mails déclenchées, les campagnes SMS et les notifications push d'applications peuvent toutes être pilotées par des événements de présence physique détectés par l'infrastructure WiFi. La couche d'intégration IoT qui sous-tend cette activation est couverte en profondeur dans le Architecture de l'Internet des Objets : Un Guide Complet .
Bonnes Pratiques pour les Déploiements en Entreprise
Prioriser la Confidentialité et la Conformité dès la Conception. Tous les mécanismes de collecte de données doivent explicitement demander le consentement de l'utilisateur conformément au GDPR, au CCPA et aux réglementations locales de confidentialité applicables. Mettez en œuvre l'anonymisation des adresses MAC pour les requêtes de sondage non authentifiées à la périphérie du réseau — sur l'AP ou le WLC — avant que toute donnée n'atteigne la plateforme d'analyse. Les enregistrements de consentement doivent être stockés avec des horodatages et des références de version à l'avis de confidentialité spécifique présenté.
Optimiser pour l'Authentification Mobile-First. Le captive portal et toutes les interactions numériques ultérieures doivent être parfaitement réactifs sur iOS et Android. La latence pendant le processus d'authentification est directement corrélée aux taux d'abandon. Visez un temps de chargement du portail de moins de deux secondes sur une connexion 4G.
Aligner les KPI de l'IT et du Marketing. L'IT est responsable de la disponibilité du réseau, du débit et de la latence d'authentification. Le marketing est responsable des taux de capture de données et de la performance des campagnes. Une stratégie CX réussie exige des objectifs partagés — des métriques telles que le Taux de Capture WiFi (pourcentage de visiteurs du lieu qui s'authentifient), le Coût par Visiteur Identifié et le Taux de Visites Répétées relient les deux fonctions.
Segmenter Correctement Votre Architecture Réseau. Le réseau WiFi invité doit être logiquement isolé du LAN d'entreprise à l'aide de VLANs et de règles de pare-feu strictes avec état. Il s'agit d'une exigence PCI DSS dans les environnements de vente au détail et d'hôtellerie où les données de cartes de paiement sont traitées sur le même site. Des tests d'intrusion réguliers de la frontière du réseau sont essentiels.
Dépannage et Atténuation des Risques
Le déploiement d'une plateforme d'analyse CX complète introduit des modes de défaillance spécifiques que les équipes IT doivent anticiper et atténuer de manière proactive.
Faibles Taux de Capture (inférieurs à 20 %). Si le pourcentage de visiteurs s'authentifiant au WiFi est faible, la cause principale est presque toujours la friction du captive portal. Auditez l'UX du portail : réduisez le nombre de champs requis à un seul lors de la première visite, ajoutez des options de connexion sociale (Google, Apple, Facebook) et assurez-vous que l'échange de valeur — un accès Internet rapide et fiable en échange d'une adresse e-mail — est clairement communiqué sur la page d'accueil.
Données de Localisation Imprécises. Le suivi de localisation basé sur le RSSI est sensible à l'atténuation RF due aux obstacles physiques (murs en béton, étagères métalliques, cloisons en verre) et aux interférences multipath dans les environnements intérieurs complexes. Calibrez régulièrement le modèle RF et envisagez de compléter le positionnement WiFi avec des balises BLE dans les zones d'analyse à forte valeur ajoutée telles que les présentoirs de produits ou les comptoirs de service.
Défaillances du Pipeline d'Intégration. Les limites de débit API ou les incohérences de schéma entre la plateforme d'analyse WiFi et le CRM sont une source courante de perte de données. Mettez en œuvre une gestion idempotente des webhooks, des files d'attente de lettres mortes pour les événements échoués et des alertes automatisées lorsque le pipeline d'événements tombe en dessous des seuils de débit attendus.
Violations des Limites de Sécurité. Des VLANs ou des règles de pare-feu mal configurés peuvent exposer par inadvertance le réseau d'entreprise au trafic invité. Effectuez des audits trimestriels de segmentation du réseau et assurez-vous que tout routage inter-VLAN est explicitement refusé par défaut au niveau du pare-feu, avec seulement l'accès Internet sortant requis autorisé pour le SSID invité.
ROI et Impact Commercial
La mesure ultime d'une stratégie CX est son impact sur les résultats commerciaux. En numérisant l'espace physique, les organisations peuvent appliquer la rigueur analytique du commerce électronique aux opérations physiques.
| Métrique | Référence Typique | Cible Post-Déploiement | Méthode de Mesure |
|---|---|---|---|
| Taux de Capture WiFi | 10-15% | 40-60% | Plateforme d'analyse |
| Taux de Visites Répétées | Non mesuré | +15-25% d'augmentation | Attribution CRM |
| Taux d'Ouverture d'E-mails | Moyenne de l'industrie 20% | 35-45% (déclenché par la localisation) | Plateforme marketing |
| Revenu Annexe par Visite | Référence | +8-12% d'augmentation | Intégration POS |
| Efficacité du Déploiement du Personnel | Planification manuelle | Basé sur la demande (données de présence) | Tableau de bord des opérations |
**Valeur Vie Client (CLV) Croissance des revenus. Des interactions personnalisées, basées sur les données de localisation et comportementales, augmentent les taux de visites répétées et les valeurs moyennes de transaction. Les organisations qui déploient des communications déclenchées et basées sur la présence signalent systématiquement une augmentation de 10 à 20 % de la CLV au cours de la première année de déploiement.
Gains d'efficacité opérationnelle. Les cartes thermiques et les données de temps de séjour permettent une allocation du personnel basée sur la demande, réduisant les coûts de main-d'œuvre pendant les périodes creuses et améliorant la qualité du service pendant les périodes de forte affluence. Dans un contexte de stade, cela se traduit directement par une réduction des temps d'attente et une augmentation des dépenses par personne aux concessions.
Précision de l'attribution marketing. En corrélant les événements de visite physique avec l'exposition aux campagnes numériques, les équipes marketing peuvent mesurer l'impact hors ligne des dépenses en ligne avec une précision auparavant uniquement accessible aux opérateurs de commerce électronique pur. Cela déplace la conversation des métriques indirectes (impressions, clics) vers des résultats commerciaux concrets (visites en magasin, augmentation des transactions).
Termes clés et définitions
Captive Portal
A web page that a user of a public-access network is required to interact with before internet access is granted. It serves as the primary data ingestion point in a guest WiFi deployment.
IT teams encounter this as the first digital touchpoint in the physical venue. Portal design directly determines WiFi capture rates and data quality.
RSSI (Received Signal Strength Indicator)
A measurement of the power level of a received radio signal, expressed in dBm. Used by analytics platforms to estimate the distance between a client device and an access point.
The foundational input for location analytics and zone-based dwell time measurement. Accuracy is typically 3-10 metres in a well-designed RF environment.
OpenRoaming
A global roaming federation service, built on Passpoint (IEEE 802.11u/Hotspot 2.0), that enables automatic and secure WiFi onboarding without captive portal interactions.
Critical for reducing login friction for returning visitors while maintaining secure identity attribution. Purple provides a free identity provider service for OpenRoaming under the Connect licence.
MAC Address Anonymisation
The process of cryptographically hashing a device's Media Access Control address before storage, preventing the identification of individual devices from the stored data.
A mandatory GDPR compliance step when tracking unauthenticated devices via probe requests. Must be implemented at the network edge, not in the analytics database.
Dwell Time
The duration of time a device remains within a specific defined zone or venue, measured from first detection to last detection within that zone.
A primary operational metric for measuring engagement, identifying queue bottlenecks, and optimising staff deployment. Typically measured in minutes.
Progressive Profiling
A data collection methodology that gathers customer attributes incrementally across multiple interactions, rather than requesting all information at a single point.
The standard best practice for captive portal design. Reduces initial login friction while building comprehensive customer profiles over time.
Passpoint (Hotspot 2.0)
A Wi-Fi Alliance certification programme based on IEEE 802.11u that enables seamless, secure roaming between Wi-Fi networks using WPA2/WPA3 Enterprise authentication.
Provides enterprise-grade security for guest networks and automates the authentication process for returning users, eliminating repetitive captive portal interactions.
WiFi Capture Rate
The percentage of total venue visitors who successfully authenticate to the guest WiFi network, providing a consented identity record.
The primary KPI for measuring the effectiveness of the captive portal and the health of the first-party data pipeline. Industry benchmarks range from 15% (poor) to 60%+ (optimised).
Spatial Analytics
The analysis of location-based data to understand movement patterns, zone utilisation, and spatial relationships within a physical environment.
Enables venue operators to visualise customer journeys, measure zone conversion rates, and make evidence-based decisions about physical layout and resource allocation.
Études de cas
A 200-room hotel is experiencing low guest WiFi adoption rates — under 15% of guests are logging in — and is failing to capture sufficient first-party data to support a new loyalty programme initiative. The hotel uses a legacy captive portal with a six-field registration form.
Step 1 — Diagnose the Friction Point: Pull the captive portal analytics to identify the drop-off rate at each form field. In most cases, the majority of abandonment occurs after the second or third required field. Step 2 — Streamline Authentication: Replace the six-field form with a single-click social login (Google, Apple, or Facebook OAuth) as the primary option, with email-only as a secondary option. This reduces the time-to-internet from 45-60 seconds to under 10 seconds. Step 3 — Implement Progressive Profiling: Configure the analytics platform to request only the email address on the first visit. On the second visit, display a prompt offering 500 loyalty points in exchange for a phone number. On the third visit, request a date of birth for a birthday reward. Step 4 — Deploy OpenRoaming for Returning Guests: For guests who have previously authenticated, configure Passpoint/OpenRoaming so their device reconnects automatically on future visits without seeing the captive portal, while still attributing the visit to their profile. Step 5 — Measure and Iterate: Track the WiFi Capture Rate weekly. Target 40% within 60 days of deployment.
A large retail chain wants to measure the commercial effectiveness of a new store layout in driving traffic to a high-margin accessories display area, and needs to justify the capital expenditure on the refit to the board.
Step 1 — Define the Analytics Zone: Within the WiFi analytics platform, draw a geofence around the accessories display area. Ensure AP coverage within the zone is sufficient for accurate RSSI triangulation (minimum two APs with clear line of sight). Step 2 — Establish a Pre-Refit Baseline: Over a 30-day period before the layout change, measure: Zone Conversion Rate (percentage of total store visitors who enter the accessories zone), Average Dwell Time within the zone, and Bounce Rate (visitors who enter and leave within under 30 seconds). Step 3 — Implement the Layout Change. Step 4 — Measure Post-Refit Performance: Over the equivalent 30-day period post-refit, collect the same metrics. Step 5 — Correlate with POS Data: Integrate the WiFi analytics platform with the POS system to correlate zone dwell time with accessories transaction volume. Calculate the incremental revenue attributable to the layout change. Step 6 — Calculate ROI: Divide the incremental annual revenue by the refit capital cost to produce a payback period for the board presentation.
Analyse de scénario
Q1. A stadium IT director wants to track queue times at concession stands in real time to dynamically deploy additional staff during peak periods. The venue has standard WiFi coverage across the concourse. What is the most appropriate technological approach, and what are the limitations of relying solely on WiFi RSSI data for this use case?
💡 Astuce :Consider the accuracy requirements for measuring a dense, slow-moving queue versus general concourse crowd flow. What is the typical RSSI accuracy range, and is it sufficient for distinguishing a 2-metre queue from a 5-metre queue?
Afficher l'approche recommandée
Standard WiFi RSSI tracking provides positional accuracy of approximately 3-10 metres in a well-calibrated indoor environment, which is insufficient for precise queue length measurement at a concession stand. The recommended approach is to supplement the WiFi infrastructure with either: (a) BLE beacons mounted directly above each concession counter, providing sub-2-metre accuracy for devices within the queue zone; or (b) overhead stereoscopic cameras with computer vision analytics for people-counting independent of device presence. The WiFi layer remains valuable for macro-level concourse crowd density and flow direction, while the supplementary technology handles the precision queue measurement use case. The integration point is the analytics platform, which should aggregate both data streams into a unified operational dashboard.
Q2. The marketing team at a retail chain wants to send a personalised push notification to a high-value loyalty member the moment they enter the store, before they have interacted with any staff. The current deployment uses a standard captive portal that takes approximately 45 seconds to complete. How should the IT team architect a solution that delivers a sub-10-second entry notification?
💡 Astuce :The captive portal authentication flow is too slow for an immediate entry notification. What authentication mechanism eliminates the portal interaction for returning users while still attributing the visit to their identity?
Afficher l'approche recommandée
The solution requires implementing Passpoint/OpenRoaming for returning loyalty members. The workflow is: (1) On the member's first visit, they complete the standard captive portal and their device credentials are provisioned for Passpoint. (2) On all subsequent visits, the device automatically authenticates via 802.1X/WPA3 Enterprise without displaying the captive portal, completing the authentication handshake in under 2 seconds. (3) The WiFi analytics platform detects the association event and identifies the user via their provisioned identity token. (4) A real-time webhook fires to the marketing automation platform, which dispatches the push notification within 5-8 seconds of the device entering the RF coverage zone. The key architectural requirement is that the loyalty app must have push notification permissions enabled, and the member's device must have the Passpoint profile installed — typically achieved via the loyalty app onboarding flow.
Q3. During a routine network audit at a multi-site retail operator, it is discovered that the guest WiFi analytics platform has been storing raw, unhashed MAC addresses from unauthenticated probe requests for the past 18 months across all 47 stores. What is the primary regulatory risk, what is the immediate remediation action, and what architectural change is required to prevent recurrence?
💡 Astuce :Consider the GDPR classification of MAC addresses and the territorial scope of the regulation. What constitutes a 'personal data breach' under Article 33?
Afficher l'approche recommandée
The primary risk is a material GDPR violation under Article 5(1)(b) (purpose limitation) and Article 5(1)(e) (storage limitation), as raw MAC addresses are classified as personal data under Recital 30 of the GDPR. The 18-month retention of unauthenticated probe data without a lawful basis or consent constitutes unlawful processing. Immediate remediation: (1) Notify the Data Protection Officer and conduct a Data Protection Impact Assessment (DPIA). (2) Assess whether the breach meets the Article 33 threshold for supervisory authority notification (within 72 hours if there is a risk to individuals' rights). (3) Purge all stored raw MAC addresses from the analytics database immediately. Architectural remediation: Configure the analytics platform or WLC to apply a SHA-256 hash with a rotating salt to all MAC addresses at the point of capture — on the AP or controller — before any data is transmitted to the analytics platform. This ensures that no raw MAC address ever enters the data pipeline, making the stored data non-personal by design. Implement a 90-day maximum retention policy for anonymised probe data, enforced by automated database purge jobs.
