Software de encuesta WiFi: Cómo mapear y optimizar su red inalámbrica
Esta guía proporciona a los gerentes de TI y arquitectos de red estrategias accionables para usar software de encuesta WiFi para mapear, optimizar y solucionar problemas en redes inalámbricas empresariales. Cubre tipos de encuestas esenciales, métricas de RF críticas, mejores prácticas de implementación y la integración de datos de encuestas con análisis de negocio.
Escucha esta guía
Ver transcripción del podcast
Resumen Ejecutivo
Para los recintos modernos, la red inalámbrica ya no es meramente una utilidad de TI; es la infraestructura crítica que sustenta la satisfacción del huésped, la eficiencia operativa y los flujos de ingresos digitales. Ya sea que gestione un hotel de 200 habitaciones, una propiedad minorista con 50 sucursales o un estadio a gran escala, depender de redes implementadas sin una validación rigurosa es un riesgo operativo significativo.
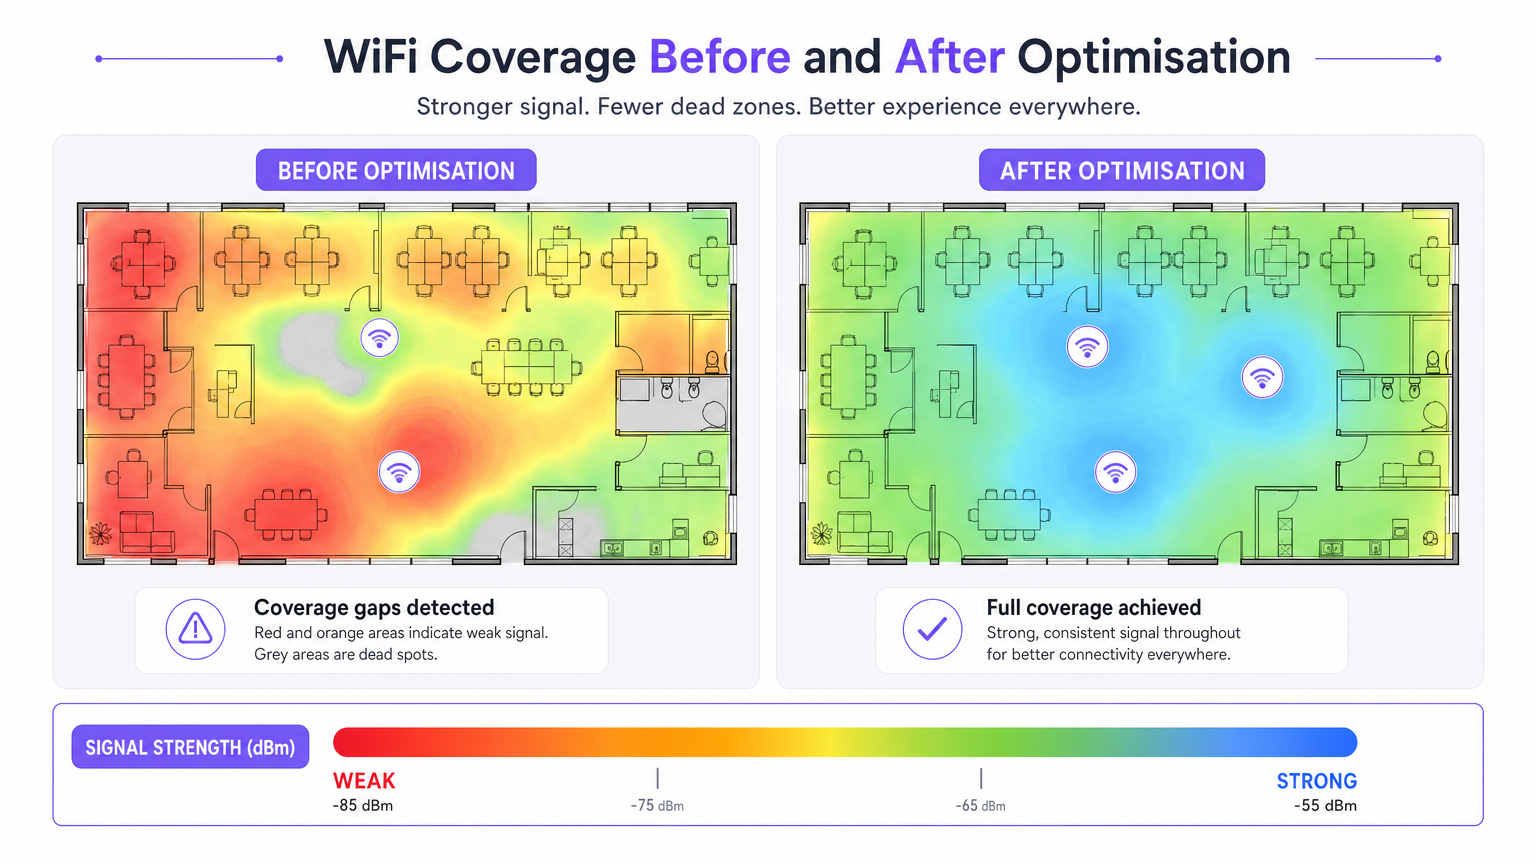
El software de encuesta WiFi es la herramienta esencial para mitigar este riesgo. Permite a los arquitectos de red medir, mapear y modelar el entorno de radiofrecuencia (RF), traduciendo la propagación de señales invisibles en mapas de calor accionables. Esta guía describe la mecánica central de las encuestas de sitio WiFi, detalla las métricas críticas requeridas para entornos de alta densidad y proporciona un marco de implementación neutral al proveedor para asegurar que su infraestructura inalámbrica ofrezca conectividad consistente y de alto rendimiento.
Análisis Técnico Detallado
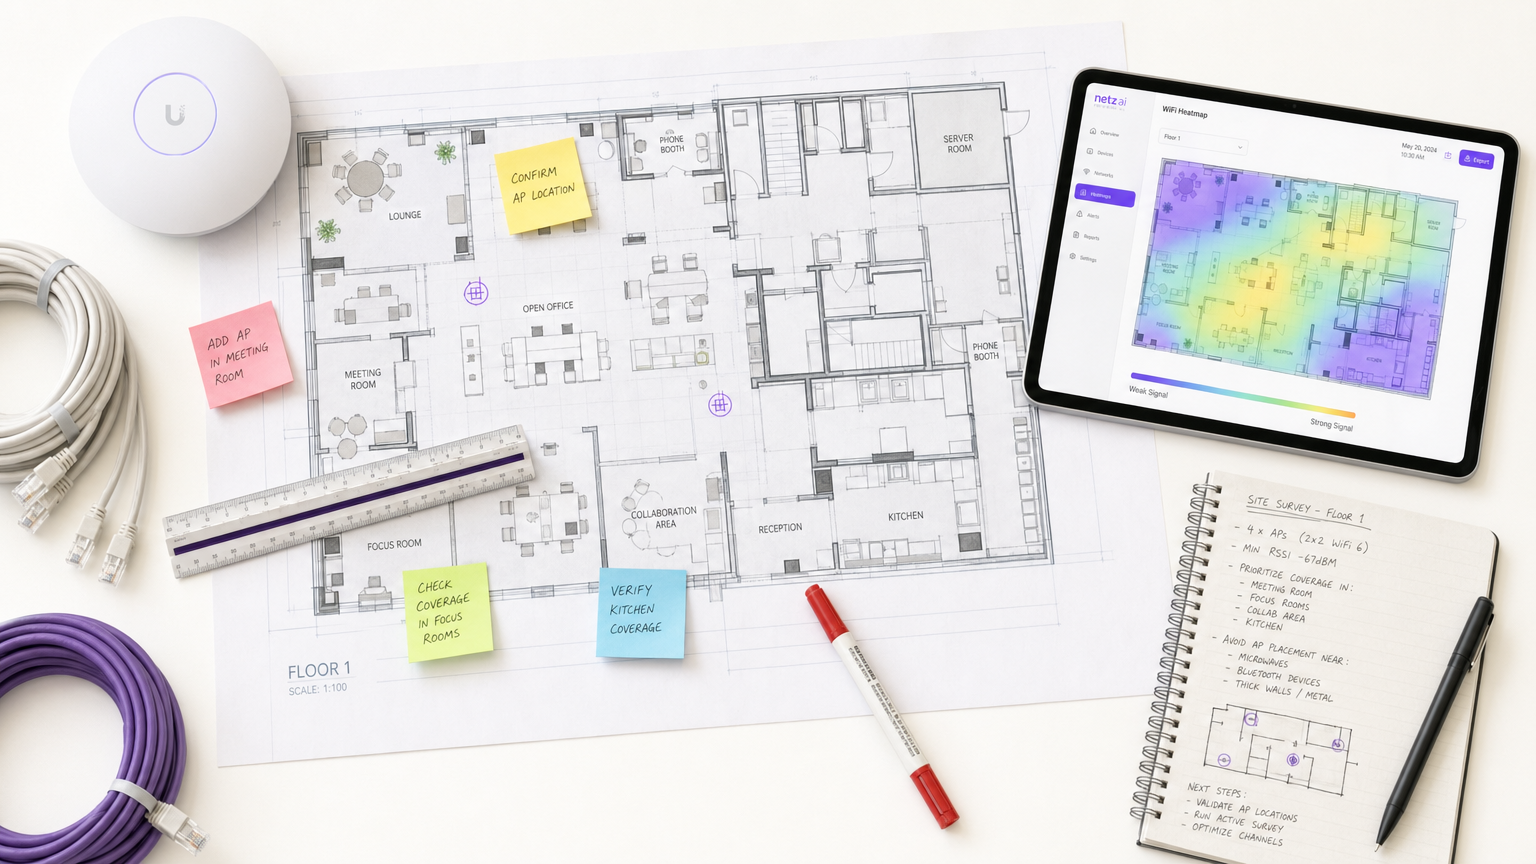
El software de encuesta de sitio WiFi transforma los datos RF brutos en mapas de calor visuales, permitiendo una ingeniería de red precisa. Comprender los distintos tipos de encuestas y las métricas que capturan es fundamental para un diseño de red eficaz.
Tipos de Encuestas WiFi
- Encuesta Pasiva: El dispositivo de encuesta escucha el entorno RF sin asociarse a un punto de acceso (AP). Captura tramas de baliza, mide el Indicador de Fuerza de Señal Recibida (RSSI) en todos los AP visibles y registra datos según las coordenadas del plano. Esto establece su línea base e identifica APs no autorizados o interferencias externas.
- Encuesta Activa: El dispositivo de encuesta se conecta a la red para realizar pruebas de rendimiento en el mundo real (UDP y TCP). Esto mide las tasas de datos reales, la pérdida de paquetes y la latencia. Las encuestas activas son innegociables para recintos que soportan aplicaciones en tiempo real como videoconferencias o redes de sensores IoT.
- Encuesta Predictiva (Virtual): Usando el software, los ingenieros importan un plano, definen materiales de construcción (ej., concreto, vidrio) y asignan valores de atenuación. El software modela la propagación de RF antes de instalar cualquier hardware. Esto es crítico para implementaciones nuevas (greenfield) para prevenir el sobre o subaprovisionamiento.
Métricas RF Críticas
Para asegurar una implementación robusta, su encuesta debe evaluar las siguientes métricas:
- RSSI (Indicador de Fuerza de Señal Recibida): Medido en dBm. Se requiere un mínimo de -70 dBm para conectividad general, mientras que -67 dBm o mejor es necesario para aplicaciones de voz y video.
- Relación Señal-Ruido (SNR): La diferencia entre el nivel de la señal y el nivel de ruido de fondo. Se requiere un mínimo de 25 dB SNR para una operación confiable, escalando a 30 dB+ para entornos de alta densidad.
- Utilización del Canal: Mide cuán ocupado está un canal de radio. Una alta fuerza de señal con alta utilización del canal resulta en un bajo rendimiento debido a la contención del tiempo de aire.
- Comportamiento de Roaming: Validar traspasos limpios entre APs utilizando estándares empresariales (IEEE 802.11r/k/v). Un roaming deficiente es una causa principal de conexiones caídas en entornos de hostelería y campus.
- Interferencia Co-Canal (CCI): Celdas de cobertura superpuestas en el mismo canal. El software de encuesta identifica estos conflictos, permitiendo ajustes de canal y potencia de transmisión.
Guía de Implementación
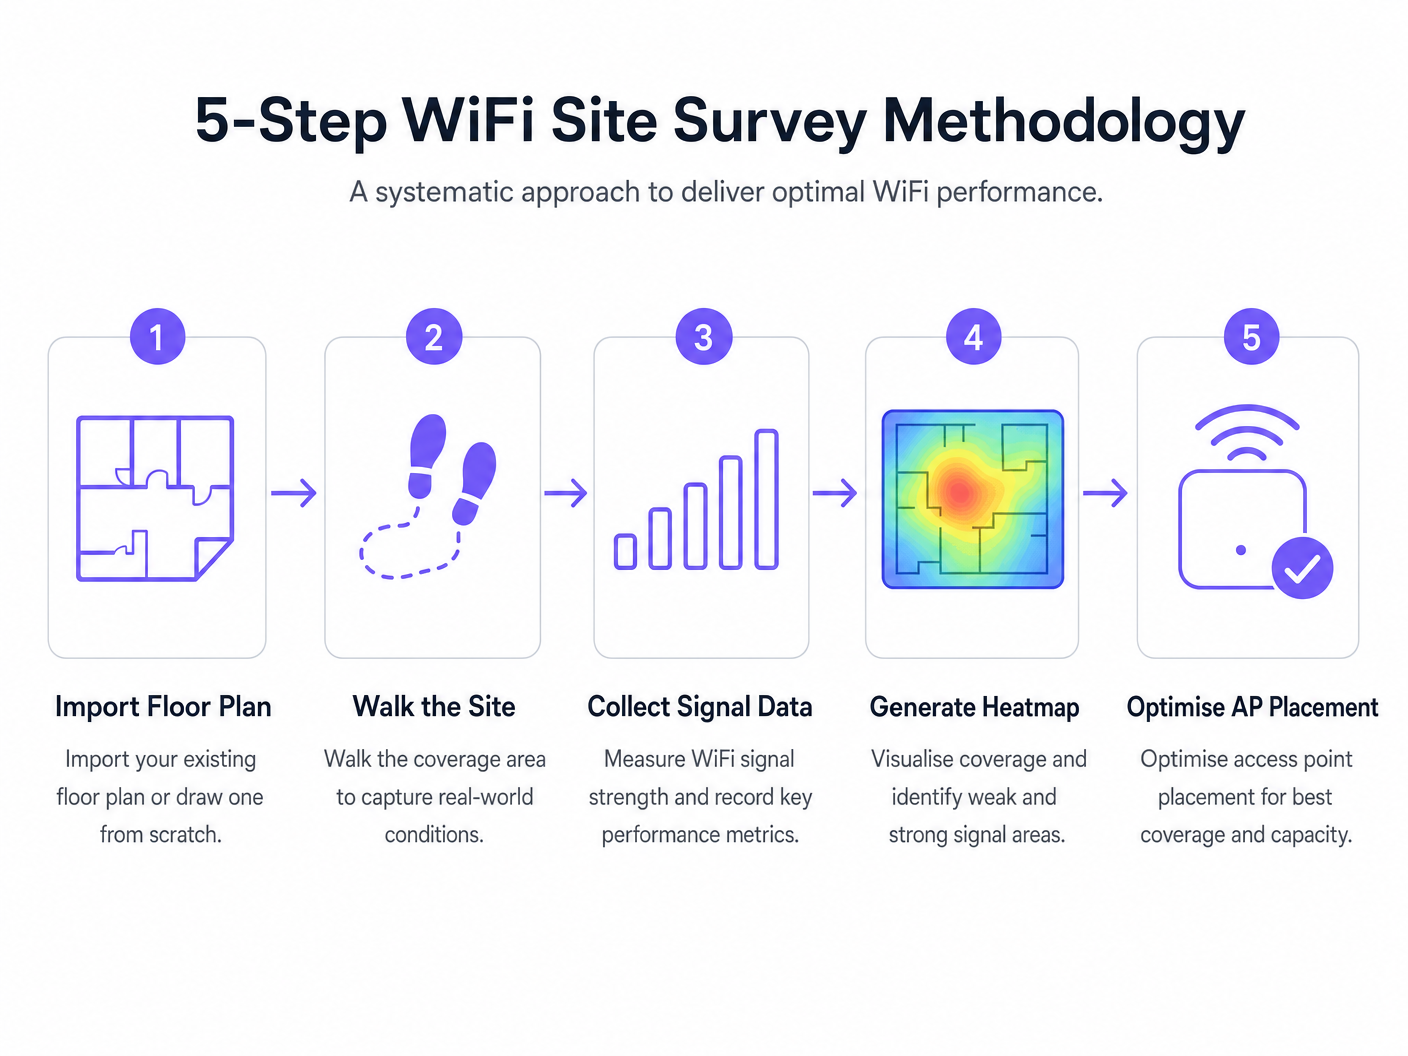
La implementación de una red inalámbrica requiere un enfoque sistemático. La siguiente metodología asegura una ubicación óptima de los AP y un rendimiento de red.
- Encuesta Predictiva Pre-Implementación: Siempre realice una encuesta predictiva antes de adquirir hardware. Confiar en calculadoras genéricas de proveedores a menudo no considera las sombras RF estructurales (ej., pilares de concreto, huecos de ascensores).
- Validar con una Encuesta Activa bajo Carga: Un recinto vacío no refleja la realidad operativa. Realice encuestas activas bajo carga de clientes simulada o real para medir el rendimiento en escenarios de alta densidad.
- Optimización Iterativa: Después de la implementación inicial, utilice encuestas activas y pasivas para ajustar la ubicación de los AP, las asignaciones de canales y la potencia de transmisión.
- Integración con Análisis: Conecte sus datos de rendimiento RF a plataformas de inteligencia de negocio. Superponer Guest WiFi y WiFi Analytics sobre una red bien encuestada le permite correlacionar la calidad de la señal con el tiempo de permanencia del visitante y el flujo de personas.
Mejores Prácticas
- Documente Todo: Un informe de encuesta es un documento vivo. Cualquier modificación a las ubicaciones de los AP, planes de canales o potencia de transmisión debe documentarse y volverse a encuestar para mantener una línea base precisa.
- Considere la Banda de 6 GHz: A medida que las implementaciones se mueven hacia WiFi 6E y WiFi 7, las metodologías de encuesta deben considerar el espectro de 6 GHz, que ofrece menor interferencia pero mayor atenuación (menor alcance).
- Establezca una Cadencia de Encuestas: Trate las encuestas de sitio como una práctica operativa continua. Los entornos RF cambian debido a nuevos inquilinos, modificaciones estructurales o cambios estacionales de ocupación. Los recintos de alta densidad deben adoptar una cadencia trimestral, mientras que las oficinas estándar pueden requerir encuestas anuales.
Solución de Problemas y Mitigación de Riesgos
- Brechas de Cobertura (Puntos Muertos): A menudo causadas por atenuación estructural imprevista. Mitigación: Confíe en encuestas predictivas validadas mediante encuestas pasivas post-implementación.
- Alta Interferencia: Redes vecinas o dispositivos que no son WiFi (p. ej., microondas, Bluetooth) que elevan el nivel de ruido. Mitigación: Utilice herramientas de análisis de espectro dentro de su software de encuestas para identificar y evitar canales congestionados.
- Clientes Pegajosos: Dispositivos que se niegan a itinerar a un AP más cercano. Mitigación: Valide la configuración 802.11r/k/v y asegúrese de que la potencia de transmisión del AP no esté configurada demasiado alta, lo que puede inflar artificialmente el tamaño de celda percibido.
ROI e Impacto Comercial
El retorno de la inversión para el software profesional de encuestas WiFi se mide en mitigación de riesgos y eficiencia operativa.
- Optimización del Gasto de Capital (CapEx): Las encuestas predictivas evitan el costoso sobredimensionamiento de APs e infraestructura de conmutación.
- Reducción del Gasto Operativo (OpEx): Una red correctamente encuestada genera menos tickets de soporte y requiere menos tiempo para solucionar problemas.
- Habilitación de Ingresos: En sectores como Retail y Hospitality , un WiFi robusto sustenta las estrategias de engagement digital, permitiendo un análisis preciso de WiFi Footfall Analytics: How to Measure and Act on Visitor Data y campañas de marketing dirigidas.
Definiciones clave
RSSI (Received Signal Strength Indicator)
A measurement of the power level being received by the client device's antenna.
Used to determine if a device is close enough to an AP to maintain a stable connection. Measured in negative decibels (dBm).
SNR (Signal-to-Noise Ratio)
The difference between the received wireless signal strength and the background RF noise.
Crucial for determining data throughput. A high SNR means a clean signal capable of supporting high data rates.
Channel Utilisation
The percentage of time a specific WiFi channel is busy transmitting data or handling interference.
High utilisation leads to network congestion and slow speeds, even if the signal strength is excellent.
Co-Channel Interference (CCI)
Interference caused when two or more APs are transmitting on the exact same channel within hearing distance of each other.
Forces APs and clients to wait their turn to transmit, severely degrading network capacity.
Attenuation
The loss of signal strength as RF waves pass through physical obstacles like walls, doors, or human bodies.
Must be accurately modelled in predictive surveys to ensure adequate coverage post-installation.
Sticky Client
A wireless device that remains connected to an AP even when a closer, stronger AP is available.
Often caused by poor roaming configuration or AP transmit power being set too high.
Predictive Survey
A software-based simulation of RF coverage using a floor plan and defined building materials, performed before hardware installation.
Used to estimate the number and placement of APs required for a new deployment.
Active Survey
A site survey where the device connects to the network to measure actual data throughput, latency, and packet loss.
Essential for validating the real-world performance of the network for the end-user.
Ejemplos resueltos
A 200-room hotel is experiencing frequent dropped WiFi calls when guests walk from the lobby to their rooms. The IT manager suspects a coverage issue, but the dashboard shows all APs are online.
- Conduct an active survey walking the exact path guests take from the lobby to the rooms.
- Monitor the roaming behaviour specifically looking for IEEE 802.11r (Fast BSS Transition) handoffs.
- Analyse the RSSI overlap between the lobby APs and the corridor APs.
- Adjust the transmit power of the lobby APs down slightly to encourage client devices to roam sooner, rather than 'sticking' to the lobby AP until the signal drops completely.
A large retail chain is rolling out a new inventory management system that relies on handheld scanners. They need to ensure seamless coverage across a 50,000 sq ft warehouse with high metal shelving.
- Perform a predictive survey importing the warehouse floor plan and explicitly defining the metal shelving as high-attenuation obstacles.
- Design the AP layout using directional antennas positioned down the aisles, rather than omnidirectional antennas that would bounce signals off the metal racks.
- Post-installation, conduct a passive survey to validate the coverage cell boundaries and ensure a minimum RSSI of -67 dBm in all aisles.
Preguntas de práctica
Q1. You are reviewing a site survey report for a new corporate office. The RSSI in the main boardroom is excellent (-55 dBm), but the SNR is only 12 dB. What is the likely impact on user experience, and what should be your next troubleshooting step?
Sugerencia: Consider the relationship between signal strength and background noise.
Ver respuesta modelo
Despite the strong signal, the low SNR (12 dB) indicates a high noise floor, likely due to interference. Users will experience slow speeds, dropped packets, and poor video call quality. The next step is to use a spectrum analyser to identify the source of the interference (e.g., a neighbouring network on the same channel, or non-WiFi devices) and change the AP's channel assignment.
Q2. A stadium deployment requires APs to be mounted 15 metres high in the roof structure. Should you use omnidirectional or directional antennas, and why?
Sugerencia: Think about how RF energy propagates from different antenna types over long distances.
Ver respuesta modelo
You should use directional antennas. Omnidirectional antennas broadcast energy in all directions (like a lightbulb), which would waste signal propagating upwards and cause massive co-channel interference across the stadium seating. Directional antennas focus the RF energy downwards into specific seating sectors (like a spotlight), increasing signal strength for users and reducing interference between APs.
Q3. During a post-installation active survey in a hospital, you notice that devices are not roaming smoothly between APs in the corridors, leading to dropped VoIP calls for nurses. What specific configuration should you verify on the wireless controller?
Sugerencia: Look for enterprise roaming standards.
Ver respuesta modelo
You should verify that IEEE 802.11r (Fast BSS Transition), 802.11k (Radio Resource Measurement), and 802.11v (BSS Transition Management) are enabled and supported by the client devices. Additionally, check that the AP transmit power is not set too high, which can create artificially large coverage cells and cause 'sticky clients'.
Continúe leyendo esta serie
Gestión de ancho de banda para WiFi de personal: modelado, QoS y reducción de tráfico
Esta guía detalla métodos prácticos para gestionar el ancho de banda para el WiFi de personal en entornos corporativos. Cubre el modelado de tráfico, la implementación de QoS y cómo el despliegue de Purple Shield reduce la carga de la red sin requerir actualizaciones de infraestructura.
¿Qué es una Solicitud de Sondeo? Entendiendo Cómo los Dispositivos Descubren Redes
Esta guía de referencia técnica ofrece un análisis profundo de las solicitudes de sondeo IEEE 802.11, el escaneo activo versus pasivo, y el impacto de la aleatorización de MAC en el análisis de ubicaciones. Proporciona estrategias de implementación prácticas para que los arquitectos de red optimicen despliegues de alta densidad, mitiguen las tormentas de sondeo y aseguren una recopilación de datos precisa y compatible con GDPR utilizando capas de identidad autenticadas.
Cómo solucionar el WiFi lento sin actualizar tu plan de internet
Una guía de referencia técnica completa para gerentes de TI y arquitectos de red sobre cómo optimizar el rendimiento del WiFi empresarial sin aumentar el ancho de banda del ISP. Cubre la sintonización de RF, la gestión de la densidad de clientes, la implementación de QoS y cómo aprovechar el análisis de WiFi para diagnosticar y resolver cuellos de botella.