WiFi para Pasajeros: Cómo los Operadores de Transporte Utilizan los Datos de WiFi para Comprender los Trayectos
Esta guía técnica explica cómo los operadores de transporte aprovechan la infraestructura de WiFi para pasajeros para capturar análisis operativos. Cubre la arquitectura técnica, las mejores prácticas de implementación y las aplicaciones en el mundo real para medir el flujo de personas, el tiempo de permanencia y los patrones de trayecto.
Escucha esta guía
Ver transcripción del podcast

Resumen Ejecutivo
Para los operadores de transporte —ya sea que gestionen redes ferroviarias interurbanas, flotas de autobuses urbanos o servicios de ferry marítimo— el WiFi para pasajeros a menudo se considera estrictamente un costo operativo o una comodidad para el pasajero. Sin embargo, cuando se integra con una capa de análisis de nivel empresarial, esta infraestructura existente se transforma en una potente herramienta de inteligencia operativa. Al capturar metadatos de conexión de dispositivos, los operadores pueden mapear el flujo de personas, medir los tiempos de permanencia en las zonas de la estación y rastrear los patrones de trayecto sin depender únicamente de los datos de venta de boletos.
Esta guía proporciona a los gerentes de TI, arquitectos de red y directores de operaciones un marco práctico para implementar y aprovechar el análisis de WiFi para pasajeros. Exploramos la arquitectura técnica subyacente necesaria para capturar señales de dispositivos de forma segura, los casos de uso operativos que ofrecen un ROI medible y los requisitos de cumplimiento necesarios para procesar estos datos dentro de los marcos de GDPR y protección de datos.
Escuche el informe de nuestro consultor sénior sobre este tema:
Análisis Técnico Detallado: Arquitectura y Flujo de Datos
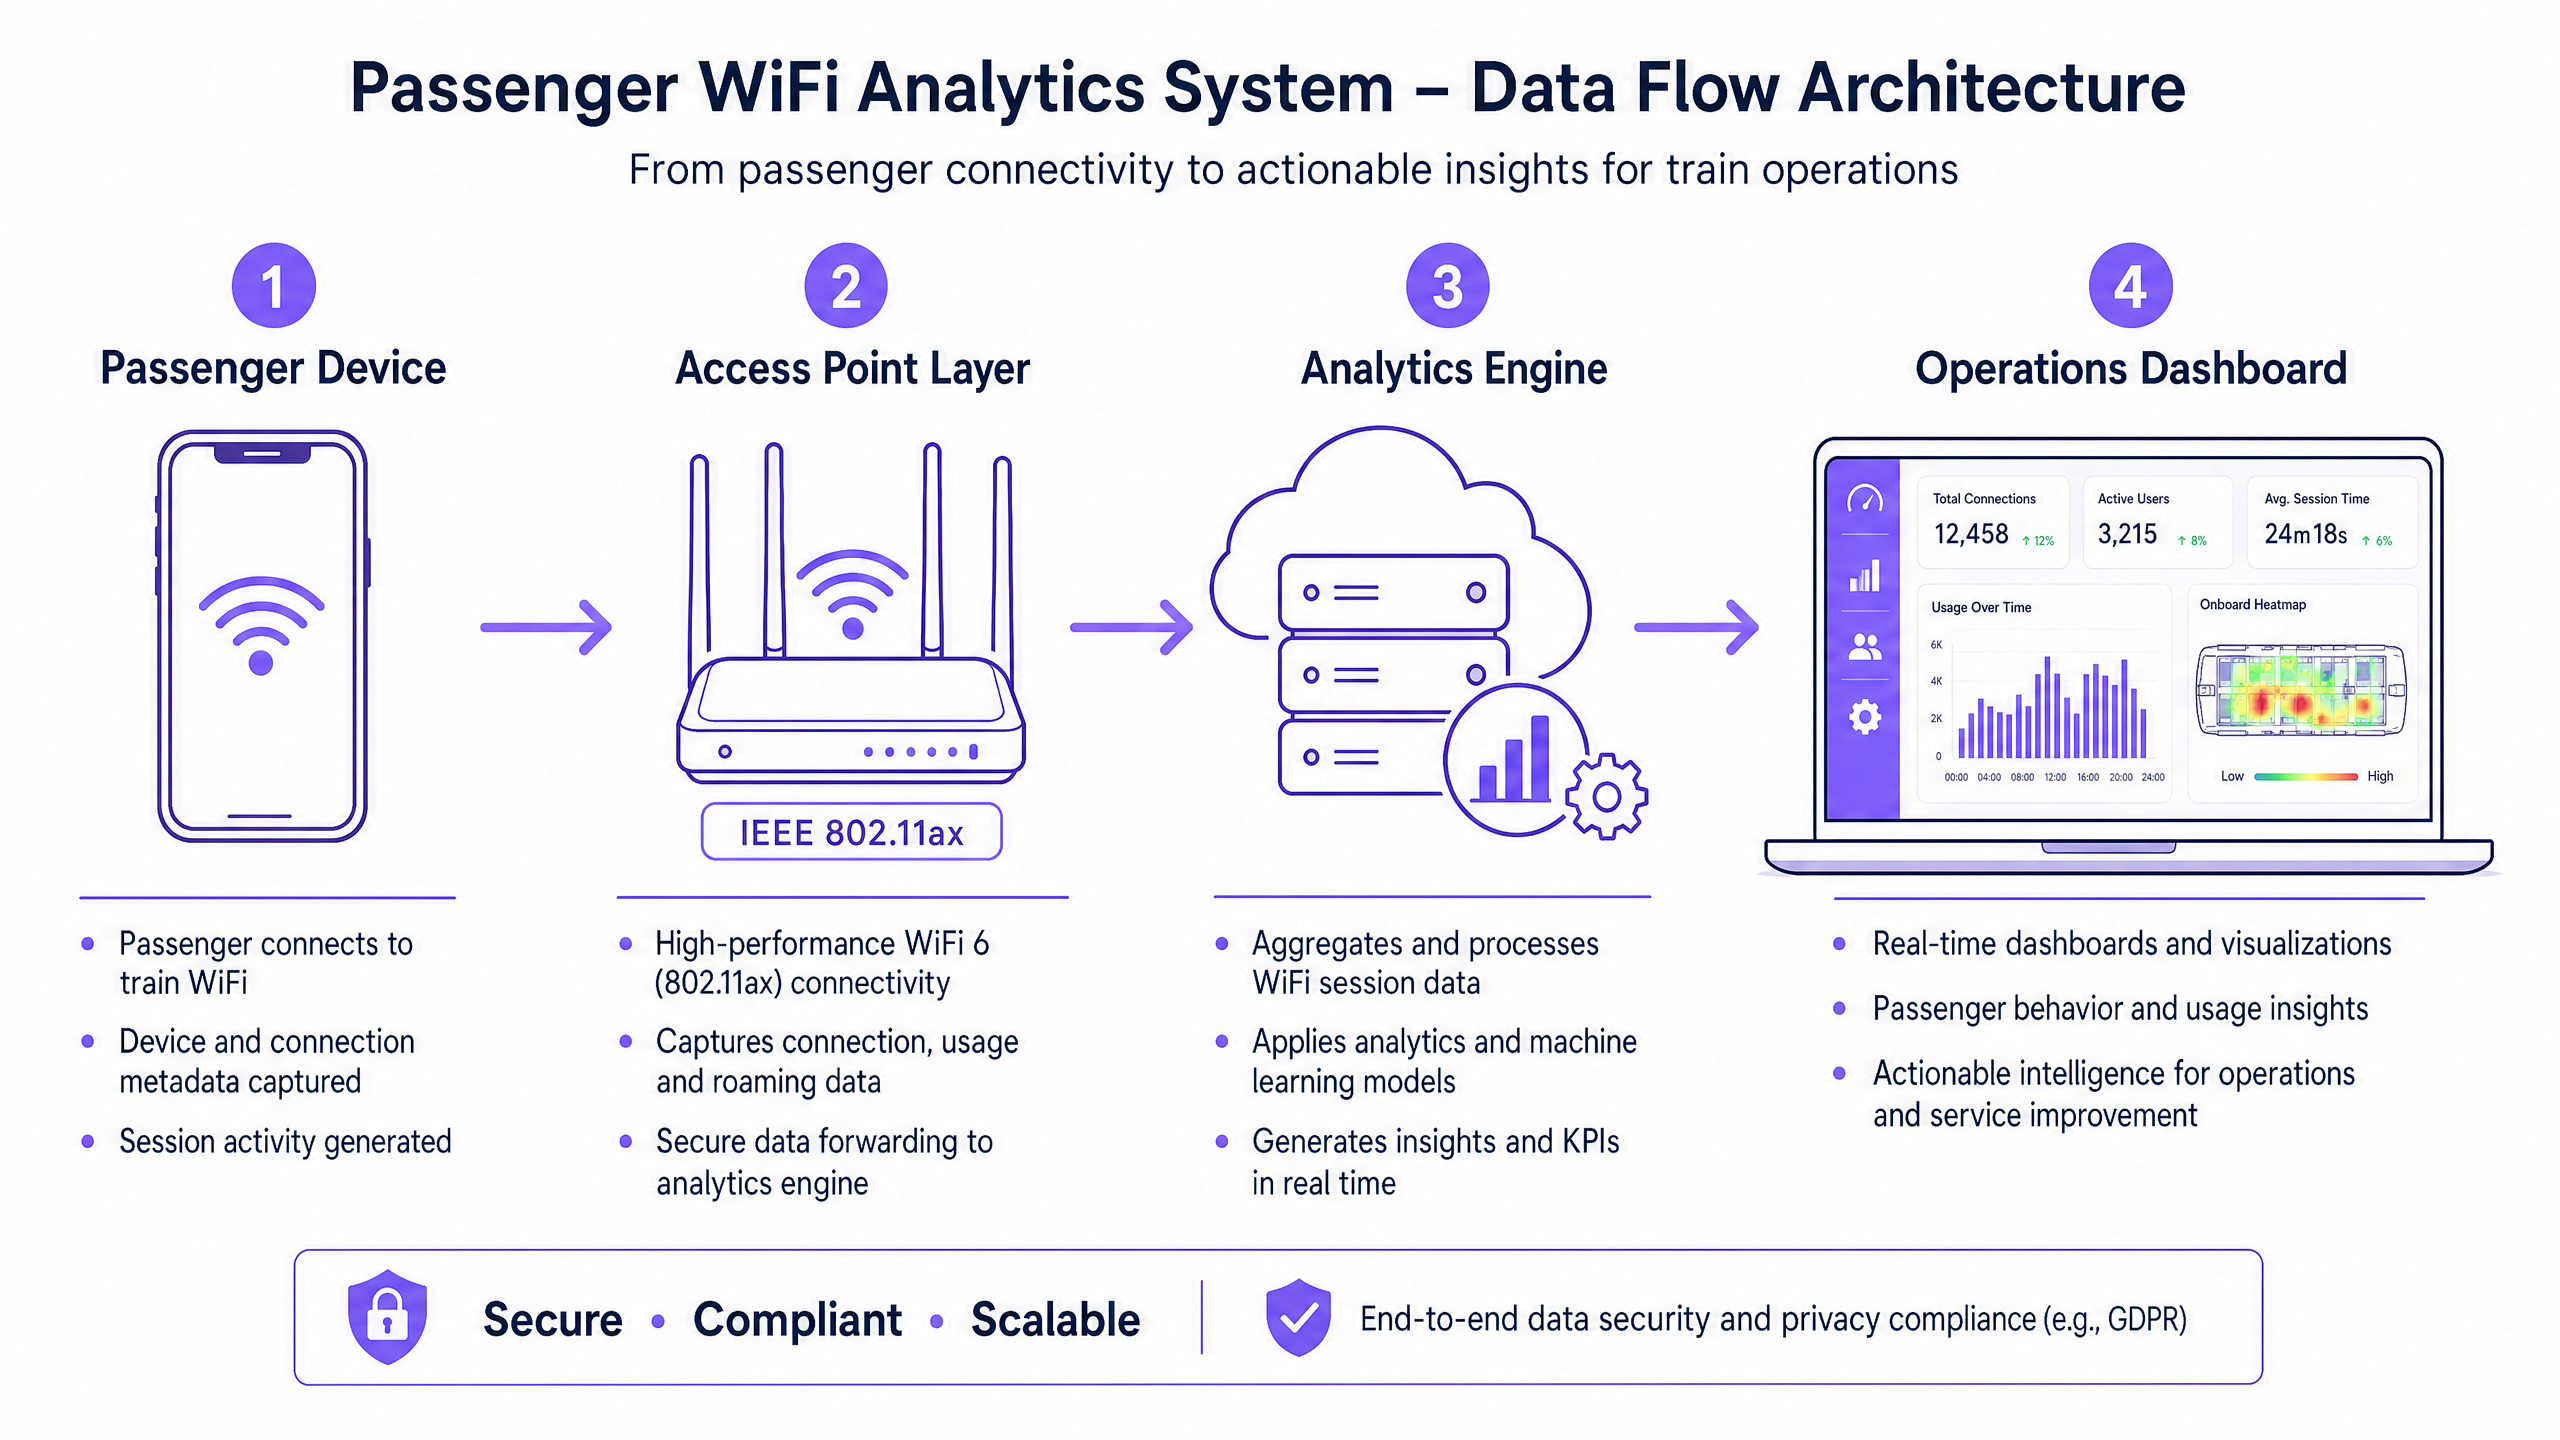
La base de cualquier capacidad de análisis de WiFi para pasajeros es la habilidad de la red para capturar y procesar metadatos de dispositivos de forma segura. La arquitectura típicamente consta de cuatro capas principales:
- Capa de Puntos de Acceso (Borde): Hardware físico implementado en estaciones y material rodante. Las implementaciones modernas que aprovechan IEEE 802.11ax (WiFi 6) proporcionan soporte para clientes de alta densidad y capturan metadatos esenciales, incluyendo direcciones MAC, fuerza de la señal (RSSI) y marcas de tiempo de conexión.
- Capa de Recopilación de Datos (Controlador): Un controlador centralizado gestionado en la nube agrega registros de sesión brutos y traspasos de roaming desde la capa de puntos de acceso.
- Motor de Análisis: Plataformas como la capa de WiFi Analytics de Purple procesan los registros brutos, aplicando modelos de aprendizaje automático para filtrar dispositivos del personal y señales transitorias, transformando los datos brutos en métricas significativas (por ejemplo, tiempo de permanencia, flujo de personas).
- Panel de Operaciones: La capa de visualización donde los planificadores de red y los gerentes de estación consumen información a través de paneles en tiempo real y mapas de calor.
Superando la Aleatorización de MAC
Un desafío técnico crítico en el análisis moderno de WiFi es la aleatorización de direcciones MAC. Desde iOS 14 y Android 10, los dispositivos aleatorizan sus direcciones MAC por red para mejorar la privacidad. Si bien esto no afecta las métricas agregadas de flujo de personas o tiempo de permanencia (ya que la sesión permanece consistente durante una sola visita), limita la capacidad de rastrear visitantes recurrentes de forma anónima a lo largo del tiempo.
La solución arquitectónica es el Guest WiFi autenticado. Al dirigir a los usuarios a través de un Captive Portal que requiere autenticación (por ejemplo, correo electrónico o inicio de sesión social), el sistema crea un perfil de usuario persistente y consentido. Este perfil vincula los datos de la sesión a un usuario conocido, eludiendo las limitaciones de la aleatorización de MAC y manteniendo un estricto cumplimiento de las regulaciones de protección de datos.
Guía de Implementación: De la Infraestructura a los Insights
La implementación de análisis de WiFi para pasajeros requiere un enfoque estructurado para garantizar la precisión de los datos y la seguridad de la red.
- Realice Auditorías RF Exhaustivas: La precisión del análisis depende completamente de la cobertura de la red. Las zonas muertas en las explanadas o andenes de las estaciones resultan en sesiones caídas y datos de trayecto fragmentados. Realice estudios de sitio RF exhaustivos para asegurar una cobertura contigua en todas las zonas de pasajeros.
- Estandarice la Integración de Datos: Las redes de transporte a menudo presentan hardware heterogéneo (por ejemplo, Cisco Meraki en estaciones, diferentes proveedores en material rodante). Implemente una capa de API agnóstica al proveedor para normalizar los registros de sesión antes de que lleguen al motor de análisis.
- Implemente Controles de Seguridad Robustos: Las redes orientadas a pasajeros son superficies de ataque de alto riesgo. Aplique WPA3 donde la compatibilidad del cliente lo permita, implemente un estricto aislamiento de clientes (aislamiento de Capa 2) para prevenir el movimiento lateral entre dispositivos de pasajeros, y despliegue filtrado DNS para bloquear dominios maliciosos. Para más información sobre cómo asegurar estos entornos, revise nuestra guía Proteja su Red con DNS y Seguridad Robustos .
- Defina la Arquitectura Zonal: Segmente sus ubicaciones físicas en zonas lógicas (por ejemplo, explanada, área comercial, andén). Esto permite un análisis granular del tiempo de permanencia, permitiendo a los operadores diferenciar entre un pasajero navegando en una zona comercial y uno esperando en un andén durante un retraso del servicio.
Mejores Prácticas y Casos de Uso Operativos
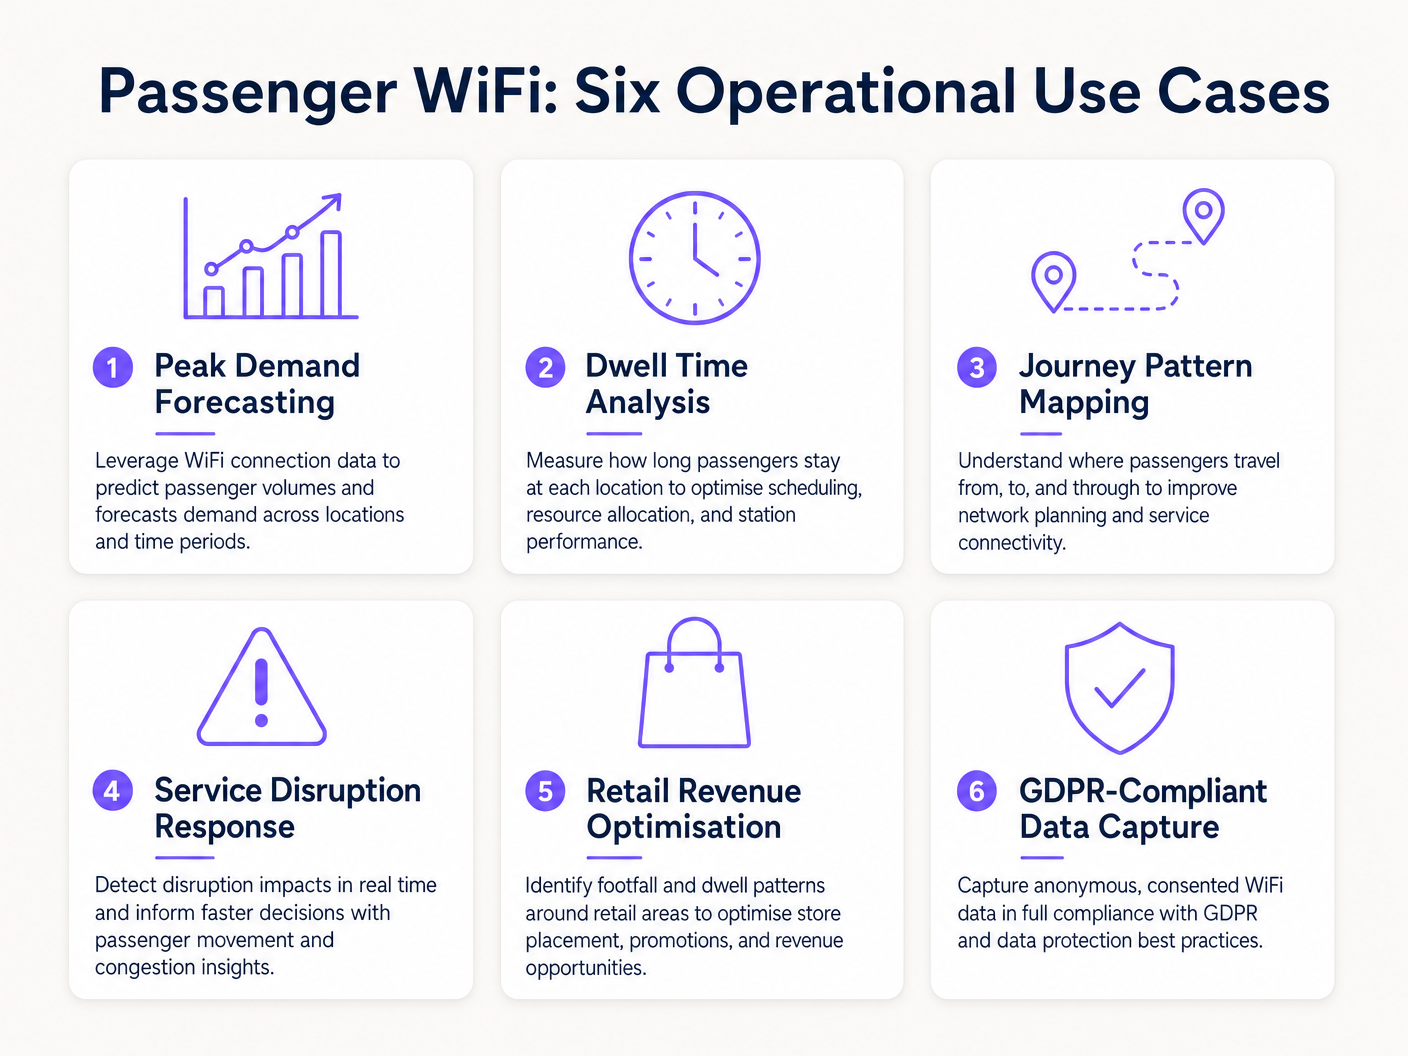
Los operadores de transporte están aprovechando el análisis de WiFi para impulsar la eficiencia en múltiples dominios operativos. De manera similar a cómo los establecimientos en Retail y Hospitality utilizan los datos de flujo de personas para optimizar la dotación de personal, los operadores de transporte utilizan estos insights para gestionar la demanda máxima.
Caso de Estudio Real: Red Ferroviaria Interurbana
Un importante operador ferroviario interurbano del Reino Unido implementó análisis de WiFi en doce estaciones terminales para abordar la congestión de andenes. Al correlacionar los picos de conexión WiFi con los horarios de salida de los trenes, el equipo de operaciones identificó que andenes específicos experimentaban aglomeraciones peligrosas 40 minutos antes de la salidre. Los datos revelaron que los pasajeros llegaban antes de lo previsto debido a una señalización digital poco clara en la sala principal. Al ajustar el momento de los anuncios de andén en los paneles de salidas, el operador agilizó el flujo de pasajeros, reduciendo la densidad máxima del andén en un 22% y mejorando la seguridad general.
Caso de Estudio Real: Operaciones de Terminal de Ferry
Un operador regional de transbordadores que gestiona un alto volumen de tráfico de verano utilizó el análisis de tiempo de permanencia de WiFi para optimizar su estrategia minorista en la terminal. El panel de análisis destacó que los pasajeros que esperaban cruces retrasados tenían un tiempo de permanencia promedio de 45 minutos en la terminal, pero solo el 12% ingresaba a la zona minorista secundaria. Al reubicar la señalización digital y activar notificaciones push automatizadas a través del captive portal que ofrecían un descuento en café durante los retrasos, el operador aumentó la conversión minorista en un 18% durante los eventos de interrupción.
Resolución de Problemas y Mitigación de Riesgos
Al implementar el análisis de WiFi para pasajeros, los equipos de TI deben mitigar varios modos de falla comunes:
- Dilución de Datos por Dispositivos del Personal: No filtrar los dispositivos del personal (por ejemplo, equipos de limpieza, personal de tiendas) distorsiona significativamente las métricas de tiempo de permanencia. Implemente un filtrado estricto de direcciones MAC o SSIDs dedicados para el personal para asegurar que los datos de los pasajeros permanezcan limpios.
- Fallos de Cumplimiento: La captura de datos de dispositivos sin consentimiento explícito o una base legal documentada viola el GDPR. Asegúrese de que su captive portal articule claramente la política de procesamiento de datos y capture el consentimiento explícito cuando sea necesario.
- Cuellos de Botella en el Backhaul: Los sistemas a bordo que dependen de backhaul celular (LTE/5G) a menudo sufren de restricciones de ancho de banda. Asegúrese de que su arquitectura almacene en búfer los datos de análisis localmente durante las caídas de conectividad y se sincronice asincrónicamente para evitar la pérdida de datos sin afectar las velocidades de navegación de los pasajeros.
ROI e Impacto Comercial
El retorno de la inversión para el análisis de WiFi de pasajeros se extiende mucho más allá del departamento de TI. Al tratar la red como un activo de inteligencia, los operadores pueden:
- Optimizar la Asignación de Recursos: Alinear el personal de la estación, los horarios de limpieza y las patrullas de seguridad con datos empíricos de afluencia en lugar de horarios estáticos.
- Mejorar los Ingresos Minoristas: Proporcionar a los inquilinos minoristas métricas precisas de afluencia y conversión, justificando tarifas de arrendamiento premium en zonas de alto tráfico.
- Mejorar la Experiencia del Pasajero: Identificar puntos de fricción en el recorrido de la estación y gestionar proactivamente las aglomeraciones, de manera similar a cómo el sector de Healthcare utiliza tecnología similar para comprender el flujo de pacientes. Para obtener contexto sobre aplicaciones interindustriales, consulte How WiFi Can Improve Patient Experience in Hospitals .
Al integrar el análisis de WiFi en la estrategia operativa central, los operadores de transporte en el sector de Transport pueden pasar de una gestión reactiva a una prestación de servicios proactiva y basada en datos.
Definiciones clave
MAC Address Randomisation
A privacy feature in modern operating systems (iOS, Android) that generates a temporary, random MAC address for each WiFi network the device connects to.
IT teams must account for this as it prevents the tracking of repeat visitors using only hardware identifiers, necessitating captive portal authentication.
Dwell Time
The total duration a device remains connected or visible to the WiFi network within a specific physical zone.
Used by operations directors to measure how long passengers wait on platforms or spend in retail areas, directly impacting commercial and safety planning.
Captive Portal
A web page that users must view and interact with before being granted access to a public WiFi network.
The primary mechanism for capturing user consent, enforcing terms of service, and collecting first-party marketing data.
IEEE 802.11ax (WiFi 6)
The current standard for wireless networks, designed to improve performance in high-density environments.
Essential for transport hubs like stadiums and train stations where thousands of devices attempt to connect simultaneously.
RSSI (Received Signal Strength Indicator)
A measurement of the power present in a received radio signal.
Analytics engines use RSSI values from multiple access points to triangulate a device's physical location within a venue.
Client Isolation
A security feature that prevents devices connected to the same WiFi network from communicating directly with each other.
Critical for public passenger WiFi to prevent malicious actors from scanning or attacking other users' devices on the network.
Footfall
The total number of unique devices detected by the WiFi network within a specific timeframe.
Provides station managers with an accurate proxy for total passenger volume, independent of ticket sales.
Cellular Backhaul
The use of cellular networks (LTE/5G) to connect a local WiFi network (like on a bus or train) back to the internet.
The primary ongoing operational cost (OPEX) for onboard WiFi deployments, requiring careful bandwidth management.
Ejemplos resueltos
A major train station operator is experiencing severe congestion on Platform 4 during the evening peak. They need to understand where these passengers are originating from within the station (e.g., main concourse vs. retail zone) to improve flow.
- Deploy high-density IEEE 802.11ax access points across the concourse, retail zones, and Platform 4 to ensure contiguous coverage.
- Configure the analytics platform to define logical 'Zones' for each area.
- Analyse the 'Zone-to-Zone Transition' reports in the analytics dashboard during the 16:00-19:00 window.
- Identify the primary origin zones for devices arriving at Platform 4.
- If the data shows a bottleneck originating from the retail zone corridor, operations can deploy staff to redirect flow or update digital signage to route passengers through a secondary concourse entrance.
A regional bus operator wants to offer free onboard WiFi but needs to justify the cellular backhaul costs to the commercial director by capturing marketing data.
- Implement a cloud-managed captive portal for the onboard WiFi network.
- Configure the portal to require authentication via email or social login (e.g., Facebook, Google).
- Ensure the portal includes a clear, GDPR-compliant privacy notice and opt-in checkboxes for marketing communications.
- Integrate the captive portal data capture directly with the operator's CRM or email marketing platform via API.
- Track the volume of new marketing opt-ins generated per route and calculate the equivalent cost-per-acquisition (CPA) to justify the backhaul OPEX.
Preguntas de práctica
Q1. Your ferry terminal has deployed WiFi analytics, but the average dwell time in the main waiting lounge is reporting as 8.5 hours, which is impossible given your sailing schedule. What is the most likely cause and how do you fix it?
Sugerencia: Consider what other devices might be permanently located in or near the waiting lounge.
Ver respuesta modelo
The analytics engine is likely capturing static devices (e.g., smart TVs, digital signage, point-of-sale systems) or staff devices that remain in the lounge all day. The solution is to identify the MAC addresses of these known devices and configure the analytics platform to filter them out of the dataset.
Q2. A bus operator wants to track how many passengers travel the full length of a specific route versus hopping off early. They are relying purely on anonymous MAC address tracking from the onboard access point. Why might this data be inaccurate?
Sugerencia: Think about how modern smartphones handle network connections to protect privacy.
Ver respuesta modelo
Modern smartphones use MAC address randomisation. While connected to the bus WiFi, the session is tracked accurately. However, if a device disconnects (e.g., goes to sleep) and reconnects later on the route, it may present a new MAC address, making it appear as a new passenger rather than a continuing journey. Implementing a captive portal for authentication is required to track persistent journeys accurately.
Q3. You are deploying WiFi across a large train station with a high-density concourse. To ensure secure data capture and protect passengers, what two critical network security configurations must be enabled on the public SSID?
Sugerencia: One prevents devices from talking to each other; the other prevents access to malicious sites.
Ver respuesta modelo
- Client Isolation (Layer 2 isolation) must be enabled to prevent passenger devices from communicating with or attacking each other on the local network. 2. DNS Filtering should be deployed to block access to known malicious domains, phishing sites, and inappropriate content.
Continúe leyendo esta serie
Privacidad desde el Diseño: Anonimización de Datos WiFi para el Cumplimiento del GDPR
Esta guía autorizada detalla la arquitectura técnica y las estrategias de implementación para anonimizar datos WiFi y asegurar el cumplimiento del GDPR. Proporciona a los líderes de TI y arquitectos de red marcos de trabajo accionables para equilibrar análisis robustos de recintos con estrictos requisitos de privacidad de datos.
Heatmapping vs Presence Analytics: Diferencias Técnicas
Esta guía técnica autorizada detalla las diferencias arquitectónicas y operativas críticas entre el WiFi heatmapping y el presence analytics para operadores de recintos empresariales. Proporciona a los líderes de TI, arquitectos de red y directores de operaciones marcos de implementación accionables, escenarios de implementación reales y mejores prácticas neutrales al proveedor para extraer el máximo ROI de su infraestructura inalámbrica existente.
Cómo calcular el tiempo de permanencia utilizando análisis de ubicación WiFi
Esta guía ofrece una referencia técnica completa para calcular el tiempo de permanencia WiFi utilizando análisis de ubicación WiFi, cubriendo la arquitectura completa desde la captura de solicitudes de sondeo 802.11, pasando por la trilateración basada en RSSI, hasta el análisis de zonas geocercadas. Está diseñada para gerentes de TI, arquitectos de redes y directores de operaciones de recintos que necesitan implementar inteligencia de ubicación precisa y escalable en entornos minoristas, hoteleros, de atención médica y del sector público. Los lectores obtendrán orientación de implementación práctica, estudios de casos reales y un marco claro para traducir datos espaciales brutos en resultados comerciales medibles.