शॉपिंग सेंटर्स रिटेलर्सना आकर्षित करण्यासाठी आणि टिकवून ठेवण्यासाठी WiFi Analytics चा वापर कसा करतात
हे अधिकृत तांत्रिक संदर्भ मार्गदर्शक स्पष्ट करते की शॉपिंग सेंटर IT टीम्स आणि प्रॉपर्टी मॅनेजर्स फूटफॉल डेटा कॅप्चर करण्यासाठी, झोननुसार ड्वेल टाइम मोजण्यासाठी आणि भाडेतत्त्वावर बोलणी करण्यासाठी, प्रीमियम रिटेलर्सना टिकवून ठेवण्यासाठी आणि नवीन भाडेकरूंना आकर्षित करण्यासाठी आवश्यक असलेला प्रायोगिक पुरावा तयार करण्यासाठी WiFi analytics चा वापर कसा करतात. यामध्ये AP डिप्लॉयमेंट आणि MAC-layer डेटा कॅप्चरपासून ते GDPR-सुसंगत analytics डॅशबोर्ड्सपर्यंतचा संपूर्ण तांत्रिक स्टॅक समाविष्ट आहे, ज्यामध्ये या तिमाहीत अंमलबजावणीसाठी तयार असलेल्या IT व्यावसायिकांसाठी ठोस व्यावहारिक उदाहरणे आणि निर्णय फ्रेमवर्क दिले आहेत.
हे मार्गदर्शक ऐका
पॉडकास्ट ट्रान्सक्रिप्ट पहा
📚 आमच्या मुख्य मालिकेचा भाग: WiFi Analytics Guide →
मुख्य सारांश (Executive Summary)
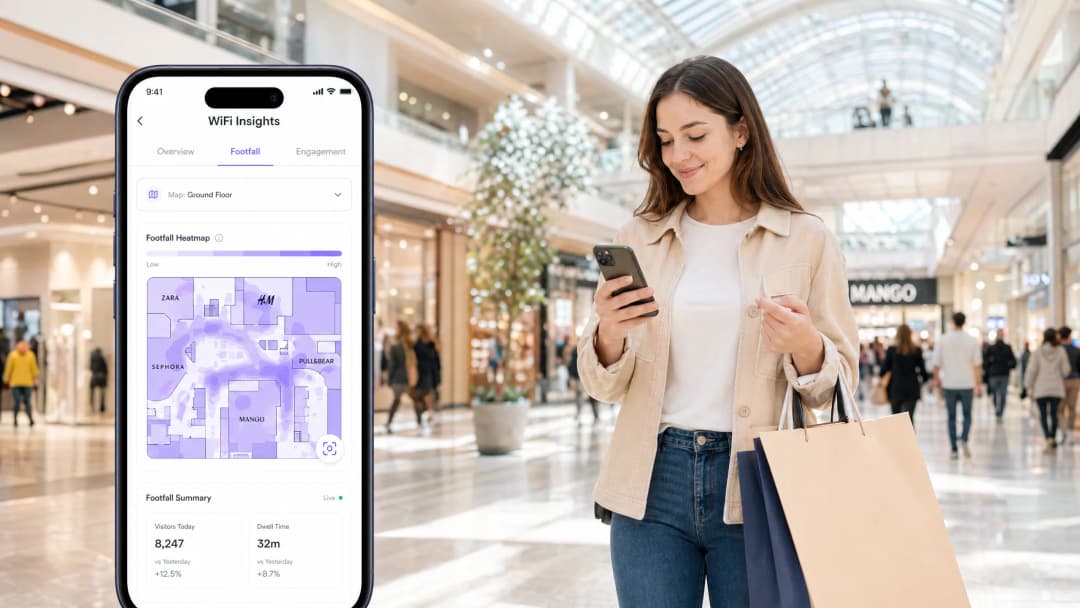
आधुनिक शॉपिंग सेंटर्ससाठी, वायरलेस नेटवर्क ही केवळ पाहुण्यांसाठीची सोय राहिलेली नाही - तर ती प्रत्यक्ष ठिकाणाची प्राथमिक टेलिमेट्री प्रणाली आहे. एक मजबूत Guest WiFi इन्फ्रास्ट्रक्चर आणि एंटरप्राइझ-ग्रेड WiFi Analytics प्लॅटफॉर्मचा वापर करून, ठिकाणाचे ऑपरेटर निष्क्रिय वायरलेस सिग्नल्सचे रूपांतर प्रत्यक्ष उपयोगी पडणाऱ्या व्यावसायिक माहितीमध्ये करतात.
हे मार्गदर्शक अत्यंत अचूक फूटफॉल आणि ड्वेल (थांबण्याची वेळ) मेट्रिक्स कॅप्चर करण्यासाठी आवश्यक असणारे तांत्रिक आर्किटेक्चर, डिप्लॉयमेंट स्ट्रॅटेजी आणि डेटा वापरण्याच्या पद्धती तपशीलवार सांगते. IT मॅनेजर्स, नेटवर्क आर्किटेक्ट्स आणि CTOs साठी, मुख्य उद्दिष्ट स्पष्ट आहे: एक लवचिक, हाय-डेन्सिटी नेटवर्क तयार करणे जे केवळ युझर्सना उच्च थ्रूपूट देत नाही तर भाडेपट्टी आणि व्यावसायिक टीम्सना ROI सिद्ध करण्यासाठी, भाडेपट्टीचे मूल्य योग्य ठरवण्यासाठी आणि पहिल्या श्रेणीतील retail भाडेकरूंना आकर्षित करण्यासाठी आवश्यक असलेली अचूक स्थानविषयक माहिती (spatial data) देखील प्रदान करते. हेच नियम hospitality , transport , आणि healthcare वातावरणातही लागू होतात, जिथे स्थानविषयक माहिती (spatial intelligence) ऑपरेशनल आणि व्यावसायिक निर्णय घेण्यास मदत करते.
तांत्रिक सखोल विश्लेषण (Technical Deep-Dive)
WiFi डेटा संकलन कसे कार्य करते
शॉपिंग सेंटर WiFi ॲनालिटिक्सचा पाया म्हणजे परिसरातील क्लायंट डिव्हाइसेस शोधण्याची आणि ट्रॅक करण्याची क्षमता आहे. समांतर चालणाऱ्या दोन प्राथमिक यंत्रणांद्वारे हे साध्य केले जाते.
प्रेझेन्स ॲनालिटिक्स (प्रमाणित नसलेले - Unauthenticated): परिचित नेटवर्क शोधण्यासाठी स्मार्टफोन्सद्वारे पाठवले जाणारे IEEE 802.11 प्रोब विनंत्यांचे ॲक्सेस पॉइंट्स (APs) सतत निरीक्षण करत असतात. MAC ॲड्रेस कॅप्चर करून - जे GDPR अनुपालन राखण्यासाठी वन-वे क्रिप्टोग्राफिक फंक्शन्स वापरून त्वरित हॅश केले जातात - आणि एकाच वेळी अनेक APs कडून मिळालेल्या रिसीव्हड सिग्नल स्ट्रेंथ इंडिकेटर (RSSI) चे मोजमाप करून, ही प्रणाली डिव्हाइसची जवळीक आणि हालचाल यांचा अंदाज लावते. हे एकूण फूटफॉलसाठी एक मूळ मेट्रिक प्रदान करते, ज्यामध्ये नेटवर्कशी थेट कनेक्ट न होणाऱ्या अभ्यागतांचाही समावेश होतो. हा तो "पादचारी" किंवा जवळून जाणाऱ्या लोकांचा आकडा आहे ज्याचा वापर प्रॉपर्टी मॅनेजर्स जास्त रहदारी असलेल्या कॉरिडॉर्सचे व्यावसायिक मूल्य सिद्ध करण्यासाठी करतात.
प्रमाणित सेशन्स (Authenticated Sessions): जेव्हा एखादा वापरकर्ता Captive Portal द्वारे सक्रियपणे कनेक्ट होतो, तेव्हा संबंधित ठिकाण स्पष्ट संमतीच्या आधारावर प्रथम-पक्ष डेटा - जसे की लोकसंख्याशास्त्र, ईमेल पत्ते आणि CRM इंटिग्रेशन हुक्स - गोळा करते. यामुळे डेटा मॉडेल अनामित डिव्हाइस ट्रॅकिंगवरून समृद्ध ग्राहक प्रोफाइलिंगमध्ये बदलते. OpenRoaming (Hotspot 2.0 / Passpoint) चे एकत्रीकरण, जिथे Purple हे कनेक्ट परवान्यांतर्गत विनामूल्य ओळख प्रदाता (Identity Provider) म्हणून कार्य करते, पारंपारिक स्प्लॅश पेजेसशिवाय अखंड आणि सुरक्षित ऑनबोर्डिंग सुलभ करते. यामुळे प्रमाणित सेशन्सचे प्रमाण मोठ्या प्रमाणात वाढते आणि व्यावसायिक विश्लेषणासाठी अधिक समृद्ध आणि सांख्यिकीयदृष्ट्या मजबूत डेटासेट मिळतो.
अवकाशीय त्रिकोणीकरण (Spatial Triangulation) आणि झोन अचूकता
केवळ संपूर्ण ठिकाणाच्या एकत्रित डेटाऐवजी - विशिष्ट रिटेल झोनसाठी महत्त्वपूर्ण डेटा प्रदान करण्यासाठी - नेटवर्कने परिभाषित क्षेत्रातील डिव्हाइसेसचे स्थान अचूकपणे शोधणे आवश्यक आहे. यासाठी ट्रायलेटरेशन (trilateration) आवश्यक आहे: फ्लोअर प्लॅनवर डिव्हाइसचे स्थान मोजण्यासाठी एकाच वेळी किमान तीन ॲक्सेस पॉइंट्सवरून RSSI रीडिंग वापरण्याची ही प्रक्रिया आहे. या प्रक्रियेची अचूकता थेट AP च्या घनतेशी (density) संबंधित असते.
लोकेशन विश्लेषणासाठी मानक कव्हरेज-मॉडेल उपयोजन (दर १,००० ते १,५०० स्क्वेअर फूटमागे एक AP) अपुरे आहे. लोकेशन-ऑप्टिमाइझ्ड उपयोजनासाठी सामान्यत: मुख्य ट्रॅकिंग झोनमध्ये दर ५०० ते ७०० स्क्वेअर फूटमागे एक AP आवश्यक असतो, तसेच सेलचे आकार पुरेसे लहान राहून अचूक अवकाशीय रिझोल्यूशन मिळण्यासाठी ट्रान्समिट पॉवर सेटिंग्जकडे काळजीपूर्वक लक्ष देणे आवश्यक आहे.
| उपयोजन मॉडेल | AP घनता | मुख्य वापर प्रकरण (Use Case) | लोकेशन अचूकता |
|---|---|---|---|
| कव्हरेज | दर १,५०० स्क्वेअर फूटमागे १ | मूलभूत कनेक्टिव्हिटी | काहीही नाही |
| क्षमता | दर ८०० स्क्वेअर फूटमागे १ | हाय-थ्रूपुट इव्हेंट्स | कमी |
| लोकेशन विश्लेषण | दर ५०० स्क्वेअर फूटमागे १ | फूटफॉल आणि ड्वेल ट्रॅकिंग | उच्च (±३-५ मीटर) |
इन्फ्रास्ट्रक्चर अज्ञेयवाद (Infrastructure Agnosticism) आणि एकत्रीकरण आर्किटेक्चर
Purple सह आधुनिक विश्लेषण प्लॅटफॉर्म्स, विद्यमान एंटरप्राइझ वायरलेस इन्फ्रास्ट्रक्चरवर ओव्हरले म्हणून काम करतात. ते मानक प्रोटोकॉलद्वारे विद्यमान Cisco, Aruba, Meraki, आणि Ruckus वायरलेस लॅन कंट्रोलर्स (WLCs) सोबत समाकलित होतात. WLCs हे प्रेझेन्स डेटा - सामान्यत: syslog, SNMP ट्रॅप्स किंवा विक्रेत्या-विशिष्ट APIs द्वारे - क्लाउड विश्लेषण इंजिनकडे पाठवतात. यामुळे त्वरित हार्डवेअर बदलण्याची आवश्यकता उरत नाही, ज्यामुळे कंपन्यांना त्यांच्या विद्यमान भांडवली गुंतवणुकीचा लाभ घेता येतो आणि हळूहळू विश्लेषणाचा स्तर जोडता येतो.
उच्च-घनतेच्या विश्लेषण उपयोजनांमधून वाढलेल्या डेटा थ्रूपुटला समर्थन देण्यासाठी लीज्ड लाईन वर अपग्रेड करण्याचा विचार करत असलेल्या ठिकाणांसाठी, रिअल-टाइम डॅशबोर्ड अपडेट्ससाठी सातत्यपूर्ण लेटन्सी सुनिश्चित करण्यासाठी समर्पित सममितीय (symmetric) कनेक्शनची अत्यंत शिफारस केली जाते.

अंमलबजावणी मार्गदर्शिका
लोकेशन-अवेअर वायरलेस नेटवर्क उपयोजित करण्यासाठी चार वेगवेगळ्या टप्प्यांवर काळजीपूर्वक नियोजन करणे आवश्यक आहे.
टप्पा १ - RF नियोजन आणि साईट सर्व्हे: कोणतेही हार्डवेअर इन्स्टॉल करण्यापूर्वी, RF पर्यावरणाचे मॉडेल तयार करण्यासाठी Ekahau Pro किंवा AirMagnet सारख्या प्रेडिक्टिव्ह सर्व्हे टूल्सचा वापर करा. इमारतीच्या बांधकामासाठी वापरलेल्या साहित्यामुळे होणाऱ्या ॲटेन्युएशनचा (attenuation) विचार करा - काचेची छते, मेटल रिटेल फिक्स्चर आणि काँक्रीटचे स्ट्रक्चरल कॉलम हे सर्व मल्टिपाथ इंटरफेरन्स निर्माण करतात ज्यामुळे RSSI-आधारित लोकेशन कॅल्क्युलेशन बिघडते. प्रत्येक झोनसाठी आवश्यक असलेली अचूकता निश्चित करा आणि त्यानुसार AP प्लेसमेंट ग्रिड स्थापित करण्यासाठी मागून पुढे काम करा.
टप्पा २ - हार्डवेअर डिप्लॉयमेंट आणि कॉन्फिगरेशन: प्रेडिक्टिव्ह सर्व्हेनुसार APs इन्स्टॉल करा, त्यानंतर मॉडेलनुसार प्रत्यक्ष जगातील RSSI रीडिंग्सची पडताळणी करण्यासाठी ॲक्टिव्ह साईट सर्व्हे करा. रेडिओ रिसोर्स मॅनेजमेंट (RRM) कॉन्फिगर करा परंतु सेलचे आकार लहान ठेवण्यासाठी ट्रान्समिट पॉवरवर कडक मर्यादा - साधारणपणे १४ ते १७ dBm - लागू करा. VLAN सेगमेंटेशनद्वारे गेस्ट SSID कॉर्पोरेट आणि POS नेटवर्कपासून आयसोलेटेड असल्याची खात्री करा, जेणेकरून PCI-DSS आवश्यकतांचे पालन होईल.
टप्पा ३ - ॲनालिटिक्स प्लॅटफॉर्म इंटिग्रेशन: WLC ला Purple ॲनालिटिक्स प्लॅटफॉर्मशी कनेक्ट करा. डॅशबोर्डमध्ये जिओफेन्स्ड झोन परिभाषित करा जे वैयक्तिक रिटेल युनिट्स, कॉमन एरिया, प्रवेशद्वार कॉरिडॉर आणि फूड कोर्ट झोनशी तंतोतंत जुळतील. माहित असलेल्या संदर्भ बिंदूंचा वापर करून प्लॅटफॉर्ममधील फ्लोअर प्लॅन्स कॅलिब्रेट करा.
टप्पा ४ - Captive Portal आणि संमती कॉन्फिगरेशन: सुलभ ऑनबोर्डिंग फ्लो डिझाइन करा. अडथळे कमी करा - ऑथेंटिकेशन प्रक्रियेतील प्रत्येक अतिरिक्त स्टेपमुळे अटॅच रेट अंदाजे १५ ते २०% ने कमी होतो. CRM आणि मार्केटिंग ऑटोमेशन प्लॅटफॉर्म्स APIs द्वारे इंटिग्रेट करा. संमतीची भाषा स्पष्ट, सविस्तर आणि GDPR Article 7 च्या आवश्यकतांचे पालन करणारी असल्याची खात्री करा.
सर्वोत्तम पद्धती (Best Practices)
MAC रँडमायझेशनचा विचार करा: iOS आणि Android १०+ डिव्हाइसेस नेटवर्क शोधताना डीफॉल्टनुसार त्यांचे MAC ॲड्रेस रँडमाइज करतात. याचा विचार न करणारा ॲनालिटिक्स प्लॅटफॉर्म वाढवून फुगवलेली फूटफॉल आकडेवारी दर्शवेल - कधीकधी वास्तविक अभ्यागतांच्या संख्येपेक्षा तीन ते पाच पट जास्त. तुमचा प्लॅटफॉर्म ऑथेंटिकेटेड सेशन डेटाचा प्राथमिक मेट्रिक म्हणून वापर करतो आणि प्रोब रिक्वेस्ट डेटासेटवर डिडुप्लिकेशन अल्गोरिदम लागू करतो याची खात्री करा.
नेटवर्क सुरक्षेला प्राधान्य द्या: मजबूत नेटवर्क सेगमेंटेशन लागू करा. गेस्ट ट्रॅफिक कॉर्पोरेट इन्फ्रास्ट्रक्चरपासून वेगळे ठेवले पाहिजे. मल्टी-टेनंट व्हेन्यू वातावरणासाठी लागू असलेल्या DNS फिल्टरिंग आणि नेटवर्क सुरक्षिततेच्या सर्वोत्तम पद्धतींच्या तपशीलवार मार्गदर्शकासाठी, Protect Your Network with Strong DNS and Security पहा.
डेटा गव्हर्नन्स लागू करा: GDPR किंवा लागू असलेल्या स्थानिक डेटा गोपनीयता नियमांचे काटेकोरपणे पालन करा. अनऑथेंटिकेटेड ट्रॅकिंगसाठी MAC हॅशिंग वापरा, Captive Portal ऑथेंटिकेशन दरम्यान स्पष्ट ऑप्ट-इन संमती आवश्यक करा, आणि दस्तऐवजीकरण केलेले डेटा रिटेंशन धोरण लागू करा. सर्व थर्ड-पार्टी ॲनालिटिक्स व्हेंडर्ससोबत डेटा प्रोसेसिंग करार अस्तित्वात असल्याची खात्री करा.
मोठ्या प्रमाणावर स्केल करण्यासाठी OpenRoaming चा लाभ घ्या: सेल्युलर रोमिंग अनुभवाप्रमाणेच अखंड, सुरक्षित कनेक्टिव्हिटी प्रदान करण्यासाठी Passpoint/Hotspot 2.0 चा अवलंब करा. हे परत येणाऱ्या युजर्ससाठी Captive Portal ची अडचण दूर करते, ऑथेंटिकेटेड डेटा कॅप्चर करण्याचे प्रमाण वाढवते आणि तुमच्या ॲनालिटिक्सचा सांख्यिकीय आत्मविश्वास सुधारते.

त्रुटी निवारण आणि जोखीम कमी करणे
अचूक नसलेला लोकेशन डेटा: याचे सर्वात सामान्य कारण म्हणजे अपुरी AP घनता किंवा जास्त ट्रान्समिट पॉवर ज्यामुळे मोठे सेल आकार तयार होतात. ८० मीटर अंतरावरील AP शी कनेक्ट केलेले डिव्हाइस चुकीच्या झोनमध्ये दाखवले जाईल. एक ॲक्टिव्ह साईट सर्व्हे करा, RSSI हीट मॅप्सचे पुनरावलोकन करा आणि सेलच्या सीमा अचूक करण्यासाठी Tx पॉवर कमी करा. प्रत्येक ट्रॅक केलेल्या झोनमध्ये क्लायंट शोधणारे किमान तीन AP असल्याची खात्री करा.
कमी ऑथेंटिकेशन दर (३०% पेक्षा कमी): एक गुंतागुंतीची किंवा संथ Captive Portal प्रक्रिया हे याचे मुख्य कारण आहे. ४G कनेक्शनवर (व्हेन्यूच्या WiFi वर नाही) मोबाईल डिव्हाइसवरील ऑनबोर्डिंग प्रक्रियेचे ऑडिट करा. फॉर्म फील्डची संख्या कमीत कमी करा, सोशल लॉगिन पर्याय ऑफर करा आणि पोर्टल पेज दोन सेकंदांच्या आत लोड होईल याची खात्री करा. परत येणाऱ्या पाहुण्यांसाठी पोर्टल पूर्णपणे बायपास करण्यासाठी OpenRoaming तैनात करण्याचा विचार करा.
डेटा सायलो (Data Silos): असा ॲनालिटिक्स डेटा गोळा करणे ज्यामध्ये व्यावसायिक टीमला प्रवेश मिळत नाही किंवा ते समजू शकत नाहीत. स्वयंचलित API इंटिग्रेशन्स कॉन्फिगर करून याचे निराकरण करा, जे साप्ताहिक फूटफॉल आणि ड्वेल रिपोर्ट्स थेट प्रॉपर्टी मॅनेजमेंट CRM किंवा BI टूल्सवर पाठवतात. लीझिंग टीमसोबत मासिक डेटा पुनरावलोकनाचे नियोजन करा जेणेकरून कॅप्चर केलेले मेट्रिक्स भाडेकरूंच्या वाटाघाटींमध्ये त्यांना आवश्यक असलेल्या उत्तरांशी सुसंगत असतील.
GDPR अनुपालन त्रुटी: ऑथेंटिकेटेड युजर प्रोफाइल्सच्या सुरक्षित ठेवलेल्या संमती रेकॉर्डचे नियमितपणे ऑडिट करा. हे सुनिश्चित करा की ऑप्ट-आउट विनंत्यांवर ३० दिवसांच्या GDPR विंडोच्या आत प्रक्रिया केली जाते आणि थर्ड-पार्टी CRM इंटिग्रेशन्ससह सर्व डाउनस्ट्रिम सिस्टममधून डेटा हटविला जातो.
ROI आणि व्यावसायिक प्रभाव
व्यावसायिक टीम्ससाठी, योग्यरित्या तैनात केलेल्या WiFi ॲनालिटिक्स सोल्यूशनचा ROI हा तीन प्राथमिक मूल्य प्रवाहांमध्ये लक्षणीय आणि मोजता येण्याजोगा आहे.
लीज वाटाघाटी (Lease Negotiations): प्रॉपर्टी मॅनेजर्स व्यक्तिनिष्ठ युक्तिवादांकडून डेटा-चालित वाटाघाटींकडे वळतात. ऑथेंटिकेटेड व्हिजिटर काउंट्स, ड्वेल टाईम वितरण आणि विशिष्ट रिटेल झोनसाठी डेमोग्राफिक ब्रेकडाउन सादर करून, व्हेन्यू प्रत्येक युनिटचे व्यावसायिक मूल्य डिजिटल जाहिरात प्लॅटफॉर्म इतक्याच अचूकतेने सिद्ध करू शकतो. हा डेटा हाय-ट्रॅफिक युनिट्ससाठी प्रीमियम किंमत आणि पुराव्यावर आधारित भाडे पुनरावलोकने या दोन्हीला पाठबळ देतो. भाडेकरू टिकवून ठेवणे (Tenant Retention): किरकोळ विक्रेत्यांना स्थानिक पातळीवरील अंतर्दृष्टी मिळते - जसे की त्यांच्या स्टोअरच्या बाहेरून किती लोक गेले आणि प्रत्यक्षात किती लोकांनी आत प्रवेश केला, तसेच आत प्रवेश केलेले लोक किती वेळ थांबले. हा डेटा किरकोळ विक्रेत्यांना विंडो डिस्प्ले, कर्मचाऱ्यांचे वेळापत्रक आणि जाहिरातींची वेळ ऑप्टिमाइझ करण्यात मदत करतो. जेव्हा एखाद्या किरकोळ विक्रेत्याला दिसते की मार्केटिंग मोहिमेनंतर त्यांच्या युनिटसमोरील लोकांची वर्दळ १८% ने वाढली आहे, तेव्हा त्यांच्याकडे त्यांच्या भाडेपट्ट्याचे नूतनीकरण करण्यासाठी आणि त्या ठिकाणी अधिक गुंतवणूक करण्यासाठी एक मजबूत कारण असते.
कार्यक्षम कार्यक्षमता (Operational Efficiency): फ्लो अॅनालिटिक्स ऑपरेशन्स टीम्सना रिअल-टाइम आणि ऐतिहासिक ऑक्युपन्सी पॅटर्नच्या आधारे क्लीनिंग शेड्युल, सुरक्षा गस्त मार्ग आणि HVAC चा वापर ऑप्टिमाइझ करण्यास सक्षम करते. डेटा-चालित संसाधन वाटपामुळे, ठिकाणे सामान्यतः वापराच्या पहिल्या वर्षात परिचालन खर्चामध्ये १० ते १५% कपात नोंदवतात.
इतर उच्च वर्दळीच्या ठिकाणांच्या श्रेणींमध्ये अशाच प्रकारचे डेटा-चालित दृष्टिकोन अत्यंत प्रभावी ठरत आहेत. Zoo and Theme Park WiFi: High-Footfall Venue Connectivity Guide मध्ये मनोरंजनाच्या वातावरणातील अशाच प्रकारच्या स्पेसियल अॅनालिटिक्स आव्हानांचा समावेश आहे, आणि हेच आर्किटेक्चरल सिद्धांत सर्व मोठ्या प्रमाणावरील भौतिक ठिकाणांना लागू होतात.
महत्वाच्या व्याख्या
RSSI (Received Signal Strength Indicator)
मिळालेल्या रेडिओ सिग्नलमधील पॉवर लेव्हलचे मोजमाप, जे dBm मध्ये व्यक्त केले जाते (ऋण मूल्ये, जेथे -30 dBm उत्कृष्ट आहे आणि -90 dBm अत्यंत कमकुवत आहे).
लोकेशन ॲनालिटिक्स इंजिनसाठी प्राथमिक इनपुट. एकाच क्लायंट डिव्हाइससाठी अनेक APs त्यांचे RSSI रीडिंग नोंदवतात आणि इंजिन या मूल्यांचा वापर फ्लोअर प्लॅनवर डिव्हाइसचे स्थान त्रिकोणी करण्यासाठी करते.
Trilateration
छेदात्मक वर्तुळांच्या भूमितीचा वापर करून, तीन किंवा अधिक ज्ञात संदर्भ बिंदूंपासूनचे अंतर मोजून एखाद्या बिंदूचे स्थान निश्चित करण्याची पद्धत.
क्लायंट डिव्हाइसचे स्थान मोजण्यासाठी एकाच वेळी शोध घेण्यासाठी किमान तीन ॲक्सेस पॉइंट्स आवश्यक आहेत. याच कारणामुळे लोकेशन ॲनालिटिक्सच्या अचूकतेसाठी AP ची घनता अत्यंत महत्त्वाची ठरते.
MAC Randomisation
आधुनिक मोबाइल ऑपरेटिंग सिस्टीम्स (iOS 14+, Android 10+) मधील एक गोपनीयता वैशिष्ट्य, ज्यामुळे डिव्हाइस त्याच्या खऱ्या हार्डवेअर पत्त्याऐवजी WiFi नेटवर्क्स शोधताना यादृच्छिकपणे जनरेट केलेला MAC पत्ता ब्रॉडकास्ट करते.
प्रिझन्स-बेस्ड ॲनालिटिक्ससमोरील मुख्य तांत्रिक आव्हान. प्लॅटफॉर्मने ऑथेंटिकेटेड सेशन डेटाचा वापर मुख्य मेट्रिक म्हणून केला पाहिजे आणि अभ्यागतांची संख्या अवाजवी वाढू नये म्हणून डुप्लिकेशन काढण्याचे अल्गोरिदम लागू केले पाहिजेत.
OpenRoaming (Hotspot 2.0 / Passpoint)
एक WiFi रोमिंग फेडरेशन मानक जे वापरकर्त्याला Captive Portal च्या परस्परसंवादाशिवाय, आधीपासून इन्स्टॉल केलेल्या प्रोफाईलचा वापर करून सहभागी नेटवर्कशी आपोआप आणि सुरक्षितपणे कनेक्ट होण्याची अनुमती देते.
Purple हे Connect लायसन्स अंतर्गत OpenRoaming साठी विनामूल्य ओळख प्रदाता म्हणून कार्य करते. OpenRoaming तैनात केल्याने परत येणाऱ्या वापरकर्त्यांसाठी Captive Portal चा त्रास दूर होतो, ज्यामुळे ऑथेंटिकेटेड सेशनचे प्रमाण लक्षणीयरीत्या वाढते.
Dwell Time
शोधलेले डिव्हाइस विशिष्ट गोफेंसड झोनमध्ये किती वेळ राहते याचा कालावधी, जो त्या झोनमधील पहिल्या शोधापासून ते शेवटच्या शोधापर्यंत मोजला जातो.
किरकोळ विक्रेत्यांसाठी एक अत्यंत महत्त्वाचे व्यावसायिक मेट्रिक. जास्त वेळ थांबणे हे स्टोअरफ्रंट किंवा रिटेल वातावरणातील ग्राहकांच्या स्वारस्याचे संकेत देते. जास्त गर्दी असलेल्या झोनमध्ये कमी वेळ थांबणे हे ट्रॅफिकच्या समस्येपेक्षा कन्वर्जनच्या समस्येकडे निर्देश करते.
Probe Request
क्लायंट डिव्हाइसद्वारे त्याच्या आसपास उपलब्ध वायरलेस नेटवर्क्स शोधण्यासाठी ब्रॉडकास्ट केलेली IEEE 802.11 मॅनेजमेंट फ्रेम.
एकूण पादचाऱ्यांची संख्या मोजण्यासाठी अनऑथेंटिकेटेड उपस्थितीचा डेटा गोळा करण्याची यंत्रणा, ज्यामध्ये नेटवर्कशी कधीही कनेक्ट न होणाऱ्या अभ्यागतांचाही समावेश होतो. आधुनिक डिव्हाइसेसवर यावर MAC randomisation चा प्रभाव पडतो.
Captive Portal
एक वेब पेज ज्याच्याशी सार्वजनिक-ॲक्सेस नेटवर्क वापरणाऱ्या वापरकर्त्याला संपूर्ण नेटवर्क ॲक्सेस मिळण्यापूर्वी संवाद साधणे आवश्यक असते, सामान्यतः सेवा अटी दर्शवण्यासाठी आणि डेटा प्रक्रियेसाठी संमती गोळा करण्यासाठी याचा वापर केला जातो.
प्रथम-पार्टी डेमोग्राफिक डेटा आणि स्पष्ट GDPR-सुसंगत मार्केटिंग संमती गोळा करण्याची मुख्य यंत्रणा. पोर्टलच्या प्रवाहाची रचना आणि लांबी थेट अटॅच रेट निश्चित करते.
Attach Rate
शोधलेल्या एकूण डिव्हाइसेसची (उपस्थिती विश्लेषण) टक्केवारी जी Captive Portal ऑथेंटिकेशन प्रक्रिया यशस्वीरित्या पूर्ण करतात आणि ऑथेंटिकेटेड सेशन्स बनतात.
तुमच्या ॲनालिटिक्स डेटाच्या गुणवत्तेसाठी मुख्य कामगिरी दर्शक (KPI). कमी अटॅच रेट म्हणजे तुमच्या पादचाऱ्यांच्या डेटाचा बहुतांश भाग अनामित आहे आणि त्यात डेमोग्राफिक माहितीचा अभाव आहे, ज्यामुळे त्याचे व्यावसायिक मूल्य मर्यादित होते.
Geofencing
एक आभासी भौगोलिक सीमा निश्चित करण्यासाठी GPS किंवा RSSI-आधारित स्थान डेटाचा वापर, ज्यामुळे एखादे डिव्हाइस परिभाषित क्षेत्रात प्रवेश करते किंवा बाहेर पडते तेव्हा विशिष्ट क्रिया किंवा डेटा संकलन सुरू होते.
ॲनालिटिक्स प्लॅटफॉर्ममध्ये विशिष्ट रिटेल झोन, कॉरिडॉर आणि प्रवेशद्वार निश्चित करण्यासाठी वापरले जाते, ज्यामुळे संपूर्ण ठिकाणाच्या एकत्रित डेटाऐवजी झोन-स्तरीय पादचारी आणि थांबण्याच्या वेळेचे मेट्रिक्स मिळतात.
सोडवलेली उदाहरणे
एका १५०-युनिट प्रादेशिक शॉपिंग सेंटरच्या वेस्ट विंगमध्ये सातत्याने जास्त रिकाम्या जागांचे प्रमाण आहे. व्यावसायिक टीमला संशय आहे की वेस्ट विंगमधील फूटफॉल ईस्ट विंगच्या तुलनेत कमी आहे, परंतु याची पुष्टी करण्यासाठी त्यांच्याकडे कोणताही डेटा नाही. सध्याचे WiFi नेटवर्क Cisco Meraki APs वापरून मूलभूत कव्हरेज प्रदान करते परंतु त्यात कोणतेही analytics एकत्रीकरण नाही. भाडे पुनर्रचना प्रस्तावाला पाठबळ देण्यासाठी ऑपरेशन्स डायरेक्टरला ६० दिवसांच्या आत डेटा हवा आहे.
पायरी १: सध्याची AP घनता आणि RSSI कव्हरेजचे मूल्यांकन करण्यासाठी वेस्ट विंगचे सक्रिय साइट सर्वेक्षण करा. असे झोन ओळखा जेथे तीनपेक्षा कमी APs एकाच वेळी एखाद्या क्लायंट डिव्हाइसचा शोध घेऊ शकतात. पायरी २: ट्रायलेटरेशन कव्हरेज मिळवण्यासाठी वेस्ट विंगच्या कॉरिडॉरमध्ये अतिरिक्त APs जोडा. सेल आकार अचूक करण्यासाठी सर्व APs वरील ट्रान्समिट पॉवर १५ dBm पर्यंत कमी करा. पायरी ३: Cisco Meraki लोकेशन analytics API सक्षम करा आणि ते Purple WiFi Analytics प्लॅटफॉर्मशी कनेक्ट करा. पायरी ४: प्रत्येक रिकाम्या युनिटसाठी, मुख्य वेस्ट विंग कॉरिडॉरसाठी आणि तुलनेसाठी समतुल्य ईस्ट विंग झोनसाठी जिओफेन्स्ड झोन परिभाषित करा. पायरी ५: ३० दिवसांचा बेसलाइन डेटा गोळा करा. दोन्ही विंगसाठी युनिक डिव्हाइस काउंट, सरासरी ड्वेल टाइम आणि पीक अवर डिस्ट्रिब्युशन्स दर्शवणारा तुलनात्मक अहवाल एक्सपोर्ट करा. पायरी ६: संभाव्य भाडेकरूंना डेटा सादर करा, ज्यामध्ये प्रत्यक्ष फूटफॉलमधील फरक आणि योग्य रिटेल संकल्पनेसाठी उपलब्ध व्यावसायिक संधी स्पष्ट होईल.
एक प्रीमियम फॅशन रिटेलर एका प्रमुख शहराच्या मध्यवर्ती शॉपिंग सेंटरमधील त्यांच्या भाडेपट्ट्या नूतनीकरणावर वाद घालत आहे. त्यांचा असा दावा आहे की १८ महिन्यांपूर्वी मॉलच्या विरुद्ध बाजूला एक नवीन दुय्यम प्रवेशद्वार उघडल्यापासून त्यांच्या युनिटसमोरील फूटफॉल लक्षणीयरीत्या कमी झाला आहे, आणि ते २५% भाडे कपातीची मागणी करत आहेत. प्रॉपर्टी मॅनेजरला वस्तुनिष्ठ डेटा वापरून या दाव्याची पडताळणी किंवा खंडन करणे आवश्यक आहे.
पायरी १: WiFi analytics प्लॅटफॉर्मच्या ऐतिहासिक डेटा आर्काइव्हमध्ये प्रवेश करा. रिटेलरच्या स्टोअरफ्रंटशी संबंधित झोनवर जा. पायरी २: नवीन प्रवेशद्वार उघडण्याच्या आधीच्या १२ महिन्यांचा आणि त्यानंतरच्या १२ महिन्यांचा मासिक युनिक डिव्हाइस काउंट आणि ड्वेल टाइम डेटा मिळवा. पायरी ३: नवीन प्रवेशद्वार उघडल्यानंतर मॉलद्वारे होणारा मुख्य रहदारीचा प्रवाह बदलला आहे का हे निर्धारित करण्यासाठी पाथिंग डेटाचे विश्लेषण करा. कोणते झोन वाढले आणि कोणत्या झोनमध्ये फूटफॉल कमी झाला ते ओळखा. पायरी ४: फूटफॉलमधील घट केवळ त्यांच्या विशिष्ट लोकेशनपुरती मर्यादित आहे की अधिक व्यापक पॅटर्नचा भाग आहे हे निर्धारित करण्यासाठी रिटेलरच्या झोन डेटाची मॉलच्या एकूण फूटफॉल ट्रेंडशी तुलना करा. पायरी ५: टाइमस्टँप केलेल्या, अनामित मेट्रिक्ससह अधिकृत डेटा अहवाल एक्सपोर्ट करा. भाडेपट्टीच्या वाटाघाटीसाठी वस्तुनिष्ठ पुराव्याचा आधार म्हणून हे सादर करा.
सराव प्रश्न
Q1. एका व्हेन्यू ऑपरेटरला २००-युनिट शॉपिंग सेंटरमधून अभ्यागतांच्या हालचाली ट्रॅक करायच्या आहेत परंतु बजेट मर्यादांमुळे AP डिप्लॉयमेंट केवळ मुख्य कॉरिडॉरपुरते मर्यादित आहे, ज्यामध्ये APs रेषीय मांडणीत ५० मीटर अंतरावर आहेत. IT डायरेक्टरचा असा दावा आहे की हे झोन-स्तरीय ॲनालिटिक्ससाठी पुरेसे असेल. या दाव्याचे मूल्यमापन करा आणि प्राथमिक तांत्रिक मर्यादा ओळखा.
टीप: स्थानिक त्रिकोणीकरणासाठी आवश्यक असलेल्या ॲक्सेस पॉइंट्सच्या किमान संख्येचा आणि सेलचा आकार व स्थानाची अचूकता यांच्यातील संबंधाचा विचार करा विचार करा.
नमुना उत्तर पहा
IT डायरेक्टरचा दावा चुकीचा आहे. अचूक झोन-स्तरीय लोकेशन ट्रॅकिंगसाठी ट्रायलेटरेशन आवश्यक आहे - म्हणजेच किमान तीन ऍक्सेस पॉईंट्सनी एकाच वेळी एकाच क्लायंट डिव्हाइसचा शोध घेणे आवश्यक आहे. ५०-मीटर अंतरासह रेषीय कॉरिडॉर डिप्लॉयमेंटचा अर्थ असा आहे की बहुतेक ठिकाणी, एखादे डिव्हाइस केवळ एक किंवा दोन APs च्या रेंजमध्ये असेल, ज्यामुळे ट्रायलेटरेशन अशक्य होईल. याचा परिणाम झोन-स्तरीय अचूकतेऐवजी केवळ 'कॉरिडॉरमध्ये आहे / कॉरिडॉरमध्ये नाही' अशा प्रकारचा बायनरी शोध घेण्यात होईल. यावर योग्य उपाय म्हणजे मुख्य ट्रॅकिंग झोनमध्ये १५ - २० मीटर अंतरावर APs सह ग्रिड-आधारित डिप्लॉयमेंट करणे आणि लहान, अचूक सेल्स तयार करण्यासाठी ट्रान्समिट पॉवर १४ - १७ dBm पर्यंत कमी करणे होय.
Q2. मार्केटिंग टीमने अहवाल दिला आहे की WiFi ॲनालिटिक्स प्लॅटफॉर्म मार्च महिन्यासाठी ४,५०,००० युनिक व्हिजिटर्स दाखवत आहे. सर्व प्रवेशद्वारांवरील फिजिकल डोअर काउंटर्सनी त्याच कालावधीसाठी एकूण ९५,००० नोंदी नोंदवल्या आहेत. या विसंगतीमुळे कमर्शियल टीम सर्व WiFi डेटाच्या विश्वासार्हतेवर प्रश्नचिन्ह उपस्थित करत आहे. याचे सर्वात संभाव्य तांत्रिक कारण काय आहे आणि आपण त्याचे निराकरण कसे कराल?
टीप: आधुनिक मोबाईल ऑपरेटिंग सिस्टीम WiFi नेटवर्क शोध कशा प्रकारे हाताळतात आणि MAC-address-आधारित मोजणीसाठी याचा काय अर्थ होतो, याचा विचार करा.
नमुना उत्तर पहा
याचे सर्वात संभाव्य कारण म्हणजे MAC रँडमायझेशन. iOS 14+ आणि Android 10+ डिव्हाइसेस नेटवर्क शोधत असताना रँडमायझ्ड MAC ॲड्रेस ब्रॉडकास्ट करतात. जर ॲनालिटिक्स प्लॅटफॉर्म प्रत्येक युनिक MAC ॲड्रेसला एक युनिक व्हिजिटर म्हणून मोजत असेल, तर अनेक तास व्हेन्यूमध्ये फिरणारे एकच डिव्हाइस - जे प्रत्येक वेळी नेटवर्क शोधताना नवीन रँडमायझ्ड MAC तयार करते - अनेक वेळा मोजले जाईल. याचे तीन प्रकारे निराकरण केले जाऊ शकते: (१) प्रायमरी फूटफॉल मेट्रिक प्रोब-आधारित डिव्हाइस काउंट्सऐवजी ऑथेंटिकेटेड सेशन काउंट्सवर स्विच करणे; (२) प्लॅटफॉर्म रँडमायझ्ड MACs फिल्टर करण्यासाठी डीड्युप्लिकेशन अल्गोरिदम लागू करत असल्याची खात्री करणे; आणि (३) व्हॅलिडेटेड कन्व्हर्जन रेशो स्थापित करण्यासाठी फिजिकल डोअर काउंटर डेटासह प्लॅटफॉर्मच्या फूटफॉल मल्टिप्लायरचे कॅलिब्रेशन करणे.
Q3. एक नवीन अँकर टेनंट - एक मोठे डिपार्टमेंट स्टोअर - त्यांच्या लीजची बोलणी करत आहे आणि प्रॉपर्टी मॅनेजरकडे मासिक अहवालांची मागणी करत आहे, ज्यामध्ये विशेषतः त्यांच्या युनिटला लागून असलेल्या प्रवेशद्वाराद्वारे शॉपिंग सेंटरमध्ये प्रवेश केलेल्या युनिक व्हिजिटर्सची संख्या, त्या व्हिजिटर्सनी त्यांच्या स्टोअरचा समावेश असलेल्या विंगमध्ये घालवलेला सरासरी वेळ आणि त्या व्हिजिटर्सचे डेमोग्राफिक वर्गीकरण दर्शवणे आवश्यक आहे. सध्याचे WiFi नेटवर्क केवळ व्हेन्यू-व्यापी फूटफॉल डेटा प्रदान करते. ही आवश्यकता पूर्ण करण्यासाठी कोणते इन्फ्रास्ट्रक्चर आणि प्लॅटफॉर्म बदल आवश्यक आहेत?
टीप: व्हेन्यू-व्यापी एकत्रित डेटा आणि झोन-विशिष्ट, प्रवेशद्वाराशी संबंधित डेटा यामधील फरकाचा आणि ॲनालिटिक्स प्लॅटफॉर्म कॉन्फिगरेशनने कशाला सपोर्ट करणे आवश्यक आहे, याचा विचार करा.
नमुना उत्तर पहा
ही आवश्यकता पूर्ण करण्यासाठी तीन बदल आवश्यक आहेत. पहिले, ट्रायलेटरेशन आणि अचूक झोन असाइनमेंटला सपोर्ट करण्यासाठी अँकर टेनंटला लागून असलेल्या विंगमधील AP डिप्लॉयमेंट लोकेशन-ॲनालिटिक्स डेन्सिटीमध्ये (प्रति ५०० चौरस फुटांवर एक AP) अपग्रेड करणे आवश्यक आहे. दुसरे, ॲनालिटिक्स प्लॅटफॉर्ममध्ये खालील घटकांसाठी विशिष्ट जिओफेन्स्ड झोन परिभाषित केले गेले पाहिजेत: (a) अँकर टेनंटला लागून असलेला प्रवेशद्वार कॉरिडॉर, (b) अँकर टेनंट असलेले रिटेल विंग, आणि (c) त्या विंगमधील वैयक्तिक सब-झोन. तिसरे, स्पष्ट GDPR संमतीसह डेमोग्राफिक डेटा (वय मर्यादा, लिंग, पोस्टकोड) कॅप्चर करण्यासाठी Captive Portal कॉन्फिगर केले पाहिजे आणि ज्या एंट्री झोनमध्ये डिव्हाइस पहिल्यांदा शोधले गेले होते त्या झोनशी ऑथेंटिकेटेड सेशन्स जोडण्यासाठी प्लॅटफॉर्म कॉन्फिगर केला पाहिजे. परिणामी मिळणारे अहवाल प्रवेशद्वाराशी संबंधित युनिक व्हिजिटर्स, विंग ड्वेल टाइम आणि डेमोग्राफिक वर्गीकरण दर्शवतील - जे सर्व टेनंटच्या स्वतःच्या रिपोर्टिंग टूल्समध्ये API द्वारे एक्सपोर्ट केले जाऊ शकतात.
या मालिकेमध्ये पुढे वाचा
गेस्ट WiFi आणि लोकेशन ॲनालिटिक्सच्या व्यावसायिक ROI चे मोजमाप करणे
हे मार्गदर्शक गेस्ट WiFi आणि लोकेशन ॲनालिटिक्सच्या व्यावसायिक ROI चे मोजमाप करण्यासाठी तांत्रिक आणि ऑपरेशनल फ्रेमवर्क प्रदान करते. हे किरकोळ (retail), आदरातिथ्य (hospitality) आणि सार्वजनिक ठिकाणी ड्वेल-टाइम वाढ, ऑपरेशनल कार्यक्षमता आणि फर्स्ट-पार्टी डेटा कॅप्चरद्वारे हार्डवेअर गुंतवणुकीतून मूल्याची गणना कशी करावी याचे तपशील देते. IT व्यवस्थापक, नेटवर्क आर्किटेक्ट्स, CTOs आणि वेन्यू ऑपरेशन्स डायरेक्टर्सना त्यांच्या WiFi गुंतवणुकीचे समर्थन करण्यासाठी आणि ती जास्तीत जास्त वाढवण्यासाठी ठोस मोजमाप फ्रेमवर्क, वास्तविक केस स्टडीज आणि अनुपालन (compliance) मार्गदर्शन मिळेल.
Privacy by Design: GDPR Compliance साठी WiFi डेटा अनामित करणे
हे अधिकृत मार्गदर्शक GDPR अनुपालन सुनिश्चित करण्यासाठी WiFi डेटा अनामित करण्यासाठी तांत्रिक आर्किटेक्चर आणि अंमलबजावणी धोरणांचा तपशील देते. हे IT लीडर्स आणि नेटवर्क आर्किटेक्ट्सना कठोर डेटा प्रायव्हसी आवश्यकतांसह मजबूत व्हेन्यू ॲनालिटिक्सचा समतोल राखण्यासाठी कृतीयोग्य फ्रेमवर्क प्रदान करते.
Heatmapping vs Presence Analytics: तांत्रिक फरक
हा अधिकृत तांत्रिक मार्गदर्शक एंटरप्राइझ व्हेन्यू ऑपरेटर्ससाठी WiFi heatmapping आणि presence analytics मधील महत्त्वपूर्ण आर्किटेक्चरल आणि ऑपरेशनल फरक तपशीलवार स्पष्ट करतो. हा IT लीडर्स, नेटवर्क आर्किटेक्ट्स आणि ऑपरेशन्स डायरेक्टर्सना त्यांच्या विद्यमान वायरलेस इन्फ्रास्ट्रक्चरमधून जास्तीत जास्त ROI मिळवण्यासाठी उपयुक्त डिप्लोयमेंट फ्रेमवर्क्स, वास्तविक-जगातील अंमलबजावणीची उदाहरणे आणि व्हेंडर-न्यूट्रल सर्वोत्तम पद्धती प्रदान करतो.