शॉपिंग सेंटर रिटेलर्स को आकर्षित करने और बनाए रखने के लिए WiFi Analytics का उपयोग कैसे करते हैं
यह आधिकारिक तकनीकी संदर्भ गाइड बताती है कि कैसे शॉपिंग सेंटर की आईटी टीमें और प्रॉपर्टी मैनेजर फुटफॉल डेटा कैप्चर करने, ज़ोन के अनुसार ड्वेल टाइम को मापने और लीज पर बातचीत करने, प्रीमियम रिटेलर्स को बनाए रखने और नए टेनेंट्स को आकर्षित करने के लिए आवश्यक अनुभवजन्य साक्ष्य आधार बनाने के लिए WiFi एनालिटिक्स को डिप्लॉय करते हैं। इसमें AP डिप्लॉयमेंट और MAC-लेयर डेटा कैप्चर से लेकर GDPR-अनुरूप एनालिटिक्स डैशबोर्ड तक के पूरे तकनीकी स्टैक को शामिल किया गया है, जिसमें इस तिमाही में लागू करने के लिए तैयार आईटी पेशेवरों के लिए ठोस व्यावहारिक उदाहरण और निर्णय फ्रेमवर्क दिए गए हैं।
इस गाइड को सुनें
पॉडकास्ट ट्रांसक्रिप्ट देखें
📚 हमारी मुख्य श्रृंखला का हिस्सा: WiFi Analytics Guide →
एक्जीक्यूटिव समरी
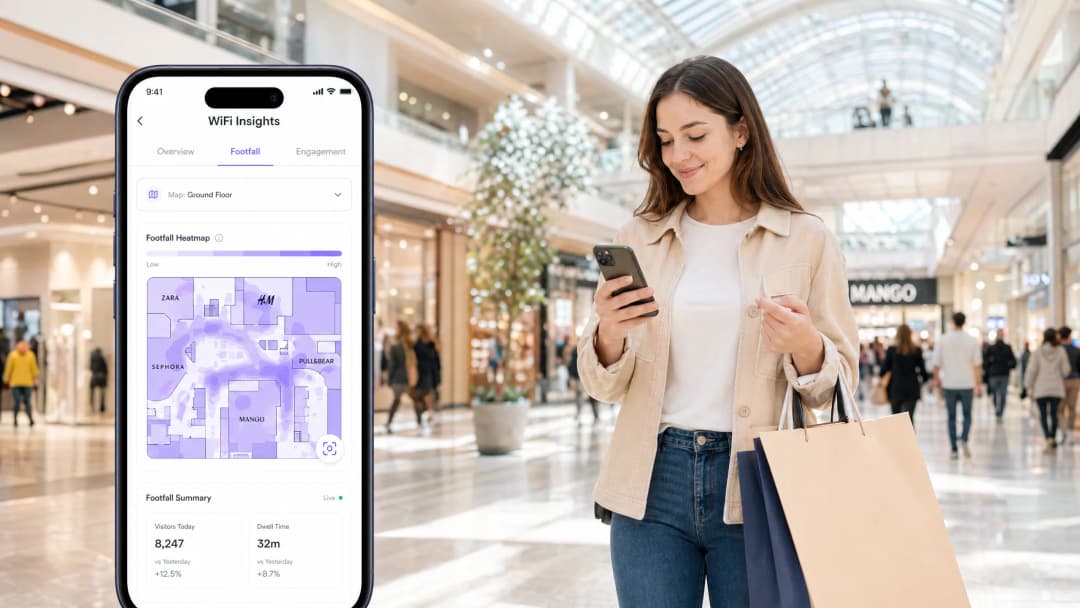
आधुनिक शॉपिंग सेंटरों के लिए, वायरलेस नेटवर्क अब केवल मेहमानों की सुविधा नहीं है — यह फिजिकल वेन्यू का प्राथमिक टेलीमेट्री सिस्टम है। एंटरप्राइज-ग्रेड WiFi Analytics प्लेटफॉर्म के साथ जुड़े एक मजबूत Guest WiFi इन्फ्रास्ट्रक्चर को डिप्लॉय करके, वेन्यू ऑपरेटर्स पैसिव वायरलेस सिग्नलों को व्यावहारिक व्यावसायिक बुद्धिमत्ता (commercial intelligence) में परिवर्तित करते हैं।
इस गाइड में सटीक फुटफॉल (footfall) और ड्वेल (dwell) मैट्रिक्स को कैप्चर करने के लिए आवश्यक टेक्निकल आर्किटेक्चर, डिप्लॉयमेंट स्ट्रेटेजी और डेटा उपयोग के तरीकों पर विस्तार से चर्चा की गई है। आईटी प्रबंधकों, नेटवर्क आर्किटेक्ट्स और सीटीओ (CTO) के लिए जनादेश स्पष्ट है: एक ऐसा लचीला, हाई-डेंसिटी नेटवर्क बनाना जो न केवल उच्च उपयोगकर्ता थ्रूपुट (throughput) का समर्थन करता है, बल्कि लीजिंग और कमर्शियल टीमों के लिए आवश्यक स्पेशियल डेटा की सटीकता भी प्रदान करता है, ताकि वे ROI साबित कर सकें, लीज वैल्यू को सही ठहरा सकें और शीर्ष retail टेनेंट्स को आकर्षित कर सकें। यही सिद्धांत hospitality , transport और healthcare परिवेशों पर भी लागू होते हैं, जहां स्पेशियल इंटेलिजेंस ऑपरेशनल और व्यावसायिक निर्णयों को संचालित करता है।
टेक्निकल डीप-डाइव
WiFi डेटा कलेक्शन कैसे काम करता है
शॉपिंग सेंटर के WiFi एनालिटिक्स का आधार वेन्यू के भीतर क्लाइंट डिवाइसों को पहचानने और ट्रैक करने की क्षमता है। यह समानांतर में काम करने वाले दो प्राथमिक तंत्रों के माध्यम से प्राप्त किया जाता है।
प्रेजेंस एनालिटिक्स (अनऑथेंटिकेटेड): परिचित नेटवर्क की खोज करने वाले स्मार्टफोन से उत्सर्जित IEEE 802.11 प्रोब रिक्वेस्ट के लिए एक्सेस पॉइंट (AP) लगातार मॉनिटर करते हैं। MAC एड्रेस को कैप्चर करके — जिसे GDPR अनुपालन बनाए रखने के लिए वन-वे क्रिप्टोग्राफिक फ़ंक्शन का उपयोग करके तुरंत हैश किया जाता है — और साथ ही कई AP से रिसीव्ड सिग्नल स्ट्रेंथ इंडिकेटर (RSSI) को मापकर, सिस्टम डिवाइस की निकटता और गतिशीलता का अनुमान लगाता है। यह कुल फुटफॉल के लिए एक बेसलाइन मीट्रिक प्रदान करता है, जिसमें वे विज़िटर भी शामिल हैं जो कभी नेटवर्क से कनेक्ट नहीं होते हैं। यह वह "राहगीर" या पासर-बाय (passer-by) काउंट है जिसका उपयोग प्रॉपर्टी मैनेजर हाई-ट्रैफिक कॉरिडोर के व्यावसायिक मूल्य को प्रदर्शित करने के लिए करते हैं।
ऑथेंटिकेटेड सेशन: जब कोई उपयोगकर्ता कैप्टिव पोर्टल के माध्यम से सक्रिय रूप से कनेक्ट होता है, तो वेन्यू स्पष्ट सहमति (explicit consent) के आधार पर फर्स्ट-पार्टी डेटा — डेमोग्राफिक्स, ईमेल एड्रेस और CRM इंटीग्रेशन हुक — कैप्चर करता है। यह डेटा मॉडल को अनाम डिवाइस ट्रैकिंग से समृद्ध कस्टमर प्रोफाइलिंग में स्थानांतरित करता है। OpenRoaming (Hotspot 2.0 / Passpoint) का इंटीग्रेशन, जहां Purple कनेक्ट लाइसेंस के तहत एक फ्री आइडेंटिटी प्रोवाइडर के रूप में काम करता है, पारंपरिक स्प्लैश पेज के बिना निर्बाध और सुरक्षित ऑनबोर्डिंग को आसान बनाता है। यह ऑथेंटिकेटेड सेशन की मात्रा को काफी बढ़ा देता है, जो व्यावसायिक विश्लेषण के लिए अधिक समृद्ध और सांख्यिकीय रूप से मजबूत डेटासेट प्रदान करता है।
स्पेशियल ट्रायंगुलेशन और ज़ोन एक्यूरेसी
विशिष्ट रिटेल ज़ोन के लिए प्रभावी डेटा प्रदान करने के लिए — केवल वेन्यू-व्यापी समग्र डेटा के बजाय — नेटवर्क को एक परिभाषित क्षेत्र के भीतर डिवाइसों को सटीक रूप से लोकेट करना चाहिए। इसके लिए ट्राइलेटरेशन (trilateration) की आवश्यकता होती: फ्लोर प्लान पर किसी डिवाइस की स्थिति की गणना करने के लिए एक साथ कम से कम तीन एक्सेस पॉइंट से RSSI रीडिंग का उपयोग करने की प्रक्रिया। इस प्रक्रिया की सटीकता सीधे AP डेंसिटी के समानुपाती होती है।
लोकेशन एनालिटिक्स के लिए एक मानक कवरेज-मॉडल डिप्लॉयमेंट (प्रति 1,000-1,500 वर्ग फुट में एक AP) अपर्याप्त है। एक लोकेशन-ऑप्टिमाइज्ड डिप्लॉयमेंट के लिए आमतौर पर मुख्य ट्रैकिंग ज़ोन में प्रति 500-700 वर्ग फुट में एक AP की आवश्यकता होती है, जहां ट्रांसमिट पावर सेटिंग्स पर सावधानीपूर्वक ध्यान देना होता है ताकि सेल का आकार सार्थक स्पेशियल रिज़ॉल्यूशन प्रदान करने के लिए पर्याप्त छोटा हो।
| डिप्लॉयमेंट मॉडल | AP डेंसिटी | प्राइमरी यूज़ केस | लोकेशन एक्यूरेसी |
|---|---|---|---|
| कवरेज | प्रति 1,500 वर्ग फुट में 1 | बेसिक कनेक्टिविटी | कोई नहीं |
| कैपेसिटी | प्रति 800 वर्ग फुट में 1 | हाई-थ्रूपुट इवेंट | कम |
| लोकेशन एनालिटिक्स | प्रति 500 वर्ग फुट में 1 | फुटफॉल और ड्वेल ट्रैकिंग | अधिक (±3-5 मीटर) |
इन्फ्रास्ट्रक्चर एग्नॉस्टिसिज्म और इंटीग्रेशन आर्किटेक्चर
Purple सहित आधुनिक एनालिटिक्स प्लेटफॉर्म मौजूदा एंटरप्राइज वायरलेस इन्फ्रास्ट्रक्चर पर एक ओवरले के रूप में काम करते हैं। ये मानक प्रोटोकॉल के माध्यम से Cisco, Aruba, Meraki और Ruckus के मौजूदा वायरलेस लैन कंट्रोलर (WLC) के साथ इंटीग्रेट करते हैं। WLC प्रेजेंस डेटा — आमतौर पर सिसलॉग (syslog), SNMP ट्रैप या वेंडर-विशिष्ट API के माध्यम से — क्लाउड एनालिटिक्स इंजन को फॉरवर्ड करता है। यह तत्काल हार्डवेयर प्रतिस्थापन की आवश्यकता को कम करता है, जिससे वेन्यू अपने मौजूदा पूंजी निवेश का लाभ उठाकर चरणों में एनालिटिक्स लेयर जोड़ सकते हैं।
जो वेन्यू हाई-डेंसिटी एनालिटिक्स डिप्लॉयमेंट से बढ़े हुए डेटा थ्रूपुट का समर्थन करने के लिए एक leased line को अपग्रेड करने पर विचार कर रहे हैं, उन्हें रियल-टाइम डैशबोर्ड अपडेट के लिए सुसंगत लेटेंसी सुनिश्चित करने के लिए एक समर्पित सिमेट्रिक कनेक्शन की दृढ़ता से सिफारिश की जाती है।

इम्प्लीमेंटेशन गाइड
एक लोकेशन-अवेयर वायरलेस नेटवर्क को डिप्लॉय करने के लिए चार अलग-अलग चरणों में सावधानीपूर्वक योजना बनाने की आवश्यकता होती है।
चरण 1 — RF प्लानिंग और साइट सर्वे: कोई भी हार्डवेयर इंस्टॉल करने से पहले RF एनवायरनमेंट को मॉडल करने के लिए Ekahau Pro या AirMagnet जैसे प्रेडिक्टिव सर्वे टूल का उपयोग करें। बिल्डिंग मटेरियल से एटेन्यूएशन (attenuation) को ध्यान में रखें — कांच की एट्रियम छतें, मेटल रिटेल फिक्स्चर और कंक्रीट के स्ट्रक्चरल कॉलम सभी मल्टीपाथ इंटरफेरेंस पैदा करते हैं जो RSSI-आधारित लोकेशन कैलकुलेशन को विकृत करते हैं। प्रत्येक ज़ोन के लिए आवश्यक लोकेशन एक्यूरेसी निर्धारित करें और AP प्लेसमेंट ग्रिड निर्धारित करने के लिए पीछे की ओर काम करें।
चरण 2 — हार्डवेयर डिप्लॉयमेंट और कॉन्फ़िगरेशन: प्रेडिक्टिव सर्वे के अनुसार AP इंस्टॉल करें, फिर मॉडल के विपरीत रियल-वर्ल्ड RSSI रीडिंग को सत्यापित करने के लिए एक एक्टिव साइट सर्वे आयोजित करें। रेडियो रिसोर्स मैनेजमेंट (RRM) को कॉन्फ़िगर करें लेकिन छोटे सेल का आकार बनाए रखने के लिए सख्त ट्रांसमिट पावर कैप — आमतौर पर 14-17 dBm — लागू करें। PCI-DSS आवश्यकताओं का पालन करते हुए, VLAN सेगमेंटेशन के माध्यम से गेस्ट SSID कॉर्पोरेट और POS नेटवर्क से आइसोलेटेड रहे, यह सुनिश्चित करें।
चरण 3 — एनालिटिक्स प्लेटफॉर्म इंटीग्रेशन: WLC को Purple एनालिटिक्स प्लेटफॉर्म से कनेक्ट करें। डैशबोर्ड के भीतर जियोफेंस्ड (geofenced) ज़ोन को परिभाषित करें जो व्यक्तिगत रिटेल यूनिट, कॉमन एरिया, एंट्रेंस कॉरिडोर और फूड कोर्ट ज़ोन से बिल्कुल मेल खाते हों। परिचित संदर्भ बिंदुओं का उपयोग करके प्लेटफॉर्म के भीतर फ्लोर प्लान को कैलिब्रेट करें।
चरण 4 — कैप्टिव पोर्टल और कंसेंट कॉन्फ़िगरेशन: एक सुव्यवस्थित ऑनबोर्डिंग फ्लो डिज़ाइन करें। घर्षण (friction) को कम करें — ऑथेंटिकेशन प्रक्रिया में प्रत्येक अतिरिक्त चरण अटैच रेट (attach rate) को लगभग 15-20% कम कर देता है। API के माध्यम से CRM और मार्केटिंग ऑटोमेशन प्लेटफॉर्म को इंटीग्रेट करें। सुनिश्चित करें कि सहमति की भाषा (consent language) स्पष्ट, ग्रैनुलर और GDPR आर्टिकल 7 की आवश्यकताओं के अनुकूल हो।
बेस्ट प्रैक्टिस
MAC रैंडमाइजेशन को ध्यान में रखें: iOS 14+ और Android 10+ डिवाइस नेटवर्क को प्रोब करते समय डिफ़ॉल्ट रूप से अपने MAC एड्रेस को रैंडमाइज करते हैं। जो एनालिटिक्स प्लेटफॉर्म इसे ध्यान में नहीं रखता है, वह बढ़े हुए फुटफॉल आंकड़े रिपोर्ट करेगा — जो कभी-कभी वास्तविक विज़िटर्स की संख्या से तीन से पांच गुना हो सकता है। सुनिश्चित करें कि आपका प्लेटफॉर्म ऑथेंटिकेटेड सेशन डेटा को प्राइमरी मीट्रिक के रूप में उपयोग करता है और प्रोब रिक्वेस्ट डेटासेट पर डीडुप्लीकेशन (deduplication) एल्गोरिदम लागू करता है।
नेटवर्क सिक्योरिटी को प्राथमिकता दें: मजबूत नेटवर्क सेगमेंटेशन लागू करें। गेस्ट ट्रैफिक को कॉर्पोरेट इन्फ्रास्ट्रक्चर से अलग रखा जाना चाहिए। मल्टी-टेनेंट वेन्यू एनवायरनमेंट के लिए लागू DNS फ़िल्टरिंग और नेटवर्क सिक्योरिटी बेस्ट प्रैक्टिस की एक विस्तृत गाइड के लिए Protect Your Network with Strong DNS and Security देखें।
डेटा गवर्नेंस लागू करें: GDPR या लागू स्थानीय डेटा प्राइवेसी रेगुलेशन का कड़ाई से पालन करें। अनऑथेंटिकेटेड ट्रैकिंग के लिए MAC हैशिंग का उपयोग करें, कैप्टिव पोर्टल ऑथेंटिकेशन के दौरान स्पष्ट ऑप्ट-इन सहमति (opt-in consent) की मांग करें और एक प्रलेखित डेटा रिटेंशन पॉलिसी लागू करें। सुनिश्चित करें कि सभी थर्ड-पार्टी एनालिटिक्स वेंडर्स के साथ डेटा प्रोसेसिंग एग्रीमेंट हैं।
स्केल के लिए OpenRoaming का लाभ उठाएं: सेलुलर रोमिंग अनुभव की तरह निर्बाध, सुरक्षित कनेक्टिविटी प्रदान करने के लिए Passpoint/Hotspot 2.0 को अपनाएं। यह लौटने वाले उपयोगकर्ताओं के लिए कैप्टिव पोर्टल के घर्षण को समाप्त करता है, ऑथेंटिकेटेड डेटा कैपचर रेट को बढ़ाता है और आपके एनालिटिक्स के सांख्यिकीय आत्मविश्वास में सुधार करता है।

ट्रबलशूटिंग और रिस्क मिटिगेशन
गलत लोकेशन डेटा: इसका सबसे आम कारण अपर्याप्त AP डेंसिटी या अत्यधिक ट्रांसमिट पावर है जो बड़े सेल का आकार बनाती है। 80 मीटर दूर के एक AP से कनेक्टेड डिवाइस को गलत ज़ोन में दिखाया जाएगा। एक एक्टिव साइट सर्वे आयोजित करें, RSSI हीट मैप की समीक्षा करें और सेल बाउंड्री को टाइट करने के लिए Tx पावर कम करें। सत्यापित करें कि प्रत्येक ट्रैक किए गए ज़ोन में कम से कम तीन AP क्लाइंट्स की पहचान कर रहे हैं।
कम ऑथेंटिकेशन रेट (30% से नीचे): एक जटिल या धीमी कैप्टिव पोर्टल प्रक्रिया ही इसका मुख्य कारण है। 4G कनेक्शन पर (वेन्यू के WiFi पर नहीं) एक मोबाइल डिवाइस पर ऑनबोर्डिंग फ्लो का ऑडिट करें। फॉर्म फ़ील्ड की संख्या कम करें, सोशल लॉगिन विकल्प प्रदान करें और सुनिश्चित करें कि पोर्टल पेज दो सेकंड के भीतर लोड हो। लौटने वाले विज़िटर्स के लिए पोर्टल को पूरी तरह से हटाने के लिए OpenRoaming को डिप्लॉय करने पर विचार करें।
डेटा साइलो (Data Silos): ऐसा एनालिटिक्स डेटा एकत्र करना जिसे कमर्शियल टीम एक्सेस या समझ नहीं सकती है। स्वचालित API इंटीग्रेशन को कॉन्फ़िगर करके इसे हल करें, जो साप्ताहिक फुटफॉल और ड्वेल रिपोर्ट को सीधे प्रॉपर्टी मैनेजमेंट CRM या BI टूल में पुश करता है। लीजिंग टीम के साथ एक मासिक डेटा समीक्षा शेड्यूल करें ताकि यह सुनिश्चित किया जा सके कि कैप्चर किए गए मैट्रिक्स टेनेंट नेगोशिएशन में उनके आवश्यक उत्तरों के अनुरूप हों।
GDPR अनुपालन अंतर (Compliance Gap): ऑथेंटिकेटेड यूजर प्रोफाइल के विपरीत संग्रहीत सहमति रिकॉर्ड का नियमित रूप से ऑडिट करें। सुनिश्चित करें कि ऑप्ट-आउट अनुरोधों को 30 दिनों की GDPR विंडो के भीतर प्रोसेस किया जाए और थर्ड-पार्टी CRM इंटीग्रेशन सहित सभी डाउनस्ट्रीम सिस्टम से डेटा हटा दिया जाए।
ROI और बिजनेस इम्पैक्ट
कमर्शियल टीम के लिए, सही ढंग से डिप्लॉय किए गए WiFi एनालिटिक्स सॉल्यूशन का ROI पर्याप्त है और यह तीन प्राथमिक वैल्यू स्ट्रीम में मापने योग्य है।
लीज नेगोशिएशन: प्रॉपर्टी मैनेजर व्यक्तिपरक (subjective) तर्कों के बजाय डेटा-ड्रिवन नेगोशिएशन की ओर बढ़ते हैं। विशिष्ट रिटेल ज़ोन के लिए ऑथेंटिकेटेड विज़िटर काउंट, ड्वेल टाइम डिस्ट्रीब्यूशन और डेमोग्राफिक ब्रेकडाउन प्रस्तुत करके, वेन्यू एक डिजिटल एडवरटाइजिंग प्लेटफॉर्म की तरह ही कड़ाई से प्रत्येक यूनिट के व्यावसायिक मूल्य को प्रदर्शित कर सकता है। यह डेटा हाई-ट्रैफिक यूनिटों के लिए प्रीमियम प्राइसिंग और प्रमाण-आधारित रेंट रिव्यू दोनों का समर्थन करता है।
टेनेंट रिटेंशन: रिटेलर्स को स्थानीयकृत इनसाइट्स (localized insights) मिलती हैं — कितने लोग उनके स्टोर के पास से गुजरे बनाम कितने लोगों ने प्रवेश किया और जो प्रवेश कर चुके हैं वे कितनी देर तक रुके। यह डेटा रिटेलर्स को विंडो डिस्प्ले, स्टाफिंग शेड्यूल और प्रमोशनल टाइमिंग को ऑप्टिमाइज़ करने में मदद करता है। जब एक रिटेलर देखता है कि एक मार्केटिंग कैंपेन के बाद उनकी यूनिट के पास से फुटफॉल 18% बढ़ गया है, तो उनके पास लीज को रिन्यू करने और वेन्यू में अधिक निवेश करने का एक मजबूत कारण होता है।
ऑपरेशनल एफिशियेंसी: फ्लो एनालिटिक्स ऑपरेशन टीम को रियल-टाइम और ऐतिहासिक ऑक्यूपेंसी पैटर्न के आधार पर क्लीनिंग शेड्यूल, सिक्योरिटी पेट्रोल रूट और HVAC उपयोग को ऑप्टिमाइज़ करने में सक्षम बनाता है। डेटा-ड्रिवन रिसोर्स एलोकेशन के माध्यम से वेन्यू आमतौर पर डिप्लॉयमेंट के पहले वर्ष के भीतर ही ऑपरेशनल खर्चों में 10-15% की कमी की रिपोर्ट करते हैं।
अन्य हाई-फुटफॉल वेन्यू श्रेणियों में भी इसी तरह के डेटा-ड्रिवन दृष्टिकोण अत्यधिक प्रभावी साबित हो रहे हैं। Zoo and Theme Park WiFi: High-Footfall Venue Connectivity Guide लेज़र एनवायरनमेंट (leisure environments) में इसी तरह की स्पेशियल एनालिटिक्स चुनौतियों को कवर करता है और वही आर्किटेक्चरल सिद्धांत सभी बड़े पैमाने के फिजिकल वेन्यू पर लागू होते हैं।
मुख्य परिभाषाएं
RSSI (Received Signal Strength Indicator)
प्राप्त रेडियो सिग्नल में मौजूद पावर लेवल का एक माप, जिसे dBm में व्यक्त किया जाता है (नकारात्मक मान, जहां -30 dBm उत्कृष्ट है और -90 dBm बहुत कमजोर है)।
लोकेशन एनालिटिक्स इंजन के लिए प्राथमिक इनपुट। कई AP एक ही क्लाइंट डिवाइस के लिए अपनी RSSI रीडिंग की रिपोर्ट करते हैं, और इंजन इन मानों का उपयोग फ्लोर प्लान पर डिवाइस की स्थिति को त्रिकोणीय (triangulate) करने के लिए करता है।
Trilateration
प्रतिच्छेदी वृत्तों (intersecting circles) की ज्यामिति का उपयोग करके, तीन या अधिक ज्ञात संदर्भ बिंदुओं से इसकी दूरी को मापकर किसी बिंदु की स्थिति निर्धारित करने की एक विधि।
किसी क्लाइंट डिवाइस की स्थिति की गणना करने के लिए एक साथ कम से कम तीन एक्सेस पॉइंट द्वारा उसका पता लगाने की आवश्यकता होती है। यही कारण है कि लोकेशन एनालिटिक्स सटीकता के लिए AP डेंसिटी महत्वपूर्ण वेरिएबल है।
MAC रैंडमाइजेशन
आधुनिक मोबाइल ऑपरेटिंग सिस्टम (iOS 14+, Android 10+) में एक प्राइवेसी फीचर जो किसी डिवाइस को WiFi नेटवर्क की खोज करते समय अपने वास्तविक हार्डवेयर एड्रेस के बजाय बेतरतीब ढंग से उत्पन्न (randomly generated) MAC एड्रेस प्रसारित करने का कारण बनता है।
प्रेजेंस-आधारित एनालिटिक्स के लिए प्राथमिक तकनीकी चुनौती। विज़िटर काउंट को अत्यधिक बढ़ने से रोकने के लिए प्लेटफॉर्मों को प्राथमिक मीट्रिक के रूप में ऑथेंटिकेटेड सेशन डेटा का उपयोग करना चाहिए और डीडुप्लीकेशन एल्गोरिदम लागू करना चाहिए।
OpenRoaming (Hotspot 2.0 / Passpoint)
एक WiFi रोमिंग फेडरेशन मानक जो किसी डिवाइस को कैप्टिव पोर्टल इंटरैक्शन की आवश्यकता के बिना, पूर्व-स्थापित प्रोफ़ाइल का उपयोग करके किसी भाग लेने वाले नेटवर्क से स्वचालित रूप से और सुरक्षित रूप से कनेक्ट करने की अनुमति देता है।
Purple, Connect लाइसेंस के तहत OpenRoaming के लिए एक फ्री आइडेंटिटी प्रोवाइडर के रूप में कार्य करता है। OpenRoaming को डिप्लॉय करने से लौटने वाले उपयोगकर्ताओं के लिए कैप्टिव पोर्टल के घर्षण को हटाकर ऑथेंटिकेटेड सेशन की मात्रा में काफी वृद्धि होती है।
ड्वेल टाइम (Dwell Time)
वह अवधि जिसके लिए एक डिटेक्टेड डिवाइस विशेष रूप से परिभाषित जियोफेंस्ड ज़ोन के भीतर रहता है, जिसे उस ज़ोन के भीतर पहली डिटेक्शन से लेकर अंतिम डिटेक्शन तक मापा जाता है।
रिटेलर्स के लिए एक महत्वपूर्ण व्यावसायिक मीट्रिक। उच्च ड्वेल टाइम स्टोरफ्रंट या रिटेल वातावरण के साथ जुड़ाव को दर्शाता है। उच्च फुटफॉल वाले ज़ोन में कम ड्वेल टाइम ट्रैफिक की समस्या के बजाय कन्वर्शन की समस्या का सुझाव देता है।
प्रोब रिक्वेस्ट (Probe Request)
अपने आस-पास उपलब्ध वायरलेस नेटवर्क की खोज करने के लिए क्लाइंट डिवाइस द्वारा प्रसारित एक IEEE 802.11 मैनेजमेंट फ्रेम।
कुल फुटफॉल काउंट के लिए अनऑथेंटिकेटेड प्रेजेंस डेटा को कैप्चर करने के लिए उपयोग किया जाने वाला तंत्र, जिसमें वे विज़िटर भी शामिल हैं जो कभी नेटवर्क से कनेक्ट नहीं होते हैं। आधुनिक डिवाइसों पर MAC रैंडमाइजेशन के अधीन।
Captive Portal
एक वेब पेज जिसके साथ सार्वजनिक-पहुंच (public-access) नेटवर्क के उपयोगकर्ता को पूर्ण नेटवर्क पहुंच प्रदान करने से पहले इंटरैक्ट करना आवश्यक होता है, आमतौर पर सेवा की शर्तों को प्रस्तुत करने और डेटा प्रोसेसिंग के लिए सहमति एकत्र करने के लिए उपयोग किया जाता है।
फर्स्ट-पार्टी डेमोग्राफिक डेटा और स्पष्ट GDPR-अनुरूप मार्केटिंग सहमति को कैप्चर करने का प्राथमिक तंत्र। पोर्टल फ्लो का डिज़ाइन और लंबाई सीधे अटैच रेट को निर्धारित करती है।
अटैच रेट (Attach Rate)
कुल डिटेक्टेड डिवाइसों (प्रेजेंस एनालिटिक्स) का प्रतिशत जो कैप्टिव पोर्टल ऑथेंटिकेशन प्रक्रिया को सफलतापूर्वक पूरा करते हैं और ऑथेंटिकेटेड सेशन बन जाते हैं।
आपके एनालिटिक्स डेटा की गुणवत्ता के लिए प्रमुख प्रदर्शन संकेतक (KPI)। कम अटैच रेट का मतलब है कि आपका अधिकांश फुटफॉल डेटा अनाम है और इसमें डेमोग्राफिक संवर्धन की कमी है, जिससे इसका व्यावसायिक मूल्य सीमित हो जाता है।
जियोफेंसिंग (Geofencing)
एक वर्चुअल भौगोलिक सीमा को परिभाषित करने के लिए GPS या RSSI-आधारित लोकेशन डेटा का उपयोग, जो किसी डिवाइस के परिभाषित क्षेत्र में प्रवेश करने या बाहर निकलने पर क्रियाओं या डेटा कैप्चर को ट्रिगर करता है।
विशिष्ट रिटेल ज़ोन, कॉरिडोर और एंट्रेंस को परिभाषित करने के लिए एनालिटिक्स प्लेटफॉर्म के भीतर उपयोग किया जाता है, जिससे वेन्यू-व्यापी समग्र डेटा के बजाय ज़ोन-स्तरीय फुटफॉल और ड्वेल टाइम मैट्रिक्स सक्षम होते हैं।
हल किए गए उदाहरण
एक 150-यूनिट वाले क्षेत्रीय शॉपिंग सेंटर के वेस्ट विंग में लगातार उच्च रिक्ति दर (vacancy rate) बनी हुई है। कमर्शियल टीम को संदेह है कि ईस्ट विंग की तुलना में यहां फुटफॉल कम है, लेकिन इसकी पुष्टि करने के लिए कोई डेटा नहीं है। मौजूदा WiFi नेटवर्क Cisco Meraki APs का उपयोग करके बुनियादी कवरेज प्रदान करता है लेकिन इसमें कोई एनालिटिक्स इंटीग्रेशन नहीं है। ऑपरेशन्स डायरेक्टर को रेंट रीस्ट्रक्चरिंग प्रस्ताव का समर्थन करने के लिए 60 दिनों के भीतर डेटा की आवश्यकता है।
चरण 1: वर्तमान AP डेंसिटी और RSSI कवरेज का आकलन करने के लिए वेस्ट विंग का एक एक्टिव साइट सर्वे करें। उन ज़ोन की पहचान करें जहां तीन से कम AP एक साथ किसी क्लाइंट डिवाइस का पता लगा सकते हैं। चरण 2: ट्राइलेटरेशन कवरेज प्राप्त करने के लिए वेस्ट विंग के कॉरिडोर में अतिरिक्त AP जोड़ें। सेल के आकार को टाइट करने के लिए सभी AP पर ट्रांसमिट पावर को घटाकर 15 dBm करें। चरण 3: Cisco Meraki लोकेशन एनालिटिक्स API को सक्षम करें और इसे Purple WiFi एनालिटिक्स प्लेटफॉर्म से कनेक्ट करें। चरण 4: प्रत्येक खाली यूनिट, मुख्य वेस्ट विंग कॉरिडोर और तुलना के लिए समकक्ष ईस्ट विंग ज़ोन के लिए जियोफेंस्ड ज़ोन परिभाषित करें। चरण 5: 30 दिनों का बेसलाइन डेटा एकत्र करें। दोनों विंग्स के लिए विशिष्ट डिवाइस काउंट, औसत ड्वेल टाइम और पीक ऑवर डिस्ट्रीब्यूशन दिखाने वाली एक तुलनात्मक रिपोर्ट एक्सपोर्ट करें। चरण 6: संभावित टेनेंट्स को डेटा प्रस्तुत करें, जो वास्तविक फुटफॉल अंतर और सही रिटेल कॉन्सेप्ट के लिए व्यावसायिक अवसर को प्रदर्शित करता है।
एक प्रीमियम फैशन रिटेलर एक प्रमुख सिटी-सेंटर शॉपिंग सेंटर में अपने लीज रिन्यूअल पर विवाद कर रहा है। उनका दावा है कि 18 महीने पहले मॉल के दूसरी तरफ एक नया सेकेंडरी एंट्रेंस खोले जाने के बाद से उनकी यूनिट के पास से गुजरने वाला फुटफॉल काफी कम हो गया है, और वे किराए में 25% की कमी की मांग कर रहे हैं। प्रॉपर्टी मैनेजर को निष्पक्ष डेटा का उपयोग करके इस दावे को सत्यापित या खारिज करने की आवश्यकता है।
चरण 1: WiFi एनालिटिक्स प्लेटफॉर्म के ऐतिहासिक डेटा आर्काइव को एक्सेस करें। रिटेलर के स्टोरफ्रंट के अनुरूप ज़ोन पर जाएं। चरण 2: नए एंट्रेंस के खुलने से 12 महीने पहले और उसके बाद के 12 महीनों के लिए मासिक विशिष्ट डिवाइस काउंट और ड्वेल टाइम डेटा निकालें। चरण 3: यह निर्धारित करने के लिए पाथिंग डेटा का विश्लेषण करें कि क्या नया एंट्रेंस खुलने के बाद मॉल के माध्यम से प्राथमिक ट्रैफिक फ्लो स्थानांतरित हो गया है। पहचानें कि किन ज़ोन में फुटफॉल बढ़ा और किन में कम हुआ। चरण 4: यह निर्धारित करने के लिए कि क्या कोई गिरावट उनके स्थान के लिए विशिष्ट है या व्यापक पैटर्न का हिस्सा है, रिटेलर के ज़ोन डेटा को समग्र मॉल फुटफॉल ट्रेंड के साथ क्रॉस-रेफरेंस करें। चरण 5: टाइमस्टैम्प वाले, अनाम मैट्रिक्स के साथ एक औपचारिक डेटा रिपोर्ट एक्सपोर्ट करें। इसे लीज नेगोशिएशन के लिए निष्पक्ष साक्ष्य आधार के रूप में प्रस्तुत करें।
अभ्यास प्रश्न
Q1. एक वेन्यू ऑपरेटर 200-यूनิต वाले शॉपिंग सेंटर के माध्यम से विज़िटर की आवाजाही को ट्रैक करना चाहता है, लेकिन बजट की कमी के कारण AP डिप्लॉयमेंट केवल मुख्य कॉरिडोर तक ही सीमित है, जिसमें AP एक रैखिक व्यवस्था (linear arrangement) में 50 मीटर की दूरी पर हैं। आईटी डायरेक्टर का दावा है कि यह ज़ोन-स्तरीय एनालिटिक्स के लिए पर्याप्त होगा। इस दावे का मूल्यांकन करें और प्राथमिक तकनीकी सीमा की पहचान करें।
संकेत: स्पेशियल ट्रायंगुलेशन के लिए आवश्यक एक्सेस पॉइंट की न्यूनतम संख्या और सेल के आकार तथा लोकेशन सटीकता के बीच संबंध पर विचार करें।
मॉडल उत्तर देखें
आईटी डायरेक्टर का दावा गलत है। सटीक ज़ोन-स्तरीय लोकेशन ट्रैकिंग के लिए ट्राइलेटरेशन की आवश्यकता होती है — कम से कम तीन एक्सेस पॉइंट एक साथ एक ही क्लाइंट डिवाइस का पता लगाते हैं। 50 मीटर की दूरी के साथ एक रैखिक कॉरिडोर डिप्लॉयमेंट का मतलब है कि अधिकांश स्थानों पर, एक डिवाइस केवल एक या दो AP की सीमा के भीतर होगा, जिससे ट्राइलेटरेशन असंभव हो जाएगा। इसका परिणाम ज़ोन-स्तरीय सटीकता के बजाय एक बाइनरी 'कॉरिडोर में है / कॉरिडोर में नहीं है' डिटेक्शन होगा। सही दृष्टिकोण मुख्य ट्रैकिंग ज़ोन में 15-20 मीटर की दूरी पर AP के साथ ग्रिड-आधारित डिप्लॉयमेंट है, जिसमें छोटे, सटीक सेल बनाने के लिए ट्रांसमिट पावर को घटाकर 14-17 dBm किया गया हो।
Q2. मार्केटिंग टीम की रिपोर्ट है कि WiFi एनालिटिक्स प्लेटफॉर्म मार्च महीने के लिए 450,000 विशिष्ट विज़िटर्स दिखा रहा है। सभी प्रवेश द्वारों पर लगे फिजिकल डोर काउंटरों ने इसी अवधि के लिए कुल 95,000 प्रविष्टियां दर्ज कीं। यह विसंगति कमर्शियल टीम को सभी WiFi डेटा की विश्वसनीयता पर सवाल उठाने के लिए मजबूर कर रही है। सबसे संभावित तकनीकी कारण क्या है, और आप इसका समाधान कैसे करेंगे?
संकेत: विचार करें कि आधुनिक मोबाइल ऑपरेटिंग सिस्टम WiFi नेटवर्क की खोज को कैसे संभालते हैं और MAC-एड्रेस-आधारित काउंटिंग के लिए इसका क्या अर्थ है।
मॉडल उत्तर देखें
सबसे संभावित कारण MAC रैंडमाइजेशन है। iOS 14+ और Android 10+ डिवाइस नेटवर्क की खोज करते समय रैंडमाइज्ड MAC एड्रेस प्रसारित करते हैं। यदि एनालिटिक्स प्लेटफॉर्म प्रत्येक विशिष्ट MAC एड्रेस को एक विशिष्ट विज़िटर के रूप में गिन रहा है, तो एक ही डिवाइस जो कई घंटों तक वेन्यू में घूमता है — हर बार प्रोब करने पर नए रैंडमाइज्ड MAC उत्पन्न करता है — उसे कई बार गिना जाएगा। इसका समाधान तीन गुना है: (1) प्राथमिक फुटफॉल मीट्रिक को प्रोब-आधारित डिवाइस काउंट के बजाय ऑथेंटिकेटेड सेशन काउंट पर स्विच करें; (2) सुनिश्चित करें कि प्लेटफॉर्म रैंडमाइज्ड MAC को फ़िल्टर करने के लिए डीडुप्लीकेशन एल्गोरिदम लागू करता है; और (3) एक मान्य कन्वर्शन अनुपात स्थापित करने के लिए फिजिकल डोर काउंटर डेटा के विपरीत प्लेटफॉर्म के फुटफॉल मल्टीप्लायर को कैलिब्रेट करें।
Q3. एक नया एंकर टेनेंट — एक बड़ा डिपार्टमेंटल स्टोर — अपने लीज पर बातचीत कर रहा है और मांग करता है कि प्रॉपर्टी मैनेजर मासिक रिपोर्ट प्रदान करे जिसमें विशेष रूप से उनकी यूनिट के बगल वाले एंट्रेंस के माध्यम से शॉपिंग सेंटर में प्रवेश करने वाले विशिष्ट विज़िटर्स की संख्या, उन विज़िटर्स द्वारा उनके स्टोर वाले विंग में बिताया गया औसत समय और उन विज़िटर्स का डेमोग्राफिक ब्रेकडाउन दिखाया गया हो। वर्तमान WiFi नेटवर्क केवल वेन्यू-व्यापी फुटफॉल डेटा प्रदान करता है। इस आवश्यकता को पूरा करने के लिए कौन से इन्फ्रास्ट्रक्चर और प्लेटफॉर्म बदलाव आवश्यक हैं?
संकेत: वेन्यू-व्यापी समग्र डेटा और ज़ोन-विशिष्ट, एंट्रेंस-एट्रिब्यूटेड डेटा के बीच अंतर के बारे में सोचें, और एनालिटिक्स प्लेटफॉर्म कॉन्फ़िगरेशन को किसका समर्थन करने की आवश्यकता है।
मॉडल उत्तर देखें
इस आवश्यकता को पूरा करने में तीन बदलाव शामिल हैं। पहला, ट्राइलेटरेशन और सटीक ज़ोन असाइनमेंट का समर्थन करने के लिए एंकर टेनेंट के बगल वाले विंग में AP डिप्लॉयमेंट को लोकेशन-एनालिटिक्स डेंसिटी (प्रति 500 वर्ग फुट में एक AP) में अपग्रेड किया जाना चाहिए। दूसरा, एनालिटिक्स प्लेटफॉर्म के भीतर, विशिष्ट जियोफेंस्ड ज़ोन को परिभाषित किया जाना चाहिए: (a) एंकर टेनेंट के बगल वाला एंट्रेंस कॉरिडोर, (b) एंकर टेनेंट वाला रिटेल विंग, और (c) उस विंग के भीतर व्यक्तिगत सब-ज़ोन। तीसरा, कैप्टिव पोर्टल को स्पष्ट GDPR सहमति के साथ डेमोग्राफिक डेटा (आयु वर्ग, लिंग, पिनकोड) कैप्टर करने के लिए कॉन्फ़िगर किया जाना चाहिए, और प्लेटफॉर्म को ऑथेंटिकेटेड सेशन को उस एंट्री ज़ोन से जोड़ने के लिए कॉन्फ़िगर किया जाना चाहिए जहां डिवाइस का पहली बार पता चला था। परिणामी रिपोर्ट एंट्रेंस-एट्रिब्यूटेड विशिष्ट विज़िटर्स, विंग ड्वेल टाइम और डेमोग्राफिक ब्रेकडाउन दिखाएगी — जो टेनेंट के अपने रिपोर्टिंग टूल में API के माध्यम से एक्सपोर्ट करने योग्य होगी।
इस श्रृंखला में आगे पढ़ें
गेस्ट WiFi और लोकेशन एनालिटिक्स के व्यावसायिक ROI को मापना
यह गाइड गेस्ट WiFi और लोकेशन एनालिटिक्स के व्यावसायिक ROI को मापने के लिए एक तकनीकी और परिचालन ढांचा प्रदान करती है। यह विवरण देती है कि रिटेल, हॉस्पिटैलिटी और सार्वजनिक स्थानों पर ड्वेल टाइम में वृद्धि, परिचालन दक्षता और फर्स्ट-पार्टी डेटा कैप्चर के माध्यम से हार्डवेयर निवेश से मूल्य की गणना कैसे की जाए। IT प्रबंधकों, नेटवर्क आर्किटेक्ट्स, CTOs और वेन्यू ऑपरेशन्स निदेशकों को अपने WiFi निवेश को सही ठहराने और अधिकतम करने के लिए ठोस माप फ्रेमवर्क, वास्तविक दुनिया के केस स्टडीज और अनुपालन मार्गदर्शन मिलेंगे।
डिजाइन द्वारा गोपनीयता: GDPR अनुपालन के लिए WiFi डेटा को अनाम बनाना
यह आधिकारिक गाइड GDPR अनुपालन सुनिश्चित करने के लिए WiFi डेटा को अनाम बनाने की तकनीकी वास्तुकला और कार्यान्वयन रणनीतियों का विवरण देती है। यह IT लीडर्स और नेटवर्क आर्किटेक्ट्स को सख्त डेटा गोपनीयता आवश्यकताओं के साथ मजबूत स्थल विश्लेषण को संतुलित करने के लिए व्यावहारिक रूपरेखा प्रदान करती है।
Heatmapping बनाम Presence Analytics: तकनीकी अंतर
यह आधिकारिक तकनीकी मार्गदर्शिका एंटरप्राइज़ वेन्यू ऑपरेटरों के लिए WiFi heatmapping और presence analytics के बीच महत्वपूर्ण आर्किटेक्चरल और परिचालन अंतरों का विवरण देती है। यह IT लीडर्स, नेटवर्क आर्किटेक्ट्स, और ऑपरेशन्स डायरेक्टर्स को उनके मौजूदा वायरलेस इन्फ्रास्ट्रक्चर से अधिकतम ROI प्राप्त करने के लिए व्यावहारिक डिप्लॉयमेंट फ्रेमवर्क, वास्तविक दुनिया के कार्यान्वयन परिदृश्य, और वेंडर-न्यूट्रल सर्वोत्तम प्रथाएं प्रदान करती है।