ভবিষ্যদ্বাণীমূলক ফুটফল এবং AI: WiFi ডেটা থেকে ভিজিটর প্যাটার্ন পূর্বাভাস
এই প্রামাণিক প্রযুক্তিগত রেফারেন্স গাইডটি বিশদভাবে বর্ণনা করে যে কীভাবে এন্টারপ্রাইজ IT দল এবং ভেন্যু অপারেটররা WiFi-থেকে প্রাপ্ত ডেটা এবং মেশিন লার্নিং ব্যবহার করে ফুটফল সঠিকভাবে পূর্বাভাস দিতে পারে। এটি ডেটা আর্কিটেকচার, ML মডেল নির্বাচন, গোপনীয়তার বিবেচনা এবং প্রতিক্রিয়াশীল ড্যাশবোর্ডগুলিকে ভবিষ্যদ্বাণীমূলক বুদ্ধিমত্তায় পরিণত করার জন্য বাস্তব-বিশ্বের বাস্তবায়ন কৌশলগুলি কভার করে।
🎧 এই গাইডটি শুনুন
ট্রান্সক্রিপ্ট দেখুন
কার্যনির্বাহী সারসংক্ষেপ
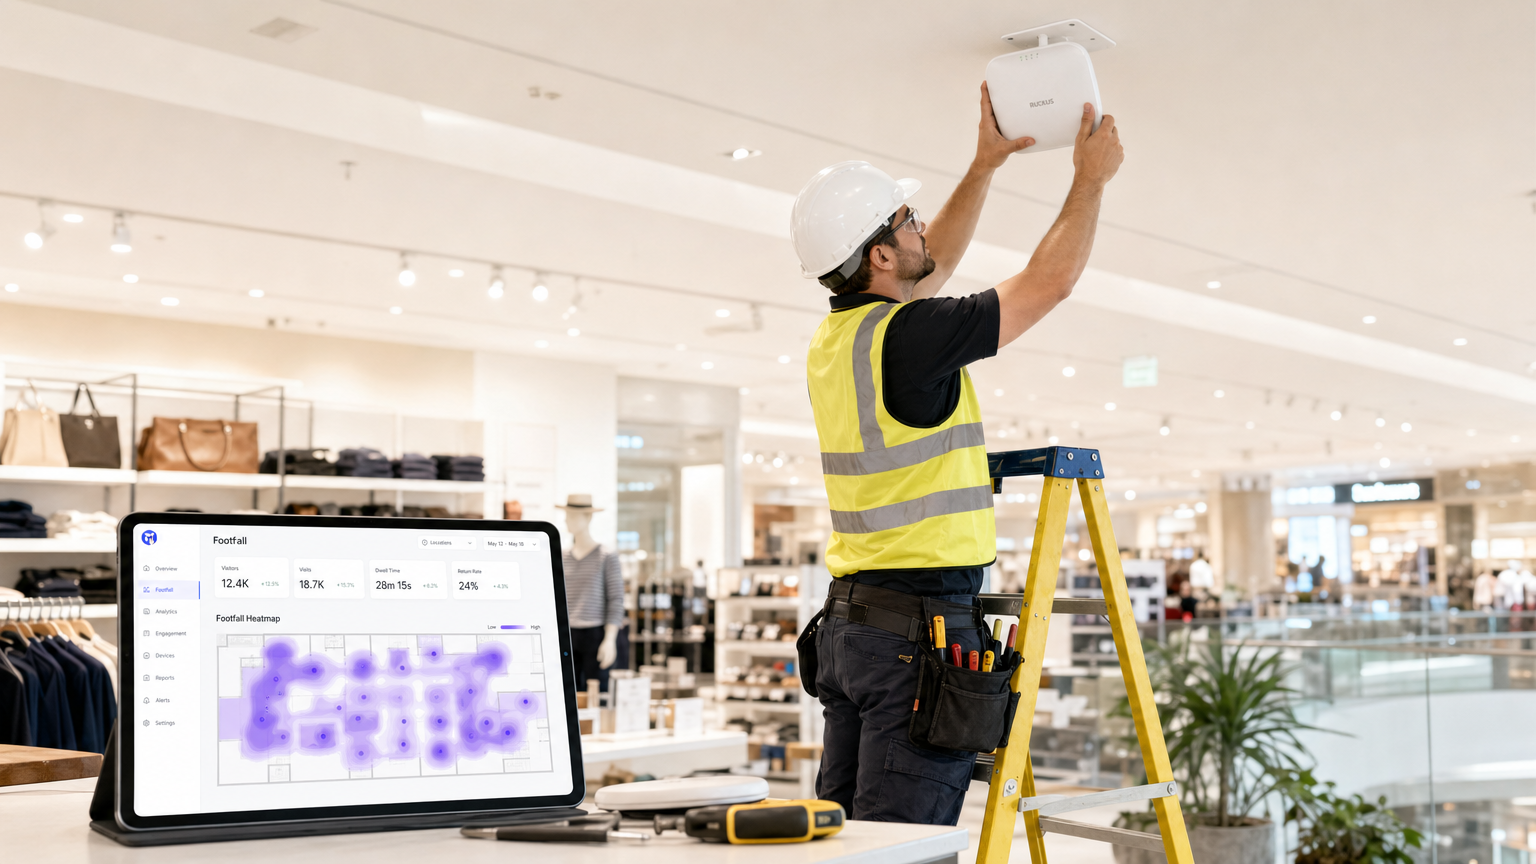
এন্টারপ্রাইজ IT দল এবং ভেন্যু অপারেশনস ডিরেক্টরদের জন্য, বিদ্যমান WiFi অবকাঠামো একটি অব্যবহৃত অপারেশনাল সম্পদ। যদিও প্রতিক্রিয়াশীল ড্যাশবোর্ডগুলি ঐতিহাসিক প্রেক্ষাপট সরবরাহ করে, স্থানিক ডেটার আসল মূল্য ভবিষ্যদ্বাণীমূলক ফুটফল বিশ্লেষণে নিহিত। বেনামী WiFi প্রোব অনুরোধ এবং অ্যাসোসিয়েশন ইভেন্টগুলিতে মেশিন লার্নিং মডেল প্রয়োগ করে, সংস্থাগুলি কর্মী নিয়োগ, স্টক পুনরায় পূরণ এবং বিপণন ট্রিগার চালানোর জন্য পর্যাপ্ত নির্ভুলতার সাথে ভিজিটর প্যাটার্ন পূর্বাভাস দিতে পারে।
এই গাইডটি ভবিষ্যদ্বাণীমূলক ভিজিটর অ্যানালিটিক্স বাস্তবায়নের জন্য একটি বিক্রেতা-নিরপেক্ষ, প্রযুক্তিগত ব্লুপ্রিন্ট সরবরাহ করে। এটি একাডেমিক তত্ত্বের বাইরে গিয়ে MAC র্যান্ডমাইজেশন, ডেটা পাইপলাইন এবং মডেল ড্রিফটের ব্যবহারিক বাস্তবতাগুলিকে মোকাবেলা করে। আপনি একটি 200-রুমের হোটেল, একটি বড় খুচরা সম্পত্তি, বা একটি পাবলিক-সেক্টর সুবিধা পরিচালনা করছেন কিনা, এই রেফারেন্সটি ঐতিহাসিক রিপোর্টিং থেকে ভবিষ্যদ্বাণীমূলক বুদ্ধিমত্তায় স্থানান্তরিত হওয়ার জন্য প্রয়োজনীয় স্থাপত্যের প্রয়োজনীয়তা এবং অপারেশনাল ওয়ার্কফ্লো রূপরেখা দেয়।
প্রযুক্তিগত গভীর-পর্যালোচনা: ডেটা পাইপলাইন আর্কিটেকচার
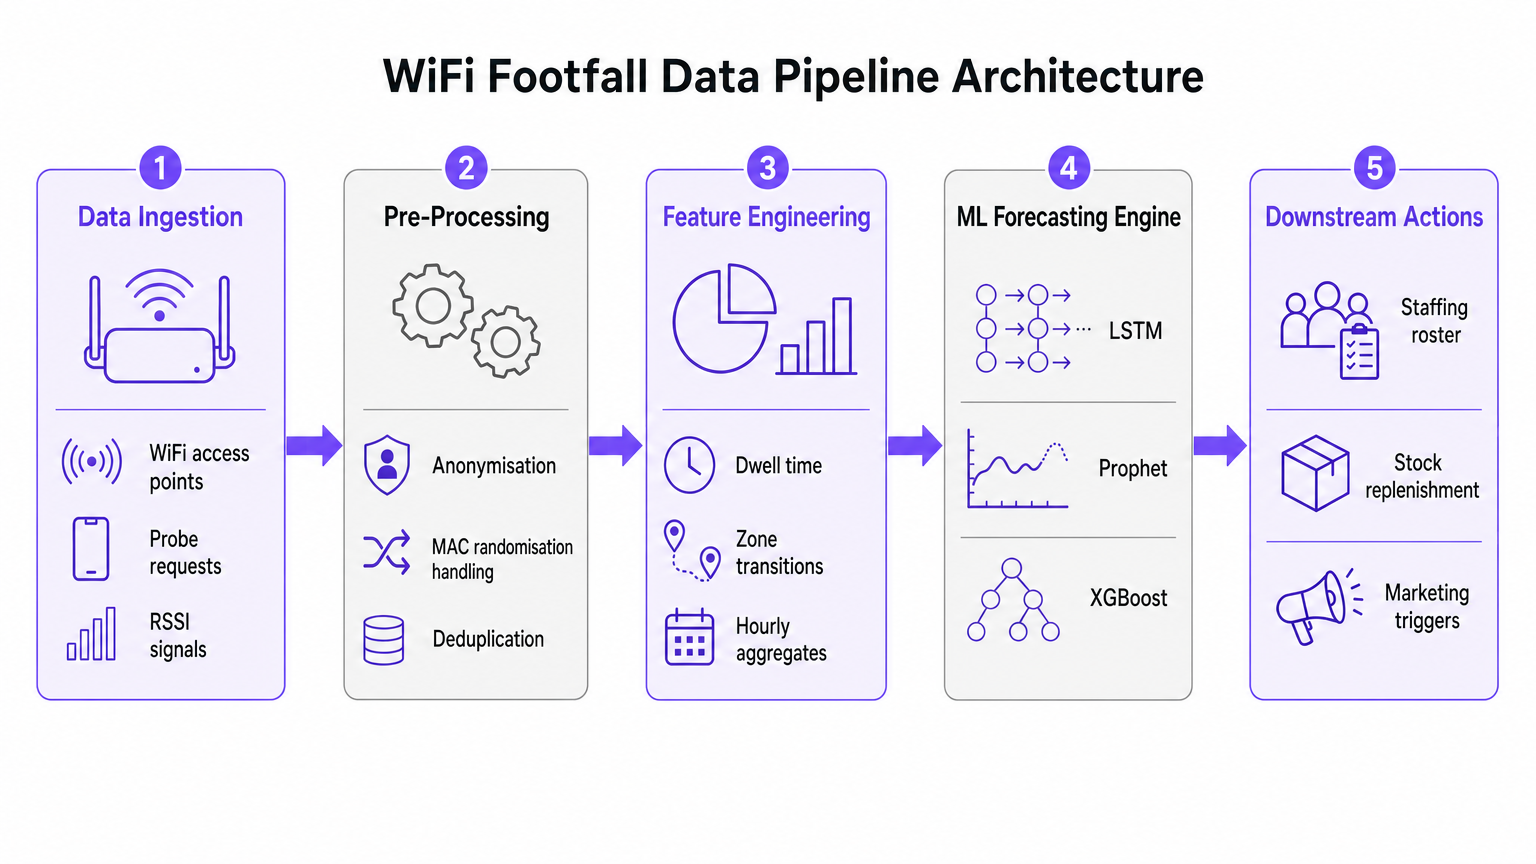
যেকোনো AI ফুটফল পূর্বাভাস উদ্যোগের ভিত্তি হল ডেটা ইনজেশন এবং প্রি-প্রসেসিং পাইপলাইন। ডাউনস্ট্রিম মেশিন লার্নিং মডেলের নির্ভুলতা সম্পূর্ণরূপে WiFi নেটওয়ার্ক থেকে নিষ্কাশিত স্থানিক ডেটার মানের উপর নির্ভরশীল।
ডেটা ইনজেশন এবং সিগন্যাল প্রসেসিং
আধুনিক এন্টারপ্রাইজ WiFi নেটওয়ার্কগুলি, যেমন Retail বা Hospitality পরিবেশে স্থাপন করা হয়েছে, পরিসরের মধ্যে যেকোনো Wi-Fi সক্ষম ডিভাইস থেকে ক্রমাগত প্রোব অনুরোধ সংগ্রহ করে। এই ইভেন্টগুলি একটি টাইমস্ট্যাম্প, একটি Received Signal Strength Indicator (RSSI), এবং একটি ডিভাইস শনাক্তকারী সহ গুরুত্বপূর্ণ মেটাডেটা বহন করে।
তবে, প্রধান মোবাইল অপারেটিং সিস্টেম দ্বারা MAC অ্যাড্রেস র্যান্ডমাইজেশনের ব্যাপক বাস্তবায়ন ডিভাইস ট্র্যাকিংকে মৌলিকভাবে পরিবর্তন করেছে। আধুনিক ভবিষ্যদ্বাণীমূলক অ্যানালিটিক্স পাইপলাইনগুলি স্থায়ী ডিভাইস পরিচয়ের উপর নির্ভর করে না। পরিবর্তে, তারা সেশন-ভিত্তিক গণনা এবং একত্রিত ডওয়েল টাইম ডিস্ট্রিবিউশন ব্যবহার করে। বেনামী, একত্রিত ডেটা GDPR এবং PCI DSS মানগুলির সাথে সম্পূর্ণরূপে সঙ্গতিপূর্ণ, যখন সঠিক পূর্বাভাসের জন্য প্রয়োজনীয় ভলিউম সরবরাহ করে।
মেশিন লার্নিংয়ের জন্য ফিচার ইঞ্জিনিয়ারিং
কাঁচা প্রোব অনুরোধগুলি সরাসরি পূর্বাভাস মডেলগুলিতে ইনজেশনের জন্য উপযুক্ত নয়। প্রি-প্রসেসিং স্তরকে ডিডুপ্লিকেশন পরিচালনা করতে হবে, কারণ একটি একক ডিভাইস প্রতি মিনিটে অসংখ্য অনুরোধ তৈরি করতে পারে। একবার ডিডুপ্লিকেট এবং বেনামী করা হলে, ফিচার ইঞ্জিনিয়ারিং পর্যায় ML পূর্বাভাস ইঞ্জিনকে খাওয়ানোর জন্য মেট্রিকগুলি নিষ্কাশন করে।
মূল ইঞ্জিনিয়ারড বৈশিষ্ট্যগুলির মধ্যে রয়েছে:
- প্রতি ঘণ্টার ভিজিটর গণনা: RSSI ট্রায়াঙ্গুলেশনের উপর ভিত্তি করে প্রতি জোনে একত্রিত।
- ডওয়েল টাইম ডিস্ট্রিবিউশন: ডিভাইসগুলি নির্দিষ্ট কভারেজ এলাকার মধ্যে যে সময় থাকে।
- জোন ট্রানজিশন: একটি ভেন্যুর বিভিন্ন এলাকার মধ্যে চলাচলের ধরণ।
- বাহ্যিক কোভেরিয়েটস: গুরুত্বপূর্ণ প্রাসঙ্গিক ডেটা যেমন সপ্তাহের দিন, সরকারি ছুটি, স্থানীয় ইভেন্ট এবং আবহাওয়ার অবস্থা।
বাস্তবায়ন নির্দেশিকা: সঠিক ML মডেল নির্বাচন
উপযুক্ত মেশিন লার্নিং মডেলের নির্বাচন উপলব্ধ ঐতিহাসিক ডেটার পরিমাণ এবং পূর্বাভাসটি যে নির্দিষ্ট অপারেশনাল সিদ্ধান্তগুলিকে সমর্থন করার উদ্দেশ্যে করা হয়েছে তার দ্বারা নির্ধারিত হয়। পর্যাপ্ত ডেটা ছাড়া জটিল নিউরাল নেটওয়ার্কগুলিতে ডিফল্ট করা এন্টারপ্রাইজ স্থাপনাগুলিতে একটি সাধারণ ব্যর্থতার মোড।
পরিসংখ্যানগত পদ্ধতি: SARIMA
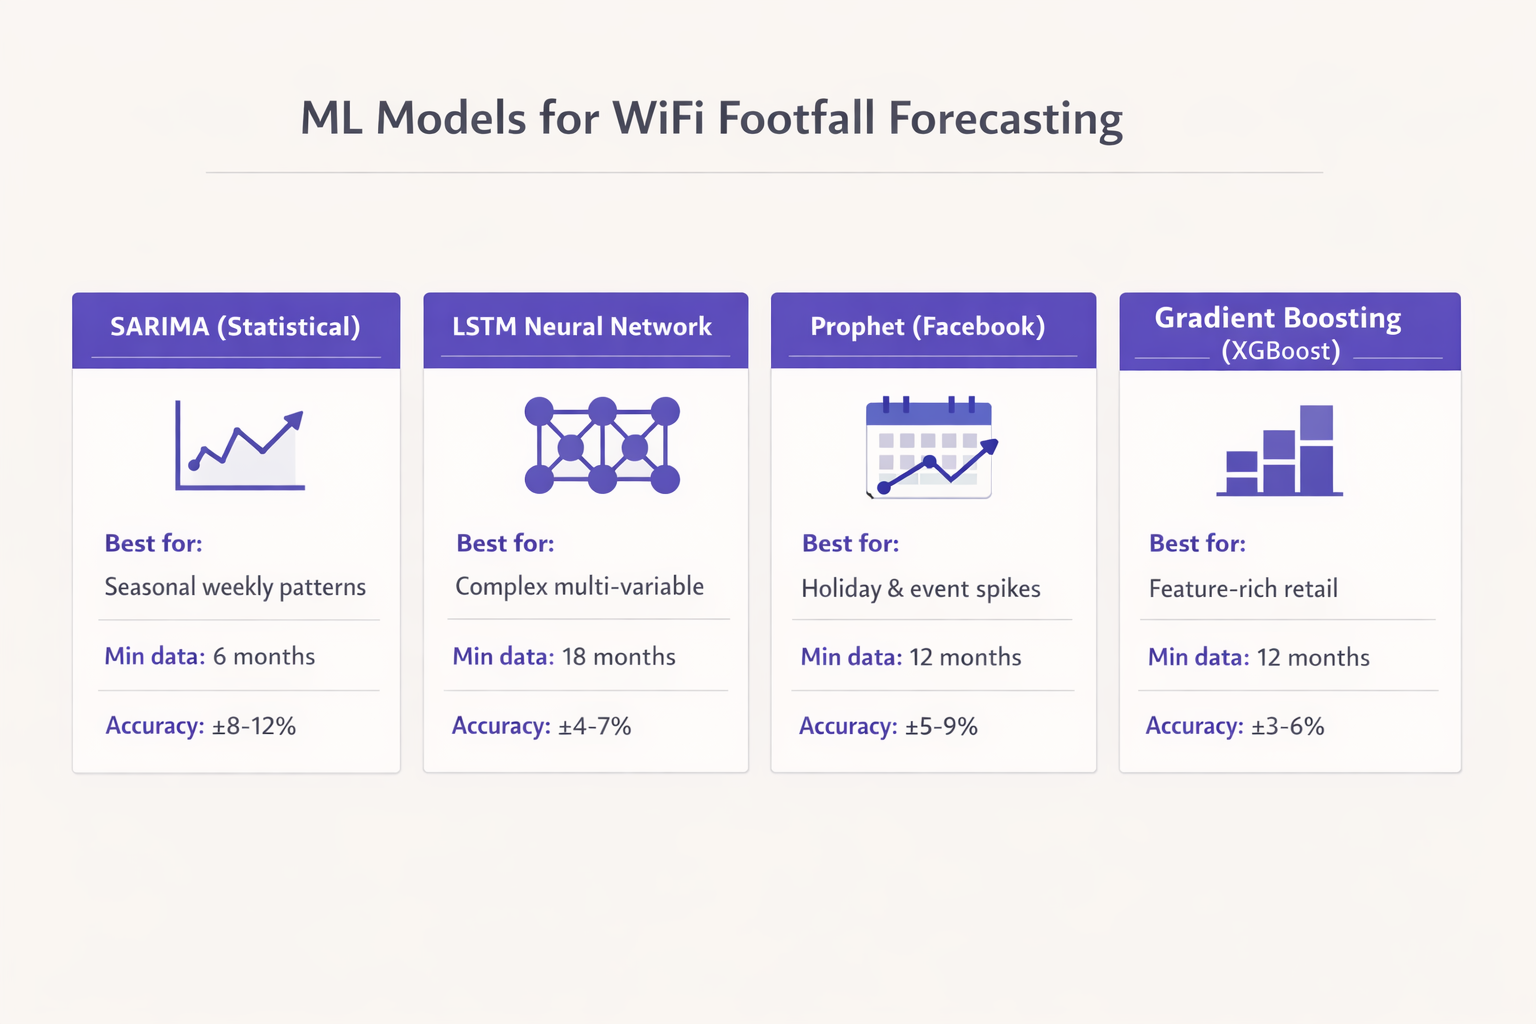
কমপক্ষে ছয় মাসের পরিষ্কার প্রতি ঘণ্টার ডেটা এবং তুলনামূলকভাবে স্থিতিশীল মৌসুমী প্যাটার্ন সহ ভেন্যুগুলির জন্য, Seasonal AutoRegressive Integrated Moving Average (SARIMA) মডেল একটি শক্তিশালী বেসলাইন সরবরাহ করে। SARIMA কমিউটার-মুখী খুচরা বা কর্পোরেট অফিসের মতো পরিবেশে সাপ্তাহিক ছন্দ ক্যাপচার করার জন্য অত্যন্ত কার্যকর। এটি সাধারণত 7-দিনের পূর্বাভাস দিগন্তের জন্য 8-12% পরিসরে একটি Mean Absolute Percentage Error (MAPE) সরবরাহ করে, যা বেসলাইন স্টাফিং অপ্টিমাইজেশনের জন্য যথেষ্ট।
অনিয়মিত স্পাইকগুলি পরিচালনা করা: Prophet
যখন ঐতিহাসিক ডেটা বারো মাস বা তার বেশি হয়, এবং ভেন্যু ছুটি বা প্রচারমূলক ইভেন্টের কারণে অনিয়মিত স্পাইক অনুভব করে, তখন Facebook-এর Prophet মডেল একটি শক্তিশালী প্রার্থী। Prophet স্থানীয়ভাবে পরিবর্তন পয়েন্ট এবং ছুটির প্রভাবগুলি পরিচালনা করে। উপরন্তু, এর ব্যাখ্যামূলক প্রকৃতি অপারেশন দলগুলিকে একটি পূর্বাভাসিত বৃদ্ধির অন্তর্নিহিত চালকগুলি বুঝতে সাহায্য করে, যা এটিকে Transport হাব এবং বড় পাবলিক ভেন্যুগুলির জন্য অত্যন্ত উপযুক্ত করে তোলে।
ফিচার-সমৃদ্ধ পরিবেশ: Gradient Boosting (XGBoost)
জটিল খুচরা পরিবেশে যেখানে পূর্বাভাসে প্রচারমূলক ক্যালেন্ডার, প্রতিযোগী কার্যকলাপ এবং একটি Guest WiFi প্ল্যাটফর্ম থেকে ডেটা অন্তর্ভুক্ত করতে হবে, সেখানে XGBoost-এর মতো গ্রেডিয়েন্ট বুস্টিং মডেলগুলি বিশুদ্ধ পরিসংখ্যানগত পদ্ধতিগুলিকে ধারাবাহিকভাবে ছাড়িয়ে যায়। বারো মাসের প্রশিক্ষণ ডেটা এবং অত্যাধুনিক ফিচার ইঞ্জিনিয়ারিং সহ, XGBoost 3-6% এর MAPE অর্জন করতে পারে। এই স্তরের নির্ভুলতা সাপ্লাই চেইন এবং স্টক পুনরায় পূরণ সিস্টেমের জন্য স্বয়ংক্রিয় ট্রিগার সক্ষম করে।
ডিপ লার্নিং: LSTM নেটওয়ার্ক
Long Short-Term Memory (LSTM) নিউরাল নেটওয়ার্কগুলি দীর্ঘ-পরিসরের টেম্পোরাল নির্ভরতা ক্যাপচার করার জন্য শক্তিশালী। তবে, নির্ভরযোগ্যভাবে প্রশিক্ষণের জন্য তাদের কমপক্ষে আঠারো মাসের উচ্চ-মানের ডেটা প্রয়োজন এবং রক্ষণাবেক্ষণের জন্য এগুলি গণনাগতভাবে ব্যয়বহুল। LSTM মডেলগুলি বড় আকারের স্থাপনাগুলির জন্য সবচেয়ে উপযুক্ত, যেমন বহু-সাইট খুচরা চাইনস বা স্টেডিয়াম অপারেটরদের জন্য, যেখানে অবকাঠামো পরিচালনার জন্য প্রকৌশল সংস্থান উপলব্ধ।
স্থাপনার জন্য সেরা অনুশীলন
অনুমানমূলক ফুটফল অ্যানালিটিক্স-এর সফল স্থাপনার জন্য শিল্পের সেরা অনুশীলনগুলি কঠোরভাবে মেনে চলা প্রয়োজন, অ্যালগরিদম ছাড়িয়ে অন্তর্নিহিত অবকাঠামো এবং অপারেশনাল ইন্টিগ্রেশনের উপর মনোযোগ দিতে হবে।
অবকাঠামো ক্যালিব্রেশন
একটি WiFi-সংযুক্ত ভিজিটর গণনা এবং একটি প্রকৃত ফুটফল গণনার মধ্যে একটি গুরুত্বপূর্ণ পার্থক্য করতে হবে। ভেন্যুর প্রকারের উপর নির্ভর করে ক্যাপচার রেট উল্লেখযোগ্যভাবে পরিবর্তিত হয়। একটি কুইক-সার্ভিস রেস্তোরাঁ 30% ক্যাপচার রেট দেখতে পারে, যখন একটি হোটেল লবি একটি নির্বিঘ্ন WiFi Analytics অভিজ্ঞতা প্রদান করে 80% ছাড়িয়ে যেতে পারে।
পরম নির্ভুলতা প্রতিষ্ঠার জন্য, WiFi-থেকে প্রাপ্ত গণনাগুলিকে একটি গ্রাউন্ড-ট্রুথ উৎসের সাথে ক্যালিব্রেট করতে হবে, যেমন শারীরিক দরজা কাউন্টার বা Point of Sale (POS) লেনদেনের পরিমাণ। যদিও WiFi ডেটা দ্বারা চিহ্নিত আপেক্ষিক প্যাটার্নগুলি তাৎক্ষণিকভাবে নির্ভরযোগ্য, পরম সংখ্যাসূচক পূর্বাভাসের জন্য এই ক্যালিব্রেশন স্তরটি প্রয়োজন।
অ্যাক্সেস পয়েন্ট ঘনত্ব এবং পজিশনিং
জোন-স্তরের ফুটফল গ্রানুলারিটির জন্য, অ্যাক্সেস পয়েন্ট ঘনত্ব অত্যন্ত গুরুত্বপূর্ণ। অ্যাক্সেস পয়েন্টগুলি 15 মিটারের বেশি দূরে স্থাপন করা উচিত নয়, যা ওভারল্যাপিং কভারেজ সেল নিশ্চিত করে। এই ঘনত্ব শুধুমাত্র থ্রুপুটের (যেমন, IEEE 802.11ax পারফরম্যান্স) জন্য নয়, পজিশনিং স্তরের জন্য প্রয়োজনীয় ট্রায়াঙ্গুলেশন নির্ভুলতার জন্যও প্রয়োজন। পজিশনিং প্রযুক্তি সম্পর্কে আরও প্রযুক্তিগত বিবরণের জন্য, Indoor Positioning System: UWB, BLE, & WiFi Guide দেখুন।
সমস্যা সমাধান এবং ঝুঁকি প্রশমন
অনুমানমূলক অ্যানালিটিক্স স্থাপনার সবচেয়ে উল্লেখযোগ্য ঝুঁকি হল মডেল ড্রিফট। ভিজিটর আচরণ স্থির নয়; এটি সামষ্টিক অর্থনৈতিক কারণ, স্থানীয় অবকাঠামোগত পরিবর্তন বা ভেন্যু সংস্কারের প্রতিক্রিয়ায় পরিবর্তিত হয়।
মডেল ড্রিফট পরিচালনা
পরিবর্তন-পূর্ব ডেটার উপর প্রশিক্ষিত মডেলগুলির কার্যকারিতা অনিবার্যভাবে হ্রাস পাবে। এই ঝুঁকি প্রশমিত করতে, IT দলগুলিকে একটি কাঠামোগত রিট্রেনিং ক্যাডেন্স প্রয়োগ করতে হবে। বেশিরভাগ এন্টারপ্রাইজ ভেন্যুর জন্য, মাসিক রিট্রেনিং চক্র যথেষ্ট। তবে, ইভেন্ট স্পেস বা ট্রান্সপোর্ট হাবের মতো উচ্চ-উদ্বায়ী পরিবেশে, নির্ভুলতার সহনশীলতা বজায় রাখতে সাপ্তাহিক রিট্রেনিং প্রয়োজন হতে পারে।
গোপনীয়তা এবং সম্মতি
ঝুঁকি প্রশমন ডেটা গোপনীয়তা পর্যন্তও বিস্তৃত। যখন সঠিকভাবে বেনামী এবং একত্রিত করা হয়, তখন WiFi-থেকে প্রাপ্ত ফুটফল ডেটা GDPR-এর অধীনে ব্যক্তিগত ডেটা গঠন করে না। তবে, সম্মতির জন্য প্রয়োজন যে বেনামীকরণ প্রক্রিয়াটি প্রান্তে বা ইনজেশনের সাথে সাথেই ঘটে, ডেটা মডেল প্রশিক্ষণের জন্য ব্যবহৃত স্থায়ী স্টোরেজ স্তরে প্রবেশ করার আগে।
ROI এবং ব্যবসায়িক প্রভাব
একটি অনুমানমূলক ফুটফল স্থাপনার সাফল্যের চূড়ান্ত পরিমাপ হল অপারেশনাল ওয়ার্কফ্লোতে এর ইন্টিগ্রেশন। পূর্বাভাস একটি নির্দিষ্ট ডাউনস্ট্রিম অ্যাকশনের সাথে সংযুক্ত থাকতে হবে।
প্রদর্শনযোগ্য ফলাফল
যে সংস্থাগুলি এই মডেলগুলি সফলভাবে প্রয়োগ করে, তারা সাধারণত স্থাপনার প্রথম ত্রৈমাসিকের মধ্যেই বিনিয়োগের উপর রিটার্ন দেখতে পায়। মূল ব্যবসায়িক প্রভাবগুলির মধ্যে রয়েছে:
- কর্মী দক্ষতা: পূর্বাভাসিত চাহিদার শিখরের সাথে কর্মীদের রোস্টার সারিবদ্ধ করা, অপ্রয়োজনীয় শ্রম খরচ কমানো এবং একই সাথে বৃদ্ধির সময় পর্যাপ্ত কভারেজ নিশ্চিত করা।
- স্টক অপ্টিমাইজেশন: সাপ্লাই চেইন সিস্টেমের সাথে পূর্বাভাস একত্রিত করে জাস্ট-ইন-টাইম রিফিল ট্রিগার করা, পচনশীল পণ্যে অপচয় কমানো এবং স্টকআউট প্রতিরোধ করা।
- মার্কেটিং ট্রিগার: পূর্বাভাসিত উচ্চ-অবস্থানের সময়গুলির সাথে মিলে প্রচারমূলক প্রচার বা ডিজিটাল সাইনেজ আপডেটগুলির সময় নির্ধারণ করা। জেনারেটিভ AI জড়িত উন্নত বাস্তবায়নের জন্য, Generative AI for Captive Portal Copy and Creative দেখুন।
WiFi নেটওয়ার্ককে একটি কৌশলগত সেন্সর অ্যারে হিসাবে বিবেচনা করে এবং শক্তিশালী মেশিন লার্নিং অনুশীলন প্রয়োগ করে, এন্টারপ্রাইজ IT দলগুলি মৌলিক সংযোগের বাইরে পরিমাপযোগ্য অপারেশনাল মান সরবরাহ করতে পারে।
মূল শব্দ ও সংজ্ঞা
MAC Randomisation
A privacy feature in modern mobile OSs that periodically changes the device's MAC address to prevent long-term tracking.
Forces IT teams to rely on session-based counting and aggregated analytics rather than persistent individual device tracking for footfall forecasting.
RSSI (Received Signal Strength Indicator)
A measurement of the power present in a received radio signal.
Used in the data pipeline to triangulate device position and determine zone transitions, forming the basis of spatial analytics.
Feature Engineering
The process of transforming raw data (like probe requests) into meaningful inputs (features) that a machine learning model can understand.
The critical step where IT teams convert raw network logs into actionable metrics like 'hourly dwell time' or 'zone entry rate'.
Model Drift
The degradation of a machine learning model's predictive accuracy over time due to changes in the underlying data patterns.
Requires IT teams to implement a structured retraining schedule to ensure forecasts remain reliable as venue layouts or visitor behaviors change.
SARIMA
Seasonal AutoRegressive Integrated Moving Average; a statistical model used for forecasting time series data with recurring patterns.
The recommended baseline model for venues with stable weekly rhythms and limited historical data (6-12 months).
Prophet
An open-source forecasting tool developed by Facebook, designed to handle time series data with strong seasonal effects and irregular holidays.
Ideal for event spaces or hospitality venues where irregular spikes (like concerts or bank holidays) disrupt standard seasonal patterns.
XGBoost
Extreme Gradient Boosting; a highly efficient and scalable machine learning algorithm that excels with structured, multi-variable data.
The model of choice for complex retail environments where forecasts must incorporate numerous external variables like weather and promotions.
MAPE (Mean Absolute Percentage Error)
A statistical measure of how accurate a forecast system is, representing the average absolute percent error for each time period.
The primary metric IT directors should use to evaluate model performance and set acceptable accuracy tolerances for operational decisions.
কেস স্টাডিজ
A 200-room hotel with a large conference facility needs to optimize its food and beverage staffing. The current approach relies on historical averages, resulting in understaffing during unexpected conference breakouts and overstaffing on quiet afternoons. They have 14 months of clean WiFi data but limited IT resources.
The IT team should implement a Prophet model rather than a complex LSTM. The data pipeline should aggregate hourly dwell times in the specific zones covering the conference lobby and restaurants. The Prophet model is ideal here because it natively handles the irregular spikes caused by the event calendar (which can be fed in as external regressors). The model output should be integrated directly into the workforce management system, providing a 7-day forecast with a MAPE tolerance of 10%.
A national retail chain wants to automate stock replenishment for high-margin perishable goods across 50 locations. They have 24 months of rich data, including WiFi analytics, POS data, and local weather feeds. They require a highly accurate 3-day forecast.
Given the rich feature set and the requirement for high accuracy (low MAPE) to drive automated supply chain decisions, an XGBoost (Gradient Boosting) model is the optimal choice. The data pipeline must first calibrate the WiFi-derived counts against the POS transaction data to establish a ground-truth baseline. The model will be trained on the 24-month dataset, incorporating weather and promotional calendars as key features. Due to the dynamic nature of retail, an automated weekly retraining cadence must be established to prevent model drift.
দৃশ্যপট বিশ্লেষণ
Q1. A stadium IT director is planning to deploy predictive footfall analytics to manage security staffing at various gates. They have 2 years of historical WiFi data. The venue experiences massive, irregular spikes in attendance based on the event schedule, which changes frequently. Which ML model should they prioritize and why?
💡 ইঙ্গিত:Consider the impact of irregular, schedule-driven spikes on standard statistical models.
প্রস্তাবিত পদ্ধতি দেখুন
They should prioritize the Prophet model (or potentially a well-engineered XGBoost model if integrating many external features). Prophet is specifically designed to handle irregular spikes and changepoints driven by known events (like a match day schedule). While they have enough data for an LSTM, Prophet's interpretability and native handling of holiday/event effects make it more suitable for managing discrete, scheduled surges.
Q2. A retail operations manager complains that the new WiFi-based predictive footfall dashboard is consistently forecasting 40% fewer visitors than the physical door counters report, leading to understaffing. What is the most likely architectural failure in the deployment?
💡 ইঙ্গিত:Think about the difference between a connected device and a human being.
প্রস্তাবিত পদ্ধতি দেখুন
The deployment failed to implement a calibration layer. The system is accurately forecasting the number of WiFi-connected devices (the capture rate), but it has not been calibrated against a ground-truth source (the door counters) to establish the ratio of connected devices to total physical visitors. The IT team must apply a calibration multiplier to the raw forecast.
Q3. Six months after a successful deployment of a predictive staffing model in a large shopping centre, the MAPE (Mean Absolute Percentage Error) has degraded from 5% to 14%. No changes have been made to the code or the infrastructure. What is occurring and how should it be resolved?
💡 ইঙ্গিত:Data patterns change over time, rendering old training data less relevant.
প্রস্তাবিত পদ্ধতি দেখুন
The system is experiencing model drift. Visitor behavior or external factors have changed since the model was initially trained. The IT team must implement a structured retraining cadence, feeding the most recent data back into the model to update its weights and capture the new behavioral patterns.
