Predictive Footfall and AI: Forecasting Visitor Patterns from WiFi Data
This authoritative technical reference guide details how enterprise IT teams and venue operators can leverage WiFi-derived data and machine learning to forecast footfall accurately. It covers the data architecture, ML model selection, privacy considerations, and real-world implementation strategies for turning reactive dashboards into predictive intelligence.
🎧 Listen to this Guide
View Transcript
Executive Summary
For enterprise IT teams and venue operations directors, the existing WiFi infrastructure represents an untapped operational asset. While reactive dashboards provide historical context, the true value of spatial data lies in predictive footfall analytics. By applying machine learning models to anonymised WiFi probe requests and association events, organisations can forecast visitor patterns with sufficient accuracy to drive staffing, stock replenishment, and marketing triggers.
This guide provides a vendor-neutral, technical blueprint for implementing predictive visitor analytics. It moves beyond academic theory to address the practical realities of MAC randomisation, data pipelines, and model drift. Whether you are managing a 200-room hotel, a large retail estate, or a public-sector facility, this reference outlines the architectural requirements and operational workflows necessary to transition from historical reporting to predictive intelligence.
Technical Deep-Dive: The Data Pipeline Architecture
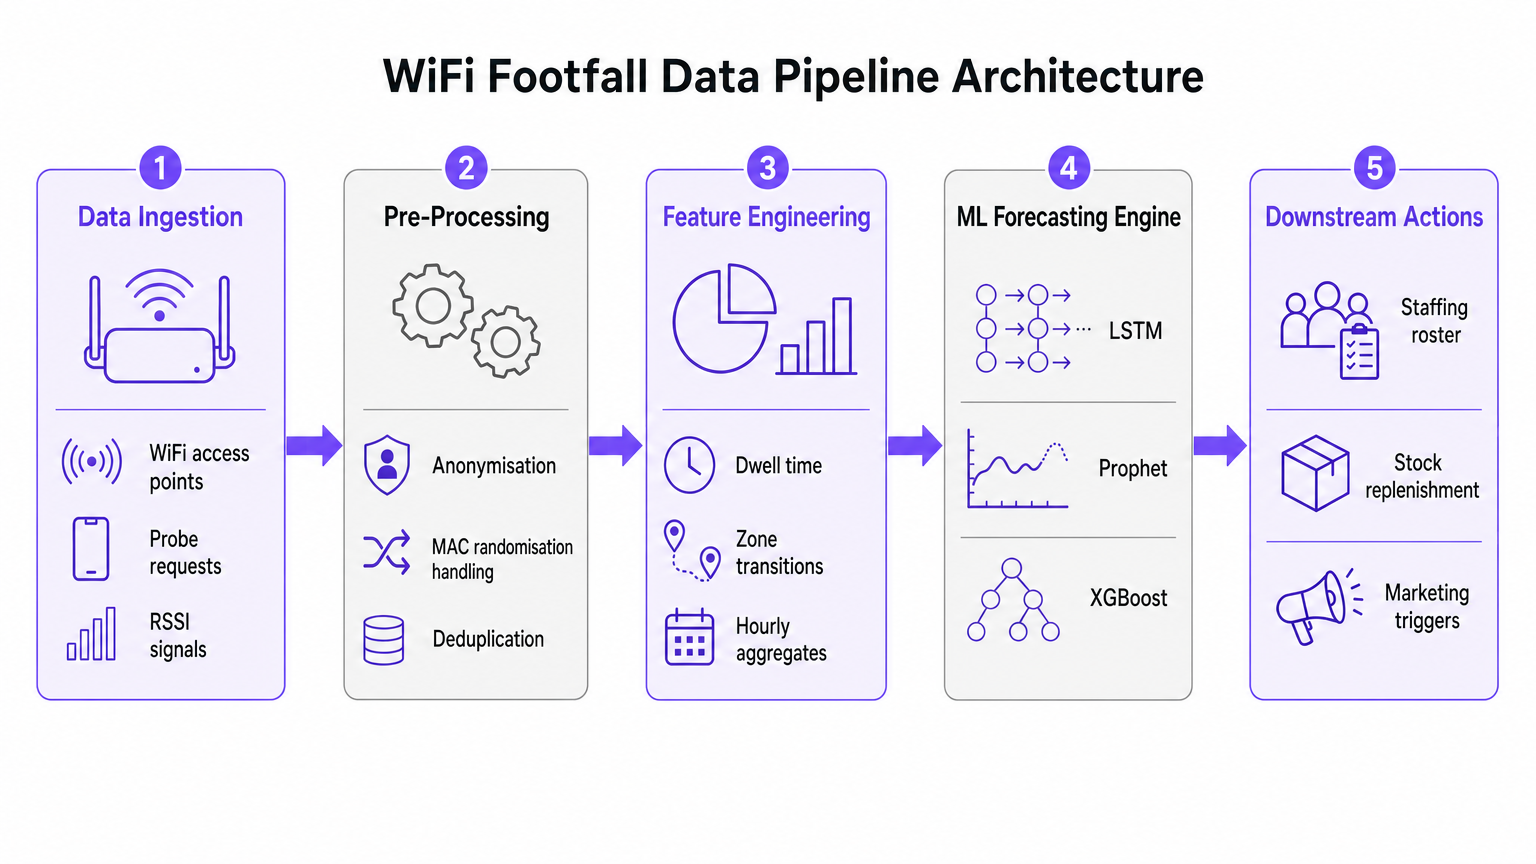
The foundation of any AI footfall forecasting initiative is the data ingestion and pre-processing pipeline. The accuracy of the downstream machine learning model is entirely dependent on the quality of the spatial data extracted from the WiFi network.
Data Ingestion and Signal Processing
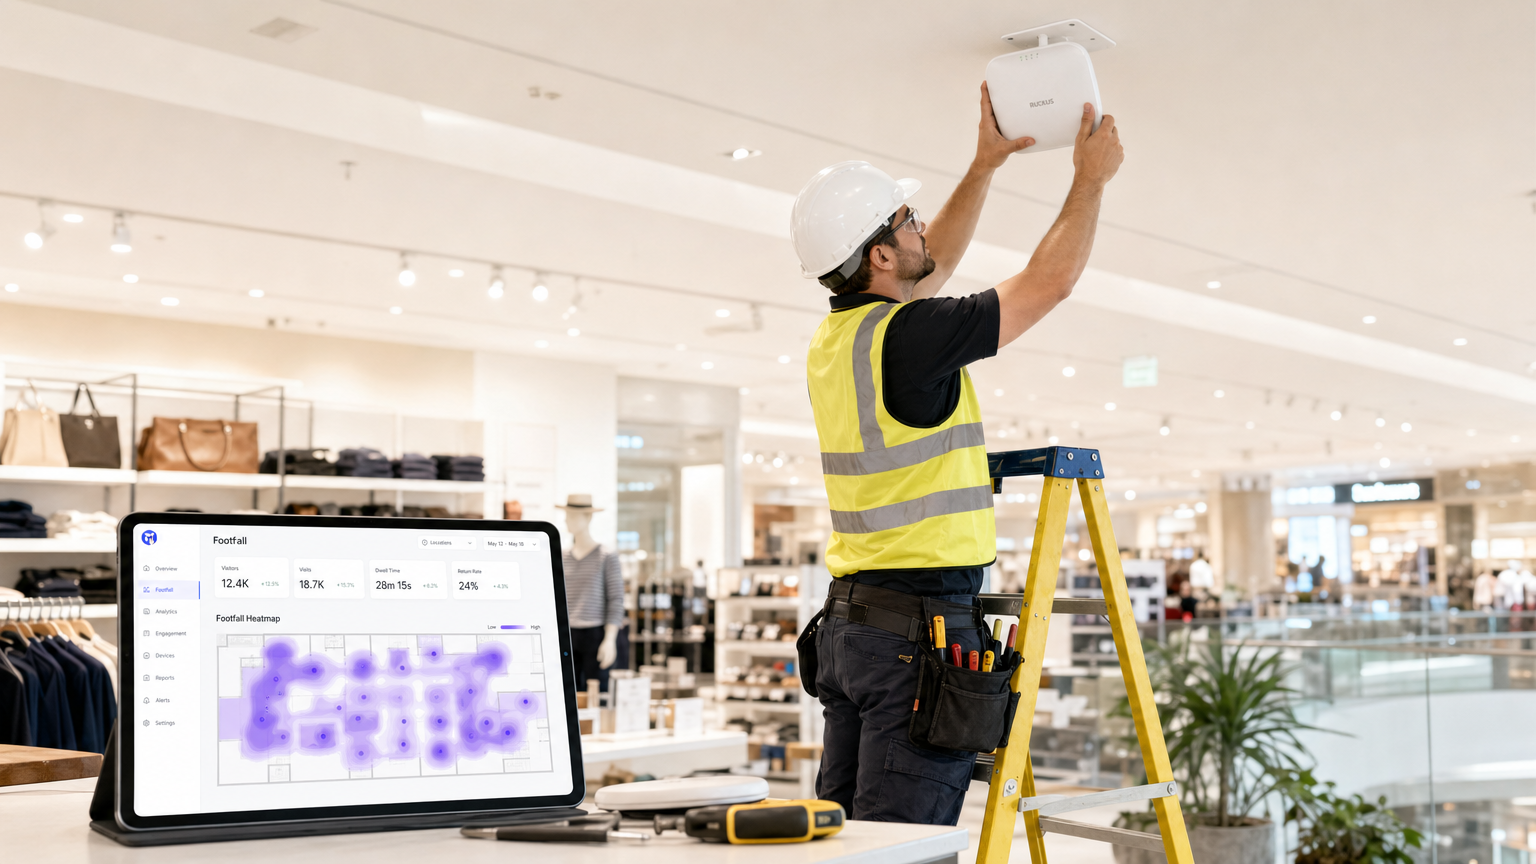
Modern enterprise WiFi networks, such as those deployed in Retail or Hospitality environments, continuously collect probe requests from any Wi-Fi enabled device within range. These events carry critical metadata, including a timestamp, a Received Signal Strength Indicator (RSSI), and a device identifier.
However, the widespread implementation of MAC address randomisation by major mobile operating systems has fundamentally altered device tracking. Modern predictive analytics pipelines do not rely on persistent device identity. Instead, they utilize session-based counting and aggregated dwell time distributions. Anonymised, aggregated data is fully compliant with GDPR and PCI DSS standards while providing the necessary volume for accurate forecasting.
Feature Engineering for Machine Learning
Raw probe requests are not suitable for direct ingestion into forecasting models. The pre-processing layer must handle deduplication, as a single device may generate numerous requests per minute. Once deduplicated and anonymised, the feature engineering stage extracts the metrics that feed the ML forecasting engine.
Key engineered features include:
- Hourly Visitor Counts: Aggregated per zone based on RSSI triangulation.
- Dwell Time Distributions: The duration devices remain within specific coverage areas.
- Zone Transitions: The movement patterns between different areas of a venue.
- External Covariates: Crucial contextual data such as day of the week, public holidays, local events, and weather conditions.
Implementation Guide: Selecting the Right ML Model
The selection of the appropriate machine learning model is dictated by the volume of historical data available and the specific operational decisions the forecast is intended to support. Defaulting to complex neural networks without sufficient data is a common failure mode in enterprise deployments.
Statistical Approaches: SARIMA
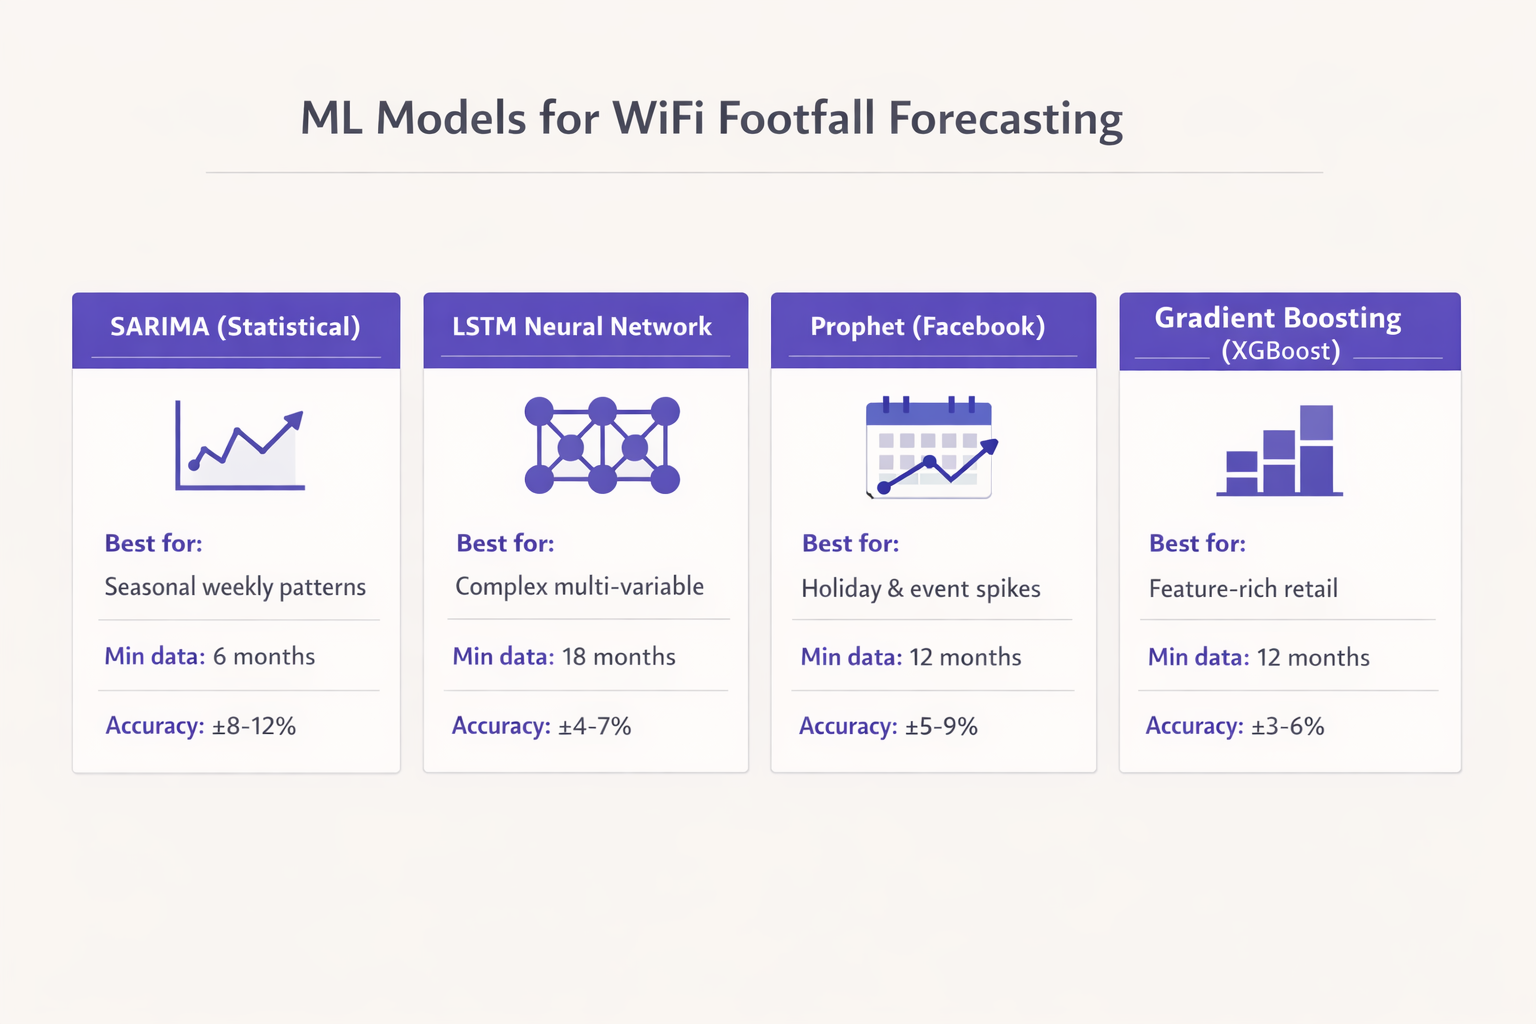
For venues with at least six months of clean hourly data and relatively stable seasonal patterns, the Seasonal AutoRegressive Integrated Moving Average (SARIMA) model provides a robust baseline. SARIMA is highly effective for capturing weekly rhythms in environments like commuter-facing retail or corporate offices. It typically delivers a Mean Absolute Percentage Error (MAPE) in the 8-12% range for a 7-day forecast horizon, which is sufficient for baseline staffing optimization.
Handling Irregular Spikes: Prophet
When historical data extends to twelve months or more, and the venue experiences irregular spikes due to holidays or promotional events, Facebook's Prophet model is a strong candidate. Prophet natively handles changepoints and holiday effects. Furthermore, its interpretable nature allows operations teams to understand the underlying drivers of a predicted surge, making it highly suitable for Transport hubs and large public venues.
Feature-Rich Environments: Gradient Boosting (XGBoost)
In complex retail environments where the forecast must incorporate promotional calendars, competitor activity, and data from a Guest WiFi platform, gradient boosting models like XGBoost consistently outperform purely statistical approaches. With twelve months of training data and sophisticated feature engineering, XGBoost can achieve a MAPE of 3-6%. This level of accuracy enables automated triggers for supply chain and stock replenishment systems.
Deep Learning: LSTM Networks
Long Short-Term Memory (LSTM) neural networks are powerful for capturing long-range temporal dependencies. However, they require a minimum of eighteen months of high-quality data to train reliably and are computationally expensive to maintain. LSTM models are best reserved for large-scale deployments, such as multi-site retail chains or stadium operators, where the engineering resources are available to manage the infrastructure.
Best Practices for Deployment
Successful deployment of predictive footfall analytics requires rigorous adherence to industry best practices, moving beyond the algorithm to focus on the underlying infrastructure and operational integration.
Infrastructure Calibration
A critical distinction must be made between a WiFi-connected visitor count and a true footfall count. Capture rates vary significantly depending on the venue type. A quick-service restaurant may see a 30% capture rate, while a hotel lobby offering a seamless WiFi Analytics experience may exceed 80%.
To establish absolute accuracy, the WiFi-derived counts must be calibrated against a ground-truth source, such as physical door counters or Point of Sale (POS) transaction volumes. While the relative patterns identified by the WiFi data are reliable immediately, the absolute numerical forecast requires this calibration layer.
Access Point Density and Positioning
For zone-level footfall granularity, access point density is paramount. Access points should be deployed no more than 15 metres apart, ensuring overlapping coverage cells. This density is required not just for throughput (e.g., IEEE 802.11ax performance), but for the triangulation accuracy necessary for the positioning layer. For further technical details on positioning technologies, refer to the Indoor Positioning System: UWB, BLE, & WiFi Guide .
Troubleshooting & Risk Mitigation
The most significant risk to predictive analytics deployments is model drift. Visitor behavior is not static; it changes in response to macro-economic factors, local infrastructure changes, or venue refurbishments.
Managing Model Drift
Models trained on pre-change data will inevitably degrade in performance. To mitigate this risk, IT teams must implement a structured retraining cadence. For most enterprise venues, a monthly retraining cycle is sufficient. However, in high-volatility environments such as event spaces or transport hubs, weekly retraining may be necessary to maintain accuracy tolerances.
Privacy and Compliance
Risk mitigation also extends to data privacy. When properly anonymised and aggregated, WiFi-derived footfall data does not constitute personal data under GDPR. However, compliance requires that the anonymisation process occurs at the edge or immediately upon ingestion, before the data enters the persistent storage layer used for model training.
ROI & Business Impact
The ultimate measure of success for a predictive footfall deployment is its integration into operational workflows. The forecast must be connected to a specific downstream action.
Demonstrable Outcomes
Organisations that successfully implement these models typically see a return on investment within the first quarter of deployment. Key business impacts include:
- Staffing Efficiency: Aligning staff rosters with predicted demand peaks, reducing unnecessary labor costs while ensuring adequate coverage during surges.
- Stock Optimisation: Integrating forecasts with supply chain systems to trigger just-in-time replenishment, reducing waste in perishable goods and preventing stockouts.
- Marketing Triggers: Timing promotional pushes or digital signage updates to coincide with predicted high-dwell periods. For advanced implementations involving generative AI, see Generative AI for Captive Portal Copy and Creative .
By treating the WiFi network as a strategic sensor array and applying robust machine learning practices, enterprise IT teams can deliver measurable operational value far beyond basic connectivity.
Key Terms & Definitions
MAC Randomisation
A privacy feature in modern mobile OSs that periodically changes the device's MAC address to prevent long-term tracking.
Forces IT teams to rely on session-based counting and aggregated analytics rather than persistent individual device tracking for footfall forecasting.
RSSI (Received Signal Strength Indicator)
A measurement of the power present in a received radio signal.
Used in the data pipeline to triangulate device position and determine zone transitions, forming the basis of spatial analytics.
Feature Engineering
The process of transforming raw data (like probe requests) into meaningful inputs (features) that a machine learning model can understand.
The critical step where IT teams convert raw network logs into actionable metrics like 'hourly dwell time' or 'zone entry rate'.
Model Drift
The degradation of a machine learning model's predictive accuracy over time due to changes in the underlying data patterns.
Requires IT teams to implement a structured retraining schedule to ensure forecasts remain reliable as venue layouts or visitor behaviors change.
SARIMA
Seasonal AutoRegressive Integrated Moving Average; a statistical model used for forecasting time series data with recurring patterns.
The recommended baseline model for venues with stable weekly rhythms and limited historical data (6-12 months).
Prophet
An open-source forecasting tool developed by Facebook, designed to handle time series data with strong seasonal effects and irregular holidays.
Ideal for event spaces or hospitality venues where irregular spikes (like concerts or bank holidays) disrupt standard seasonal patterns.
XGBoost
Extreme Gradient Boosting; a highly efficient and scalable machine learning algorithm that excels with structured, multi-variable data.
The model of choice for complex retail environments where forecasts must incorporate numerous external variables like weather and promotions.
MAPE (Mean Absolute Percentage Error)
A statistical measure of how accurate a forecast system is, representing the average absolute percent error for each time period.
The primary metric IT directors should use to evaluate model performance and set acceptable accuracy tolerances for operational decisions.
Case Studies
A 200-room hotel with a large conference facility needs to optimize its food and beverage staffing. The current approach relies on historical averages, resulting in understaffing during unexpected conference breakouts and overstaffing on quiet afternoons. They have 14 months of clean WiFi data but limited IT resources.
The IT team should implement a Prophet model rather than a complex LSTM. The data pipeline should aggregate hourly dwell times in the specific zones covering the conference lobby and restaurants. The Prophet model is ideal here because it natively handles the irregular spikes caused by the event calendar (which can be fed in as external regressors). The model output should be integrated directly into the workforce management system, providing a 7-day forecast with a MAPE tolerance of 10%.
A national retail chain wants to automate stock replenishment for high-margin perishable goods across 50 locations. They have 24 months of rich data, including WiFi analytics, POS data, and local weather feeds. They require a highly accurate 3-day forecast.
Given the rich feature set and the requirement for high accuracy (low MAPE) to drive automated supply chain decisions, an XGBoost (Gradient Boosting) model is the optimal choice. The data pipeline must first calibrate the WiFi-derived counts against the POS transaction data to establish a ground-truth baseline. The model will be trained on the 24-month dataset, incorporating weather and promotional calendars as key features. Due to the dynamic nature of retail, an automated weekly retraining cadence must be established to prevent model drift.
Scenario Analysis
Q1. A stadium IT director is planning to deploy predictive footfall analytics to manage security staffing at various gates. They have 2 years of historical WiFi data. The venue experiences massive, irregular spikes in attendance based on the event schedule, which changes frequently. Which ML model should they prioritize and why?
💡 Hint:Consider the impact of irregular, schedule-driven spikes on standard statistical models.
Show Recommended Approach
They should prioritize the Prophet model (or potentially a well-engineered XGBoost model if integrating many external features). Prophet is specifically designed to handle irregular spikes and changepoints driven by known events (like a match day schedule). While they have enough data for an LSTM, Prophet's interpretability and native handling of holiday/event effects make it more suitable for managing discrete, scheduled surges.
Q2. A retail operations manager complains that the new WiFi-based predictive footfall dashboard is consistently forecasting 40% fewer visitors than the physical door counters report, leading to understaffing. What is the most likely architectural failure in the deployment?
💡 Hint:Think about the difference between a connected device and a human being.
Show Recommended Approach
The deployment failed to implement a calibration layer. The system is accurately forecasting the number of WiFi-connected devices (the capture rate), but it has not been calibrated against a ground-truth source (the door counters) to establish the ratio of connected devices to total physical visitors. The IT team must apply a calibration multiplier to the raw forecast.
Q3. Six months after a successful deployment of a predictive staffing model in a large shopping centre, the MAPE (Mean Absolute Percentage Error) has degraded from 5% to 14%. No changes have been made to the code or the infrastructure. What is occurring and how should it be resolved?
💡 Hint:Data patterns change over time, rendering old training data less relevant.
Show Recommended Approach
The system is experiencing model drift. Visitor behavior or external factors have changed since the model was initially trained. The IT team must implement a structured retraining cadence, feeding the most recent data back into the model to update its weights and capture the new behavioral patterns.
