Fluxo de Pessoas Preditivo e IA: Previsão de Padrões de Visitantes a partir de Dados WiFi
Este guia de referência técnica e autoritário detalha como as equipas de TI empresariais e os operadores de espaços podem alavancar dados derivados de WiFi e machine learning para prever o fluxo de pessoas com precisão. Abrange a arquitetura de dados, seleção de modelos de ML, considerações de privacidade e estratégias de implementação no mundo real para transformar dashboards reativos em inteligência preditiva.
🎧 Ouça este Guia
Ver Transcrição
Resumo Executivo
Para as equipas de TI empresariais e diretores de operações de espaços, a infraestrutura WiFi existente representa um ativo operacional inexplorado. Embora os dashboards reativos forneçam contexto histórico, o verdadeiro valor dos dados espaciais reside na análise preditiva do fluxo de pessoas. Ao aplicar modelos de machine learning a pedidos de sonda WiFi anonimizados e eventos de associação, as organizações podem prever padrões de visitantes com precisão suficiente para impulsionar a gestão de pessoal, reabastecimento de stock e gatilhos de marketing.
Este guia fornece um plano técnico, neutro em relação a fornecedores, para implementar análises preditivas de visitantes. Vai além da teoria académica para abordar as realidades práticas da aleatorização de MAC, pipelines de dados e desvio de modelo. Quer esteja a gerir um hotel de 200 quartos, uma grande propriedade de retalho ou uma instalação do setor público, esta referência descreve os requisitos arquitetónicos e os fluxos de trabalho operacionais necessários para fazer a transição de relatórios históricos para inteligência preditiva.
Análise Técnica Detalhada: A Arquitetura do Pipeline de Dados
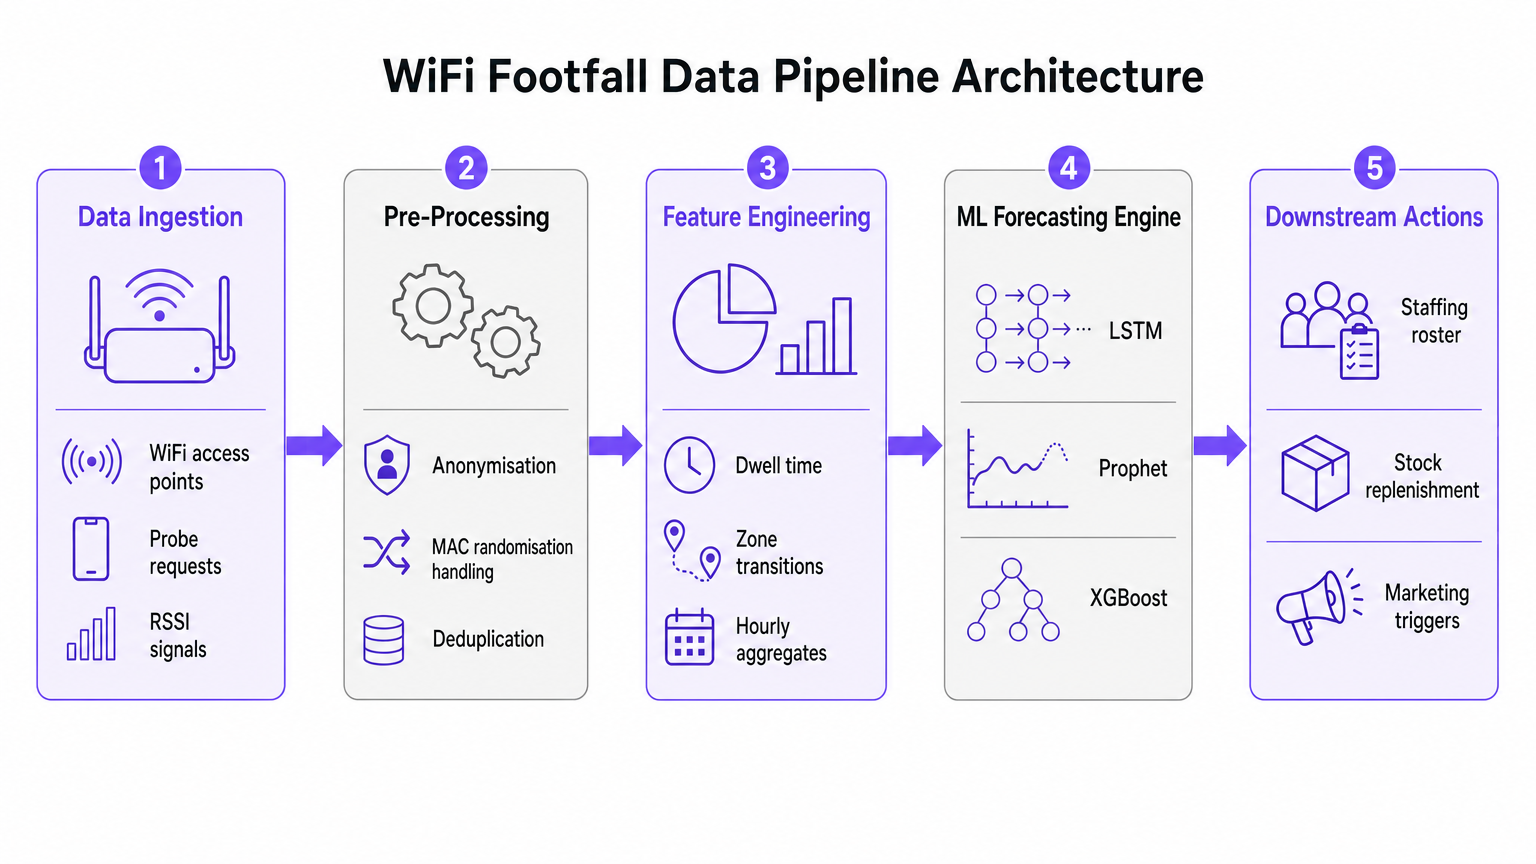
A base de qualquer iniciativa de previsão de fluxo de pessoas por IA é o pipeline de ingestão e pré-processamento de dados. A precisão do modelo de machine learning a jusante depende inteiramente da qualidade dos dados espaciais extraídos da rede WiFi.
Ingestão de Dados e Processamento de Sinal
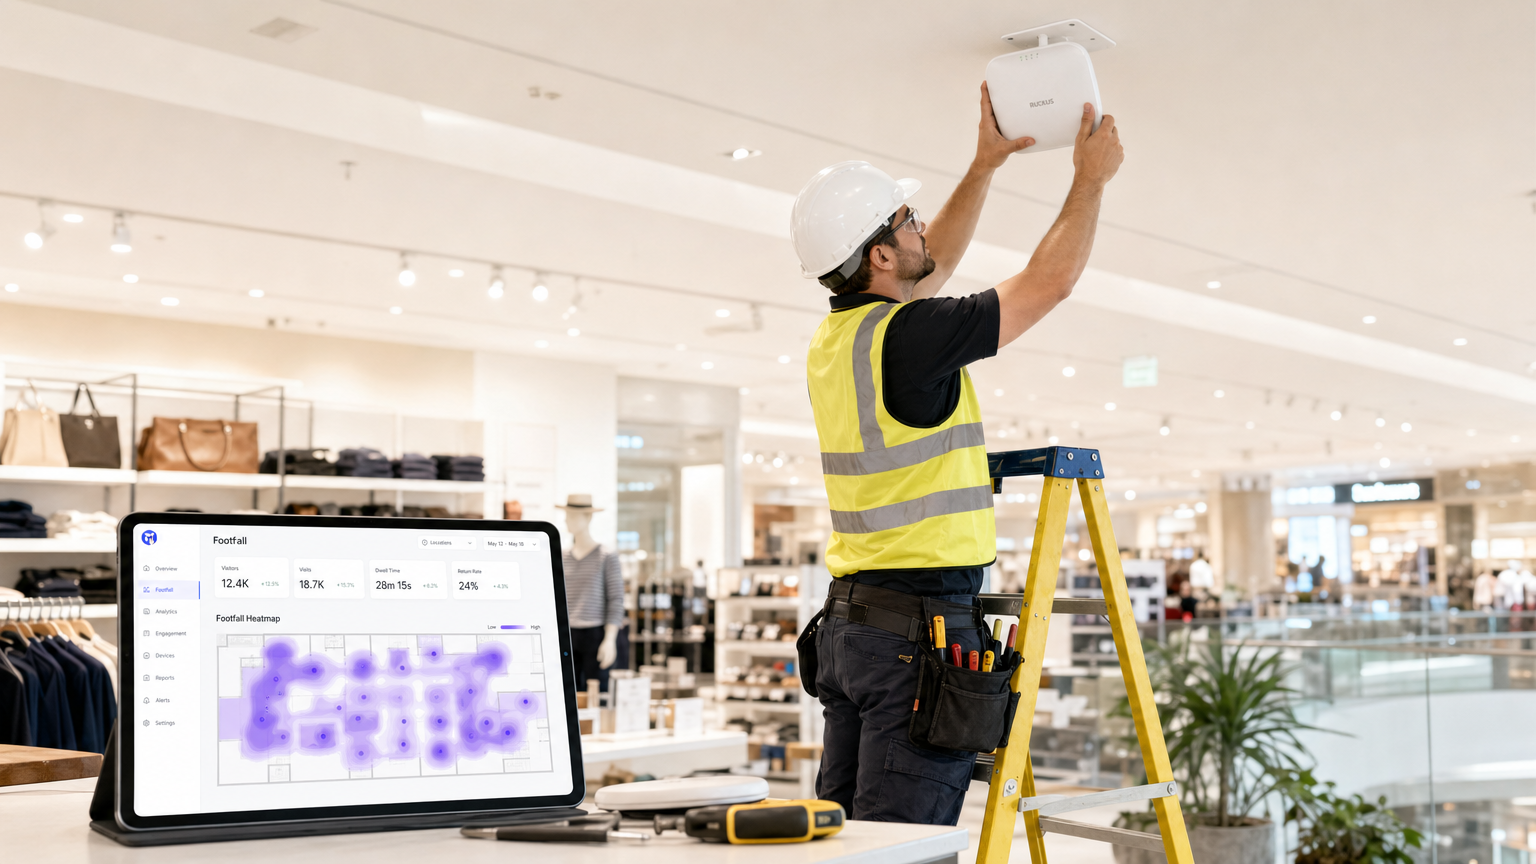
As redes WiFi empresariais modernas, como as implementadas em ambientes de Retalho ou Hotelaria , recolhem continuamente pedidos de sonda de qualquer dispositivo com Wi-Fi ativado dentro do alcance. Estes eventos transportam metadados críticos, incluindo um carimbo de data/hora, um Indicador de Força de Sinal Recebido (RSSI) e um identificador de dispositivo.
No entanto, a implementação generalizada da aleatorização de endereços MAC pelos principais sistemas operativos móveis alterou fundamentalmente o rastreamento de dispositivos. Os pipelines modernos de análise preditiva não dependem de uma identidade de dispositivo persistente. Em vez disso, utilizam contagem baseada em sessão e distribuições agregadas de tempo de permanência. Dados anonimizados e agregados estão em total conformidade com os padrões GDPR e PCI DSS, ao mesmo tempo que fornecem o volume necessário para uma previsão precisa.
Engenharia de Características para Machine Learning
Os pedidos de sonda brutos não são adequados para ingestão direta em modelos de previsão. A camada de pré-processamento deve lidar com a deduplicação, uma vez que um único dispositivo pode gerar inúmeros pedidos por minuto. Uma vez deduplicados e anonimizados, a fase de engenharia de características extrai as métricas que alimentam o motor de previsão de ML.
As principais características engenheiradas incluem:
- Contagens Horárias de Visitantes: Agregadas por zona com base na triangulação RSSI.
- Distribuições de Tempo de Permanência: A duração em que os dispositivos permanecem dentro de áreas de cobertura específicas.
- Transições de Zona: Os padrões de movimento entre diferentes áreas de um espaço.
- Covariáveis Externas: Dados contextuais cruciais, como dia da semana, feriados, eventos locais e condições meteorológicas.
Guia de Implementação: Selecionar o Modelo de ML Certo
A seleção do modelo de machine learning apropriado é ditada pelo volume de dados históricos disponíveis e pelas decisões operacionais específicas que a previsão se destina a apoiar. Recorrer a redes neurais complexas sem dados suficientes é um modo de falha comum em implementações empresariais.
Abordagens Estatísticas: SARIMA
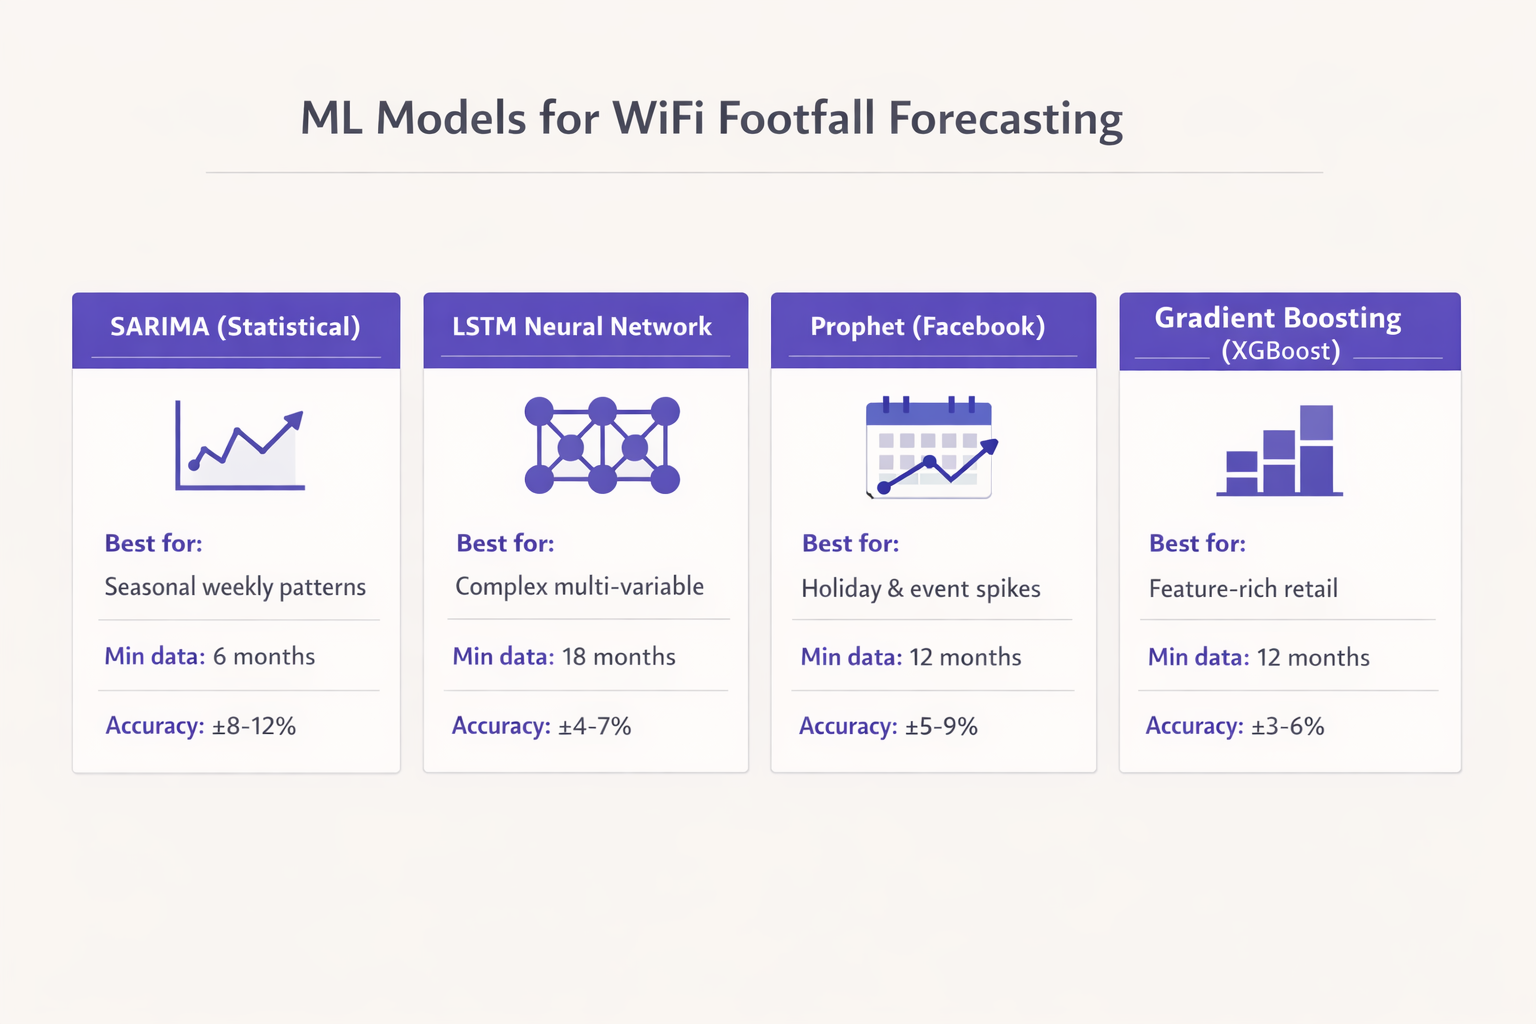
Para espaços com pelo menos seis meses de dados horários limpos e padrões sazonais relativamente estáveis, o modelo Seasonal AutoRegressive Integrated Moving Average (SARIMA) fornece uma linha de base robusta. O SARIMA é altamente eficaz para capturar ritmos semanais em ambientes como retalho focado em pendulares ou escritórios corporativos. Normalmente, apresenta um Erro Percentual Absoluto Médio (MAPE) na faixa de 8-12% para um horizonte de previsão de 7 dias, o que é suficiente para a otimização básica da gestão de pessoal.
Lidar com Picos Irregulares: Prophet
Quando os dados históricos se estendem por doze meses ou mais, e o espaço experimenta picos irregulares devido a feriados ou eventos promocionais, o modelo Prophet do Facebook é um forte candidato. O Prophet lida nativamente com pontos de mudança e efeitos de feriados. Além disso, a sua natureza interpretável permite que as equipas de operações compreendam os fatores subjacentes a um aumento previsto, tornando-o altamente adequado para centros de Transporte e grandes espaços públicos.
Ambientes Ricos em Características: Gradient Boosting (XGBoost)
Em ambientes de retalho complexos onde a previsão deve incorporar calendários promocionais, atividade da concorrência e dados de uma plataforma Guest WiFi , modelos de gradient boosting como o XGBoost superam consistentemente as abordagens puramente estatísticas. Com doze meses de dados de treino e engenharia de características sofisticada, o XGBoost pode atingir um MAPE de 3-6%. Este nível de precisão permite gatilhos automatizados para sistemas de cadeia de abastecimento e reabastecimento de stock.
Deep Learning: Redes LSTM
As redes neurais Long Short-Term Memory (LSTM) são poderosas para capturar dependências temporais de longo alcance. No entanto, exigem um mínimo de dezoito meses de dados de alta qualidade para treinar de forma fiável e são computacionalmente dispendiosas de manter. Os modelos LSTM são mais adequados para implementações em larga escala, como cadeias de retalho multi-siteou operadores de estádios, onde os recursos de engenharia estão disponíveis para gerir a infraestrutura.
Melhores Práticas para Implementação
A implementação bem-sucedida de análises preditivas de fluxo de pessoas exige uma adesão rigorosa às melhores práticas da indústria, indo além do algoritmo para focar na infraestrutura subjacente e na integração operacional.
Calibração da Infraestrutura
É crucial fazer uma distinção entre uma contagem de visitantes conectados via WiFi e uma contagem real de fluxo de pessoas. As taxas de captura variam significativamente dependendo do tipo de local. Um restaurante de serviço rápido pode ter uma taxa de captura de 30%, enquanto um lobby de hotel que oferece uma experiência de WiFi Analytics sem interrupções pode exceder 80%.
Para estabelecer uma precisão absoluta, as contagens derivadas de WiFi devem ser calibradas em relação a uma fonte de verdade, como contadores de porta físicos ou volumes de transações de Ponto de Venda (POS). Embora os padrões relativos identificados pelos dados de WiFi sejam imediatamente fiáveis, a previsão numérica absoluta requer esta camada de calibração.
Densidade e Posicionamento de Pontos de Acesso
Para granularidade de fluxo de pessoas ao nível da zona, a densidade de pontos de acesso é primordial. Os pontos de acesso devem ser implementados a não mais de 15 metros de distância, garantindo células de cobertura sobrepostas. Esta densidade é necessária não apenas para o débito (por exemplo, desempenho IEEE 802.11ax), mas para a precisão de triangulação necessária para a camada de posicionamento. Para mais detalhes técnicos sobre tecnologias de posicionamento, consulte o Indoor Positioning System: UWB, BLE, & WiFi Guide .
Resolução de Problemas e Mitigação de Riscos
O risco mais significativo para as implementações de análises preditivas é a deriva do modelo. O comportamento do visitante não é estático; muda em resposta a fatores macroeconómicos, alterações na infraestrutura local ou remodelações do local.
Gestão da Deriva do Modelo
Os modelos treinados com dados anteriores à mudança irão inevitavelmente degradar o seu desempenho. Para mitigar este risco, as equipas de TI devem implementar uma cadência de retreinamento estruturada. Para a maioria dos locais empresariais, um ciclo de retreinamento mensal é suficiente. No entanto, em ambientes de alta volatilidade, como espaços de eventos ou centros de transporte, pode ser necessário um retreinamento semanal para manter as tolerâncias de precisão.
Privacidade e Conformidade
A mitigação de riscos também se estende à privacidade dos dados. Quando devidamente anonimizados e agregados, os dados de fluxo de pessoas derivados de WiFi não constituem dados pessoais sob o GDPR. No entanto, a conformidade exige que o processo de anonimização ocorra na borda ou imediatamente após a ingestão, antes que os dados entrem na camada de armazenamento persistente usada para o treino do modelo.
ROI e Impacto nos Negócios
A medida máxima de sucesso para uma implementação de fluxo de pessoas preditivo é a sua integração nos fluxos de trabalho operacionais. A previsão deve estar ligada a uma ação específica a jusante.
Resultados Demonstráveis
As organizações que implementam com sucesso estes modelos geralmente veem um retorno sobre o investimento no primeiro trimestre de implementação. Os principais impactos nos negócios incluem:
- Eficiência de Pessoal: Alinhar as escalas de pessoal com os picos de procura previstos, reduzindo custos de mão de obra desnecessários e garantindo cobertura adequada durante os picos.
- Otimização de Stock: Integrar previsões com sistemas de cadeia de abastecimento para acionar o reabastecimento just-in-time, reduzindo o desperdício de bens perecíveis e prevenindo ruturas de stock.
- Gatilhos de Marketing: Sincronizar campanhas promocionais ou atualizações de sinalização digital para coincidir com períodos previstos de alta permanência. Para implementações avançadas que envolvem IA generativa, consulte Generative AI for Captive Portal Copy and Creative .
Ao tratar a rede WiFi como um conjunto estratégico de sensores e aplicar práticas robustas de machine learning, as equipas de TI empresariais podem fornecer valor operacional mensurável muito além da conectividade básica.
Termos-Chave e Definições
MAC Randomisation
A privacy feature in modern mobile OSs that periodically changes the device's MAC address to prevent long-term tracking.
Forces IT teams to rely on session-based counting and aggregated analytics rather than persistent individual device tracking for footfall forecasting.
RSSI (Received Signal Strength Indicator)
A measurement of the power present in a received radio signal.
Used in the data pipeline to triangulate device position and determine zone transitions, forming the basis of spatial analytics.
Feature Engineering
The process of transforming raw data (like probe requests) into meaningful inputs (features) that a machine learning model can understand.
The critical step where IT teams convert raw network logs into actionable metrics like 'hourly dwell time' or 'zone entry rate'.
Model Drift
The degradation of a machine learning model's predictive accuracy over time due to changes in the underlying data patterns.
Requires IT teams to implement a structured retraining schedule to ensure forecasts remain reliable as venue layouts or visitor behaviors change.
SARIMA
Seasonal AutoRegressive Integrated Moving Average; a statistical model used for forecasting time series data with recurring patterns.
The recommended baseline model for venues with stable weekly rhythms and limited historical data (6-12 months).
Prophet
An open-source forecasting tool developed by Facebook, designed to handle time series data with strong seasonal effects and irregular holidays.
Ideal for event spaces or hospitality venues where irregular spikes (like concerts or bank holidays) disrupt standard seasonal patterns.
XGBoost
Extreme Gradient Boosting; a highly efficient and scalable machine learning algorithm that excels with structured, multi-variable data.
The model of choice for complex retail environments where forecasts must incorporate numerous external variables like weather and promotions.
MAPE (Mean Absolute Percentage Error)
A statistical measure of how accurate a forecast system is, representing the average absolute percent error for each time period.
The primary metric IT directors should use to evaluate model performance and set acceptable accuracy tolerances for operational decisions.
Estudos de Caso
A 200-room hotel with a large conference facility needs to optimize its food and beverage staffing. The current approach relies on historical averages, resulting in understaffing during unexpected conference breakouts and overstaffing on quiet afternoons. They have 14 months of clean WiFi data but limited IT resources.
The IT team should implement a Prophet model rather than a complex LSTM. The data pipeline should aggregate hourly dwell times in the specific zones covering the conference lobby and restaurants. The Prophet model is ideal here because it natively handles the irregular spikes caused by the event calendar (which can be fed in as external regressors). The model output should be integrated directly into the workforce management system, providing a 7-day forecast with a MAPE tolerance of 10%.
A national retail chain wants to automate stock replenishment for high-margin perishable goods across 50 locations. They have 24 months of rich data, including WiFi analytics, POS data, and local weather feeds. They require a highly accurate 3-day forecast.
Given the rich feature set and the requirement for high accuracy (low MAPE) to drive automated supply chain decisions, an XGBoost (Gradient Boosting) model is the optimal choice. The data pipeline must first calibrate the WiFi-derived counts against the POS transaction data to establish a ground-truth baseline. The model will be trained on the 24-month dataset, incorporating weather and promotional calendars as key features. Due to the dynamic nature of retail, an automated weekly retraining cadence must be established to prevent model drift.
Análise de Cenários
Q1. A stadium IT director is planning to deploy predictive footfall analytics to manage security staffing at various gates. They have 2 years of historical WiFi data. The venue experiences massive, irregular spikes in attendance based on the event schedule, which changes frequently. Which ML model should they prioritize and why?
💡 Dica:Consider the impact of irregular, schedule-driven spikes on standard statistical models.
Mostrar Abordagem Recomendada
They should prioritize the Prophet model (or potentially a well-engineered XGBoost model if integrating many external features). Prophet is specifically designed to handle irregular spikes and changepoints driven by known events (like a match day schedule). While they have enough data for an LSTM, Prophet's interpretability and native handling of holiday/event effects make it more suitable for managing discrete, scheduled surges.
Q2. A retail operations manager complains that the new WiFi-based predictive footfall dashboard is consistently forecasting 40% fewer visitors than the physical door counters report, leading to understaffing. What is the most likely architectural failure in the deployment?
💡 Dica:Think about the difference between a connected device and a human being.
Mostrar Abordagem Recomendada
The deployment failed to implement a calibration layer. The system is accurately forecasting the number of WiFi-connected devices (the capture rate), but it has not been calibrated against a ground-truth source (the door counters) to establish the ratio of connected devices to total physical visitors. The IT team must apply a calibration multiplier to the raw forecast.
Q3. Six months after a successful deployment of a predictive staffing model in a large shopping centre, the MAPE (Mean Absolute Percentage Error) has degraded from 5% to 14%. No changes have been made to the code or the infrastructure. What is occurring and how should it be resolved?
💡 Dica:Data patterns change over time, rendering old training data less relevant.
Mostrar Abordagem Recomendada
The system is experiencing model drift. Visitor behavior or external factors have changed since the model was initially trained. The IT team must implement a structured retraining cadence, feeding the most recent data back into the model to update its weights and capture the new behavioral patterns.
