Afluencia predictiva e IA: Previsión de patrones de visitantes a partir de datos WiFi
Esta guía de referencia técnica autorizada detalla cómo los equipos de TI empresariales y los operadores de recintos pueden aprovechar los datos derivados de WiFi y el aprendizaje automático para pronosticar la afluencia con precisión. Cubre la arquitectura de datos, la selección de modelos de ML, las consideraciones de privacidad y las estrategias de implementación en el mundo real para transformar los paneles reactivos en inteligencia predictiva.
🎧 Escuchar esta guía
Ver transcripción
Resumen Ejecutivo
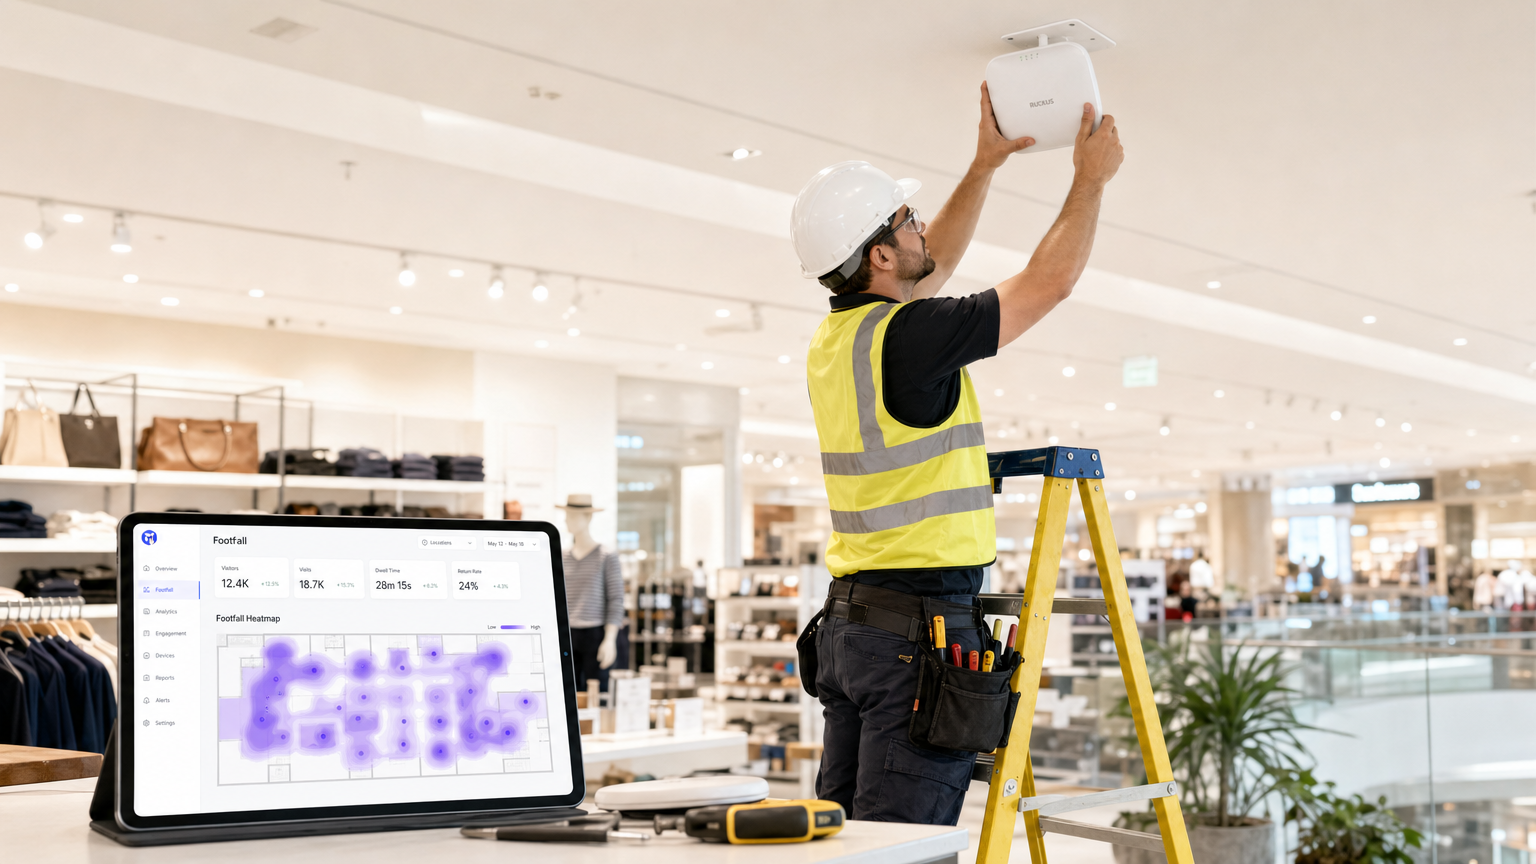
Para los equipos de TI empresariales y los directores de operaciones de recintos, la infraestructura WiFi existente representa un activo operativo sin explotar. Si bien los paneles reactivos proporcionan contexto histórico, el verdadero valor de los datos espaciales reside en el análisis predictivo de la afluencia. Al aplicar modelos de aprendizaje automático a las solicitudes de sondeo WiFi anonimizadas y a los eventos de asociación, las organizaciones pueden pronosticar los patrones de visitantes con la precisión suficiente para impulsar la dotación de personal, la reposición de existencias y los activadores de marketing.
Esta guía proporciona un plan técnico, neutral en cuanto a proveedores, para implementar análisis predictivos de visitantes. Va más allá de la teoría académica para abordar las realidades prácticas de la aleatorización de MAC, las tuberías de datos y la deriva del modelo. Ya sea que gestione un hotel de 200 habitaciones, una gran propiedad minorista o una instalación del sector público, esta referencia describe los requisitos arquitectónicos y los flujos de trabajo operativos necesarios para pasar de la elaboración de informes históricos a la inteligencia predictiva.
Análisis técnico en profundidad: La arquitectura de la tubería de datos
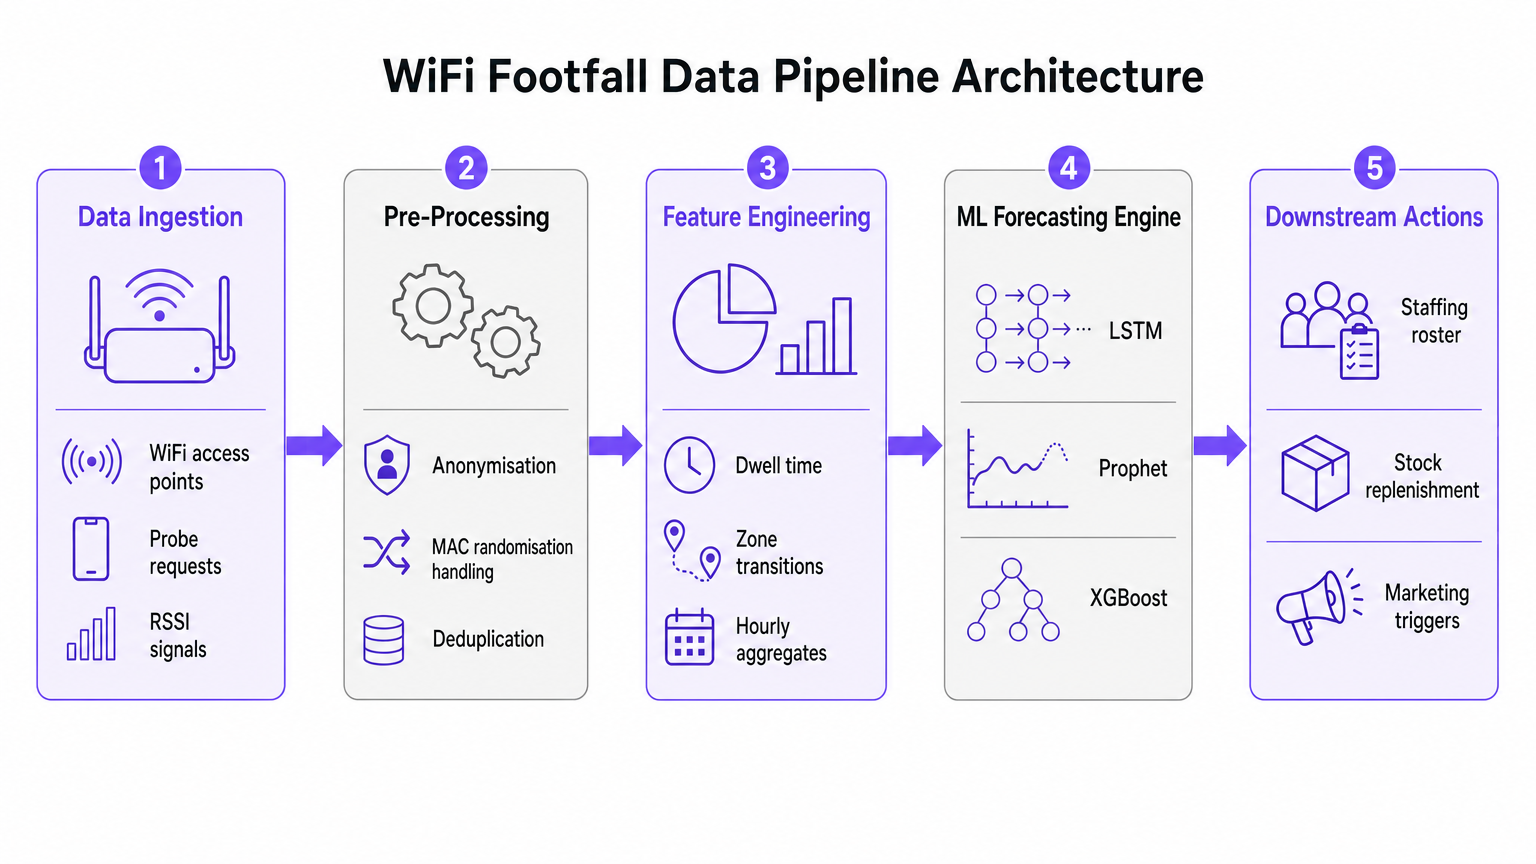
La base de cualquier iniciativa de previsión de afluencia con IA es la tubería de ingesta y preprocesamiento de datos. La precisión del modelo de aprendizaje automático posterior depende completamente de la calidad de los datos espaciales extraídos de la red WiFi.
Ingesta de datos y procesamiento de señales
Las redes WiFi empresariales modernas, como las implementadas en entornos de Retail o Hospitality , recopilan continuamente solicitudes de sondeo de cualquier dispositivo con Wi-Fi dentro del alcance. Estos eventos contienen metadatos críticos, incluyendo una marca de tiempo, un Indicador de Fuerza de Señal Recibida (RSSI) y un identificador de dispositivo.
Sin embargo, la implementación generalizada de la aleatorización de direcciones MAC por parte de los principales sistemas operativos móviles ha alterado fundamentalmente el seguimiento de dispositivos. Las tuberías modernas de análisis predictivo no dependen de la identidad persistente del dispositivo. En su lugar, utilizan el recuento basado en sesiones y las distribuciones agregadas del tiempo de permanencia. Los datos anonimizados y agregados cumplen plenamente con los estándares GDPR y PCI DSS, al tiempo que proporcionan el volumen necesario para una previsión precisa.
Ingeniería de características para el aprendizaje automático
Las solicitudes de sondeo en bruto no son adecuadas para la ingesta directa en modelos de previsión. La capa de preprocesamiento debe manejar la deduplicación, ya que un solo dispositivo puede generar numerosas solicitudes por minuto. Una vez deduplicados y anonimizados, la etapa de ingeniería de características extrae las métricas que alimentan el motor de previsión de ML.
Las características clave diseñadas incluyen:
- Recuentos de visitantes por hora: Agregados por zona basados en la triangulación RSSI.
- Distribuciones del tiempo de permanencia: La duración en que los dispositivos permanecen dentro de áreas de cobertura específicas.
- Transiciones de zona: Los patrones de movimiento entre diferentes áreas de un recinto.
- Covariables externas: Datos contextuales cruciales como el día de la semana, días festivos, eventos locales y condiciones meteorológicas.
Guía de implementación: Selección del modelo de ML adecuado
La selección del modelo de aprendizaje automático apropiado está dictada por el volumen de datos históricos disponibles y las decisiones operativas específicas que la previsión pretende respaldar. Optar por redes neuronales complejas sin datos suficientes es un modo de fallo común en las implementaciones empresariales.
Enfoques estadísticos: SARIMA
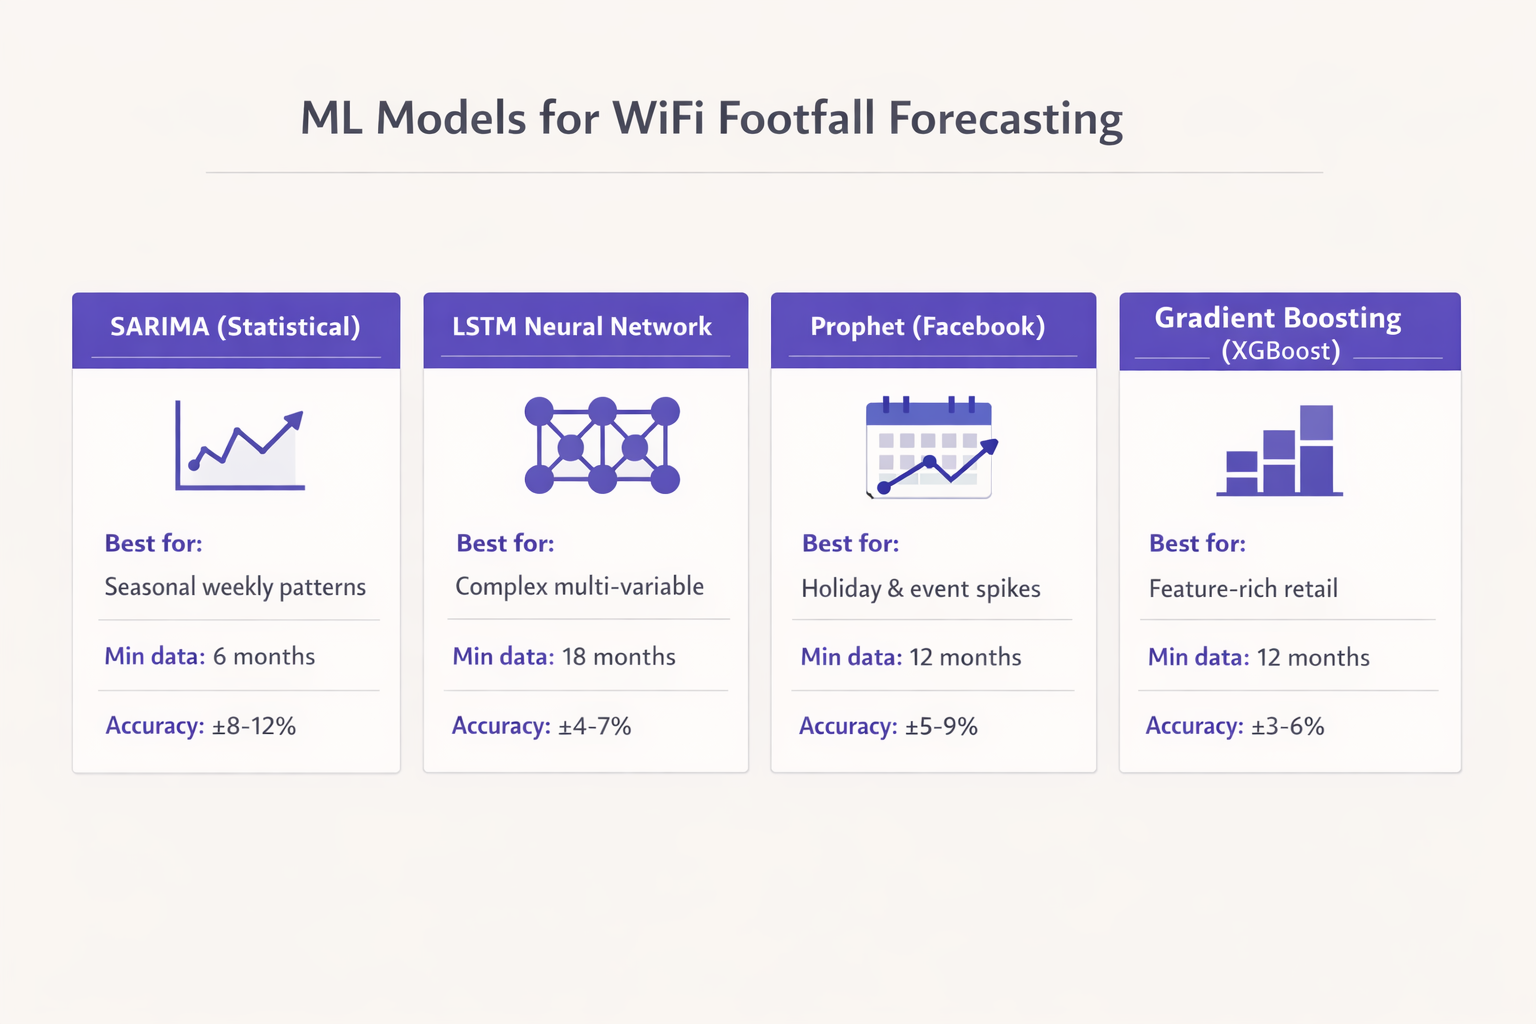
Para recintos con al menos seis meses de datos horarios limpios y patrones estacionales relativamente estables, el modelo de Media Móvil Integrada AutoRegresiva Estacional (SARIMA) proporciona una base sólida. SARIMA es muy eficaz para capturar ritmos semanales en entornos como el comercio minorista orientado a viajeros o las oficinas corporativas. Normalmente, ofrece un Error Porcentual Absoluto Medio (MAPE) en el rango del 8-12% para un horizonte de previsión de 7 días, lo cual es suficiente para la optimización básica de la dotación de personal.
Manejo de picos irregulares: Prophet
Cuando los datos históricos se extienden a doce meses o más, y el recinto experimenta picos irregulares debido a días festivos o eventos promocionales, el modelo Prophet de Facebook es un fuerte candidato. Prophet maneja de forma nativa los puntos de cambio y los efectos de los días festivos. Además, su naturaleza interpretable permite a los equipos de operaciones comprender los factores subyacentes de un aumento previsto, lo que lo hace muy adecuado para centros de Transport y grandes recintos públicos.
Entornos ricos en características: Gradient Boosting (XGBoost)
En entornos minoristas complejos donde la previsión debe incorporar calendarios promocionales, actividad de la competencia y datos de una plataforma de Guest WiFi , los modelos de gradient boosting como XGBoost superan consistentemente a los enfoques puramente estadísticos. Con doce meses de datos de entrenamiento y una ingeniería de características sofisticada, XGBoost puede lograr un MAPE del 3-6%. Este nivel de precisión permite activadores automatizados para los sistemas de cadena de suministro y reposición de existencias.
Aprendizaje profundo: Redes LSTM
Las redes neuronales de memoria a largo y corto plazo (LSTM) son potentes para capturar dependencias temporales de largo alcance. Sin embargo, requieren un mínimo de dieciocho meses de datos de alta calidad para entrenar de forma fiable y son computacionalmente costosas de mantener. Los modelos LSTM se reservan mejor para implementaciones a gran escala, como cadenas minoristas de múltiples sitiosinstalaciones u operadores de estadios, donde los recursos de ingeniería están disponibles para gestionar la infraestructura.
Mejores Prácticas para la Implementación
La implementación exitosa de la analítica predictiva de afluencia requiere una adhesión rigurosa a las mejores prácticas de la industria, yendo más allá del algoritmo para centrarse en la infraestructura subyacente y la integración operativa.
Calibración de la Infraestructura
Debe hacerse una distinción crítica entre un recuento de visitantes conectados por WiFi y un recuento real de afluencia. Las tasas de captura varían significativamente según el tipo de local. Un restaurante de servicio rápido puede ver una tasa de captura del 30%, mientras que el vestíbulo de un hotel que ofrece una experiencia fluida de WiFi Analytics puede superar el 80%.
Para establecer una precisión absoluta, los recuentos derivados de WiFi deben calibrarse con una fuente de verdad fundamental, como contadores de puertas físicos o volúmenes de transacciones de Punto de Venta (POS). Si bien los patrones relativos identificados por los datos WiFi son fiables de inmediato, la previsión numérica absoluta requiere esta capa de calibración.
Densidad y Posicionamiento de Puntos de Acceso
Para una granularidad de afluencia a nivel de zona, la densidad de puntos de acceso es primordial. Los puntos de acceso deben desplegarse a no más de 15 metros de distancia, asegurando celdas de cobertura superpuestas. Esta densidad es necesaria no solo para el rendimiento (p. ej., rendimiento IEEE 802.11ax), sino para la precisión de triangulación necesaria para la capa de posicionamiento. Para más detalles técnicos sobre tecnologías de posicionamiento, consulte la Indoor Positioning System: UWB, BLE, & WiFi Guide .
Resolución de Problemas y Mitigación de Riesgos
El riesgo más significativo para las implementaciones de analítica predictiva es la deriva del modelo. El comportamiento de los visitantes no es estático; cambia en respuesta a factores macroeconómicos, cambios en la infraestructura local o renovaciones del local.
Gestión de la Deriva del Modelo
Los modelos entrenados con datos anteriores a los cambios se degradarán inevitablemente en su rendimiento. Para mitigar este riesgo, los equipos de TI deben implementar una cadencia de reentrenamiento estructurada. Para la mayoría de los locales empresariales, un ciclo de reentrenamiento mensual es suficiente. Sin embargo, en entornos de alta volatilidad, como espacios para eventos o centros de transporte, puede ser necesario un reentrenamiento semanal para mantener las tolerancias de precisión.
Privacidad y Cumplimiento
La mitigación de riesgos también se extiende a la privacidad de los datos. Cuando se anonimizan y agregan correctamente, los datos de afluencia derivados de WiFi no constituyen datos personales según el GDPR. Sin embargo, el cumplimiento requiere que el proceso de anonimización ocurra en el borde o inmediatamente después de la ingesta, antes de que los datos entren en la capa de almacenamiento persistente utilizada para el entrenamiento del modelo.
ROI e Impacto Empresarial
La medida definitiva del éxito para una implementación de afluencia predictiva es su integración en los flujos de trabajo operativos. La previsión debe estar conectada a una acción descendente específica.
Resultados Demostrables
Las organizaciones que implementan con éxito estos modelos suelen ver un retorno de la inversión en el primer trimestre de la implementación. Los impactos empresariales clave incluyen:
- Eficiencia de Personal: Alinear las plantillas de personal con los picos de demanda previstos, reduciendo los costes laborales innecesarios y asegurando una cobertura adecuada durante los aumentos.
- Optimización de Inventario: Integrar las previsiones con los sistemas de la cadena de suministro para activar el reabastecimiento justo a tiempo, reduciendo el desperdicio de productos perecederos y evitando roturas de stock.
- Activadores de Marketing: Programar campañas promocionales o actualizaciones de señalización digital para que coincidan con los períodos de alta permanencia previstos. Para implementaciones avanzadas que involucren IA generativa, consulte Generative AI for Captive Portal Copy and Creative .
Al tratar la red WiFi como un conjunto de sensores estratégico y aplicar prácticas sólidas de aprendizaje automático, los equipos de TI empresariales pueden ofrecer un valor operativo medible mucho más allá de la conectividad básica.
Términos clave y definiciones
MAC Randomisation
A privacy feature in modern mobile OSs that periodically changes the device's MAC address to prevent long-term tracking.
Forces IT teams to rely on session-based counting and aggregated analytics rather than persistent individual device tracking for footfall forecasting.
RSSI (Received Signal Strength Indicator)
A measurement of the power present in a received radio signal.
Used in the data pipeline to triangulate device position and determine zone transitions, forming the basis of spatial analytics.
Feature Engineering
The process of transforming raw data (like probe requests) into meaningful inputs (features) that a machine learning model can understand.
The critical step where IT teams convert raw network logs into actionable metrics like 'hourly dwell time' or 'zone entry rate'.
Model Drift
The degradation of a machine learning model's predictive accuracy over time due to changes in the underlying data patterns.
Requires IT teams to implement a structured retraining schedule to ensure forecasts remain reliable as venue layouts or visitor behaviors change.
SARIMA
Seasonal AutoRegressive Integrated Moving Average; a statistical model used for forecasting time series data with recurring patterns.
The recommended baseline model for venues with stable weekly rhythms and limited historical data (6-12 months).
Prophet
An open-source forecasting tool developed by Facebook, designed to handle time series data with strong seasonal effects and irregular holidays.
Ideal for event spaces or hospitality venues where irregular spikes (like concerts or bank holidays) disrupt standard seasonal patterns.
XGBoost
Extreme Gradient Boosting; a highly efficient and scalable machine learning algorithm that excels with structured, multi-variable data.
The model of choice for complex retail environments where forecasts must incorporate numerous external variables like weather and promotions.
MAPE (Mean Absolute Percentage Error)
A statistical measure of how accurate a forecast system is, representing the average absolute percent error for each time period.
The primary metric IT directors should use to evaluate model performance and set acceptable accuracy tolerances for operational decisions.
Casos de éxito
A 200-room hotel with a large conference facility needs to optimize its food and beverage staffing. The current approach relies on historical averages, resulting in understaffing during unexpected conference breakouts and overstaffing on quiet afternoons. They have 14 months of clean WiFi data but limited IT resources.
The IT team should implement a Prophet model rather than a complex LSTM. The data pipeline should aggregate hourly dwell times in the specific zones covering the conference lobby and restaurants. The Prophet model is ideal here because it natively handles the irregular spikes caused by the event calendar (which can be fed in as external regressors). The model output should be integrated directly into the workforce management system, providing a 7-day forecast with a MAPE tolerance of 10%.
A national retail chain wants to automate stock replenishment for high-margin perishable goods across 50 locations. They have 24 months of rich data, including WiFi analytics, POS data, and local weather feeds. They require a highly accurate 3-day forecast.
Given the rich feature set and the requirement for high accuracy (low MAPE) to drive automated supply chain decisions, an XGBoost (Gradient Boosting) model is the optimal choice. The data pipeline must first calibrate the WiFi-derived counts against the POS transaction data to establish a ground-truth baseline. The model will be trained on the 24-month dataset, incorporating weather and promotional calendars as key features. Due to the dynamic nature of retail, an automated weekly retraining cadence must be established to prevent model drift.
Análisis de escenarios
Q1. A stadium IT director is planning to deploy predictive footfall analytics to manage security staffing at various gates. They have 2 years of historical WiFi data. The venue experiences massive, irregular spikes in attendance based on the event schedule, which changes frequently. Which ML model should they prioritize and why?
💡 Sugerencia:Consider the impact of irregular, schedule-driven spikes on standard statistical models.
Mostrar enfoque recomendado
They should prioritize the Prophet model (or potentially a well-engineered XGBoost model if integrating many external features). Prophet is specifically designed to handle irregular spikes and changepoints driven by known events (like a match day schedule). While they have enough data for an LSTM, Prophet's interpretability and native handling of holiday/event effects make it more suitable for managing discrete, scheduled surges.
Q2. A retail operations manager complains that the new WiFi-based predictive footfall dashboard is consistently forecasting 40% fewer visitors than the physical door counters report, leading to understaffing. What is the most likely architectural failure in the deployment?
💡 Sugerencia:Think about the difference between a connected device and a human being.
Mostrar enfoque recomendado
The deployment failed to implement a calibration layer. The system is accurately forecasting the number of WiFi-connected devices (the capture rate), but it has not been calibrated against a ground-truth source (the door counters) to establish the ratio of connected devices to total physical visitors. The IT team must apply a calibration multiplier to the raw forecast.
Q3. Six months after a successful deployment of a predictive staffing model in a large shopping centre, the MAPE (Mean Absolute Percentage Error) has degraded from 5% to 14%. No changes have been made to the code or the infrastructure. What is occurring and how should it be resolved?
💡 Sugerencia:Data patterns change over time, rendering old training data less relevant.
Mostrar enfoque recomendado
The system is experiencing model drift. Visitor behavior or external factors have changed since the model was initially trained. The IT team must implement a structured retraining cadence, feeding the most recent data back into the model to update its weights and capture the new behavioral patterns.
