Affluenza Predittiva e AI: Previsione dei Modelli di Visita dai Dati WiFi
Questa guida tecnica di riferimento autorevole descrive come i team IT aziendali e gli operatori di sedi possano sfruttare i dati derivati dal WiFi e il machine learning per prevedere l'affluenza con precisione. Copre l'architettura dei dati, la selezione del modello ML, le considerazioni sulla privacy e le strategie di implementazione nel mondo reale per trasformare i dashboard reattivi in intelligenza predittiva.
🎧 Ascolta questa guida
Visualizza trascrizione
Riepilogo Esecutivo
Per i team IT aziendali e i direttori delle operazioni di sede, l'infrastruttura WiFi esistente rappresenta una risorsa operativa non sfruttata. Mentre i dashboard reattivi forniscono un contesto storico, il vero valore dei dati spaziali risiede nell'analisi predittiva dell'affluenza. Applicando modelli di machine learning alle richieste di sonda WiFi anonimizzate e agli eventi di associazione, le organizzazioni possono prevedere i modelli di visita con sufficiente precisione per guidare la pianificazione del personale, il rifornimento delle scorte e gli attivatori di marketing.
Questa guida fornisce un progetto tecnico, indipendente dal fornitore, per l'implementazione di analisi predittive dei visitatori. Va oltre la teoria accademica per affrontare le realtà pratiche della randomizzazione dell'indirizzo MAC, delle pipeline di dati e della deriva del modello. Che tu stia gestendo un hotel di 200 camere, una grande proprietà commerciale o una struttura del settore pubblico, questo riferimento delinea i requisiti architettonici e i flussi di lavoro operativi necessari per passare dalla reportistica storica all'intelligenza predittiva.
Approfondimento Tecnico: L'Architettura della Pipeline di Dati
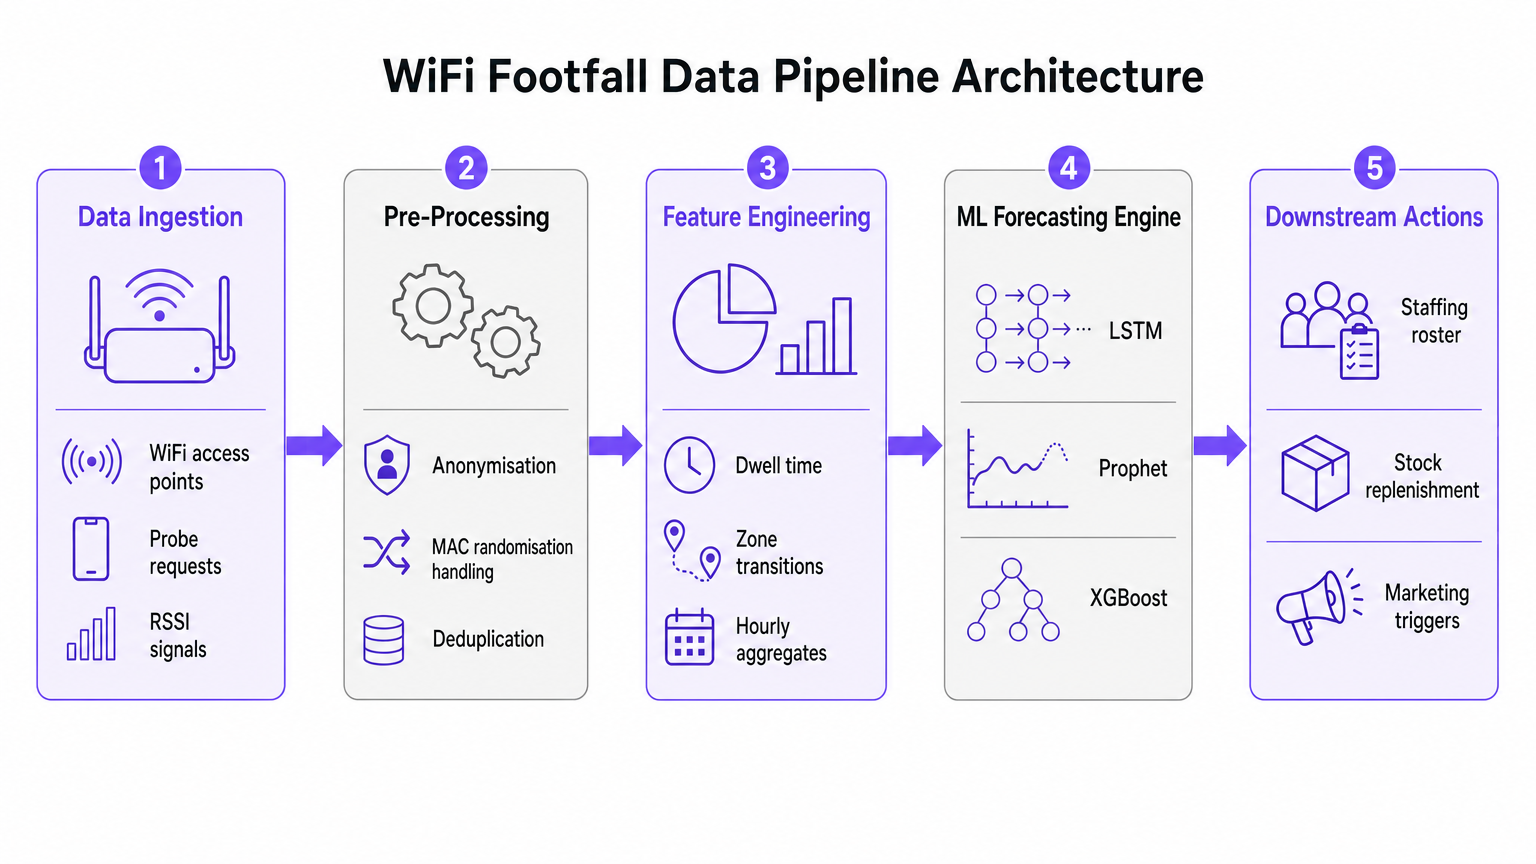
La base di qualsiasi iniziativa di previsione dell'affluenza tramite AI è la pipeline di acquisizione e pre-elaborazione dei dati. L'accuratezza del modello di machine learning a valle dipende interamente dalla qualità dei dati spaziali estratti dalla rete WiFi.
Acquisizione Dati ed Elaborazione del Segnale
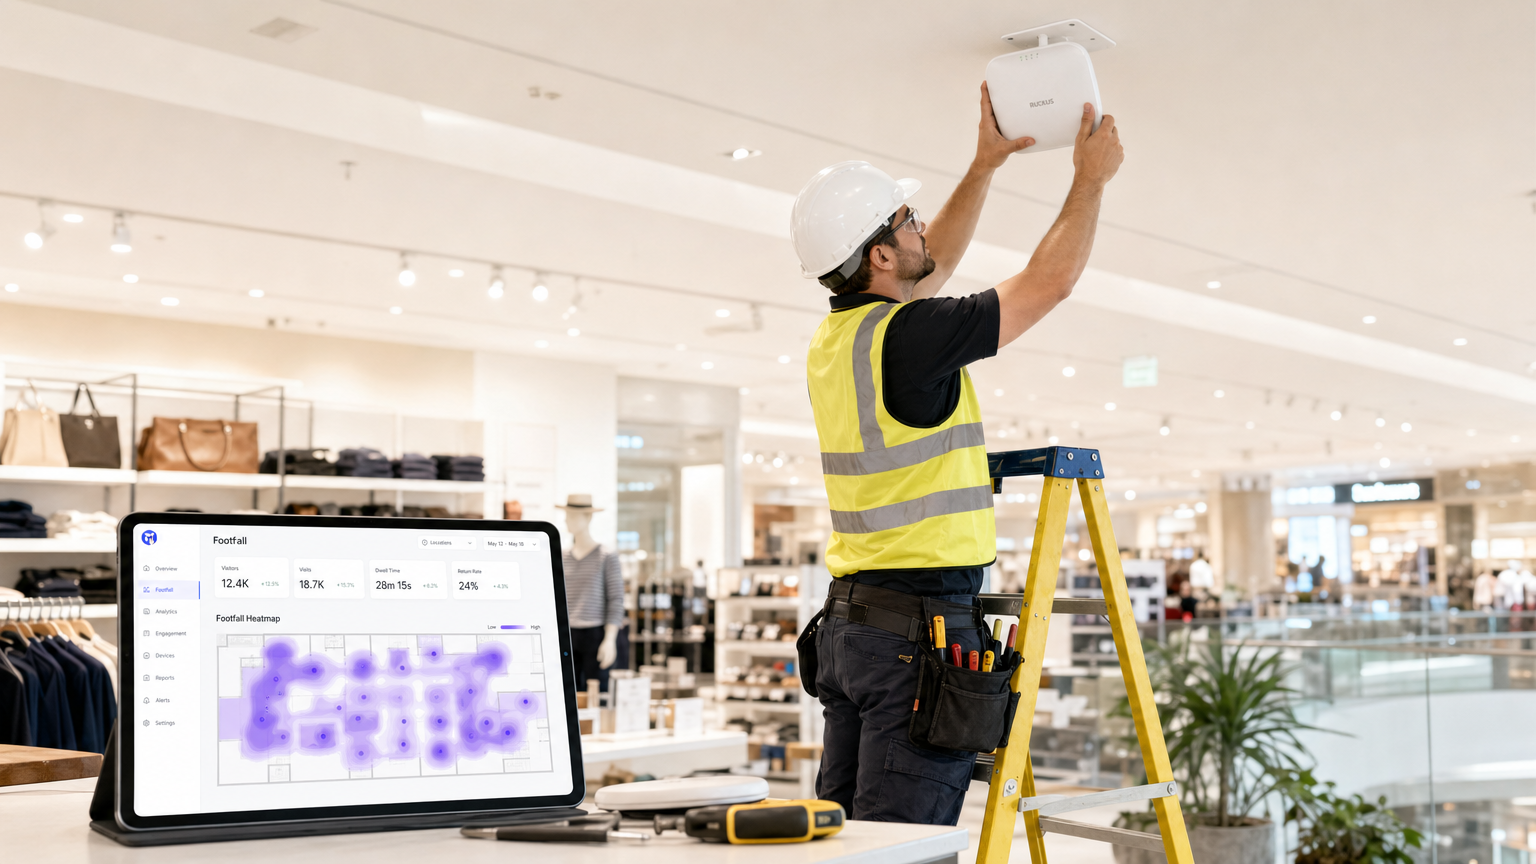
Le moderne reti WiFi aziendali, come quelle implementate in ambienti Retail o Hospitality , raccolgono continuamente richieste di sonda da qualsiasi dispositivo abilitato al Wi-Fi nel raggio d'azione. Questi eventi contengono metadati critici, inclusi un timestamp, un Received Signal Strength Indicator (RSSI) e un identificatore del dispositivo.
Tuttavia, l'ampia implementazione della randomizzazione dell'indirizzo MAC da parte dei principali sistemi operativi mobili ha alterato fondamentalmente il tracciamento dei dispositivi. Le moderne pipeline di analisi predittiva non si basano sull'identità persistente del dispositivo. Invece, utilizzano il conteggio basato sulla sessione e le distribuzioni aggregate del tempo di permanenza. I dati anonimizzati e aggregati sono pienamente conformi agli standard GDPR e PCI DSS, fornendo al contempo il volume necessario per previsioni accurate.
Ingegneria delle Funzionalità per il Machine Learning
Le richieste di sonda grezze non sono adatte per l'ingestione diretta nei modelli di previsione. Lo strato di pre-elaborazione deve gestire la deduplicazione, poiché un singolo dispositivo può generare numerose richieste al minuto. Una volta deduplicato e anonimizzato, lo stadio di ingegneria delle funzionalità estrae le metriche che alimentano il motore di previsione ML.
Le principali funzionalità ingegnerizzate includono:
- Conteggi Orari dei Visitatori: Aggregati per zona basati sulla triangolazione RSSI.
- Distribuzioni del Tempo di Permanenza: La durata in cui i dispositivi rimangono all'interno di specifiche aree di copertura.
- Transizioni di Zona: I modelli di movimento tra diverse aree di una sede.
- Covariate Esterne: Dati contestuali cruciali come il giorno della settimana, le festività pubbliche, gli eventi locali e le condizioni meteorologiche.
Guida all'Implementazione: Selezione del Modello ML Corretto
La selezione del modello di machine learning appropriato è dettata dal volume di dati storici disponibili e dalle specifiche decisioni operative che la previsione intende supportare. Ricorrere a reti neurali complesse senza dati sufficienti è una modalità di fallimento comune nelle implementazioni aziendali.
Approcci Statistici: SARIMA
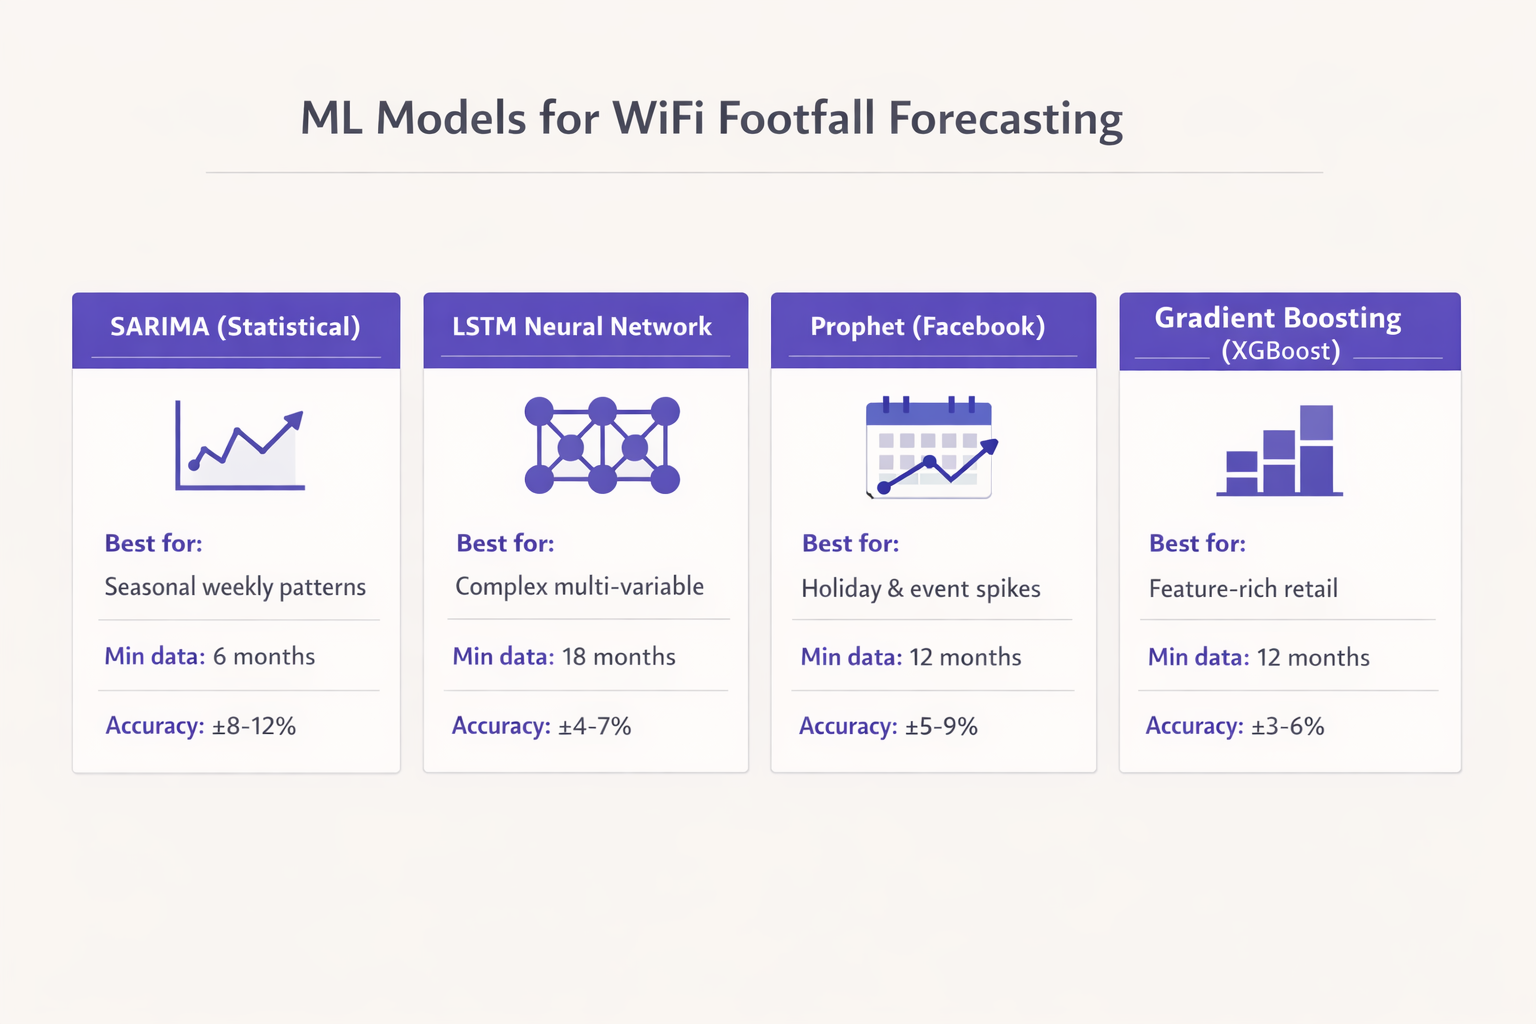
Per le sedi con almeno sei mesi di dati orari puliti e modelli stagionali relativamente stabili, il modello Seasonal AutoRegressive Integrated Moving Average (SARIMA) fornisce una solida base di riferimento. SARIMA è altamente efficace per catturare i ritmi settimanali in ambienti come il commercio al dettaglio rivolto ai pendolari o gli uffici aziendali. Tipicamente fornisce un Errore Percentuale Assoluto Medio (MAPE) nell'intervallo 8-12% per un orizzonte di previsione di 7 giorni, sufficiente per l'ottimizzazione di base del personale.
Gestione dei Picchi Irregolari: Prophet
Quando i dati storici si estendono a dodici mesi o più, e la sede sperimenta picchi irregolari dovuti a festività o eventi promozionali, il modello Prophet di Facebook è un forte candidato. Prophet gestisce nativamente i punti di cambiamento e gli effetti delle festività. Inoltre, la sua natura interpretabile consente ai team operativi di comprendere i fattori sottostanti di un aumento previsto, rendendolo altamente adatto per gli hub di Transport e le grandi sedi pubbliche.
Ambienti Ricchi di Funzionalità: Gradient Boosting (XGBoost)
In ambienti di vendita al dettaglio complessi dove la previsione deve incorporare calendari promozionali, attività della concorrenza e dati da una piattaforma Guest WiFi , i modelli di gradient boosting come XGBoost superano costantemente gli approcci puramente statistici. Con dodici mesi di dati di training e una sofisticata ingegneria delle funzionalità, XGBoost può raggiungere un MAPE del 3-6%. Questo livello di precisione consente attivatori automatizzati per la catena di approvvigionamento e i sistemi di rifornimento delle scorte.
Deep Learning: Reti LSTM
Le reti neurali Long Short-Term Memory (LSTM) sono potenti per catturare dipendenze temporali a lungo raggio. Tuttavia, richiedono un minimo di diciotto mesi di dati di alta qualità per essere addestrate in modo affidabile e sono computazionalmente costose da mantenere. I modelli LSTM sono meglio riservati per implementazioni su larga scala, come le catene di vendita al dettaglio multi-sitooperatori di impianti o stadi, dove le risorse ingegneristiche sono disponibili per gestire l'infrastruttura.
Migliori Pratiche per l'Implementazione
L'implementazione di successo dell'analisi predittiva del flusso di visitatori richiede una rigorosa aderenza alle migliori pratiche del settore, andando oltre l'algoritmo per concentrarsi sull'infrastruttura sottostante e sull'integrazione operativa.
Calibrazione dell'Infrastruttura
È fondamentale distinguere tra un conteggio di visitatori connessi tramite WiFi e un vero conteggio del flusso di visitatori. I tassi di acquisizione variano significativamente a seconda del tipo di struttura. Un ristorante a servizio rapido può registrare un tasso di acquisizione del 30%, mentre la hall di un hotel che offre un'esperienza WiFi Analytics senza interruzioni può superare l'80%.
Per stabilire un'accuratezza assoluta, i conteggi derivati dal WiFi devono essere calibrati rispetto a una fonte di verità sul campo, come contatori fisici alle porte o volumi di transazioni del Point of Sale (POS). Mentre i modelli relativi identificati dai dati WiFi sono immediatamente affidabili, la previsione numerica assoluta richiede questo strato di calibrazione.
Densità e Posizionamento degli Access Point
Per una granularità del flusso di visitatori a livello di zona, la densità degli access point è fondamentale. Gli access point dovrebbero essere distribuiti a non più di 15 metri di distanza l'uno dall'altro, garantendo celle di copertura sovrapposte. Questa densità è necessaria non solo per il throughput (ad esempio, le prestazioni IEEE 802.11ax), ma anche per l'accuratezza della triangolazione necessaria per lo strato di posizionamento. Per ulteriori dettagli tecnici sulle tecnologie di posizionamento, fare riferimento alla Guida ai Sistemi di Posizionamento Indoor: UWB, BLE, & WiFi .
Risoluzione dei Problemi e Mitigazione del Rischio
Il rischio più significativo per le implementazioni di analisi predittiva è il model drift. Il comportamento dei visitatori non è statico; cambia in risposta a fattori macroeconomici, modifiche all'infrastruttura locale o ristrutturazioni della struttura.
Gestione del Model Drift
I modelli addestrati su dati pre-modifica degraderanno inevitabilmente nelle prestazioni. Per mitigare questo rischio, i team IT devono implementare una cadenza di riaddestramento strutturata. Per la maggior parte delle strutture aziendali, un ciclo di riaddestramento mensile è sufficiente. Tuttavia, in ambienti ad alta volatilità come spazi per eventi o hub di trasporto, potrebbe essere necessario un riaddestramento settimanale per mantenere le tolleranze di accuratezza.
Privacy e Conformità
La mitigazione del rischio si estende anche alla privacy dei dati. Se adeguatamente anonimizzati e aggregati, i dati sul flusso di visitatori derivati dal WiFi non costituiscono dati personali ai sensi del GDPR. Tuttavia, la conformità richiede che il processo di anonimizzazione avvenga all'edge o immediatamente dopo l'ingestione, prima che i dati entrino nello strato di archiviazione persistente utilizzato per l'addestramento del modello.
ROI e Impatto sul Business
La misura ultima del successo per un'implementazione predittiva del flusso di visitatori è la sua integrazione nei flussi di lavoro operativi. La previsione deve essere collegata a un'azione specifica a valle.
Risultati Dimostrabili
Le organizzazioni che implementano con successo questi modelli registrano tipicamente un ritorno sull'investimento entro il primo trimestre dall'implementazione. Gli impatti chiave sul business includono:
- Efficienza del Personale: Allineare i turni del personale con i picchi di domanda previsti, riducendo i costi di manodopera non necessari e garantendo una copertura adeguata durante i periodi di maggiore affluenza.
- Ottimizzazione delle Scorte: Integrare le previsioni con i sistemi della supply chain per attivare il rifornimento just-in-time, riducendo gli sprechi di beni deperibili e prevenendo le rotture di stock.
- Trigger di Marketing: Sincronizzare le campagne promozionali o gli aggiornamenti della segnaletica digitale in modo che coincidano con i periodi di permanenza elevata previsti. Per implementazioni avanzate che coinvolgono l'IA generativa, consultare IA Generativa per Copy e Creatività del Captive Portal .
Trattando la rete WiFi come un array di sensori strategico e applicando robuste pratiche di machine learning, i team IT aziendali possono fornire un valore operativo misurabile ben oltre la connettività di base.
Termini chiave e definizioni
MAC Randomisation
A privacy feature in modern mobile OSs that periodically changes the device's MAC address to prevent long-term tracking.
Forces IT teams to rely on session-based counting and aggregated analytics rather than persistent individual device tracking for footfall forecasting.
RSSI (Received Signal Strength Indicator)
A measurement of the power present in a received radio signal.
Used in the data pipeline to triangulate device position and determine zone transitions, forming the basis of spatial analytics.
Feature Engineering
The process of transforming raw data (like probe requests) into meaningful inputs (features) that a machine learning model can understand.
The critical step where IT teams convert raw network logs into actionable metrics like 'hourly dwell time' or 'zone entry rate'.
Model Drift
The degradation of a machine learning model's predictive accuracy over time due to changes in the underlying data patterns.
Requires IT teams to implement a structured retraining schedule to ensure forecasts remain reliable as venue layouts or visitor behaviors change.
SARIMA
Seasonal AutoRegressive Integrated Moving Average; a statistical model used for forecasting time series data with recurring patterns.
The recommended baseline model for venues with stable weekly rhythms and limited historical data (6-12 months).
Prophet
An open-source forecasting tool developed by Facebook, designed to handle time series data with strong seasonal effects and irregular holidays.
Ideal for event spaces or hospitality venues where irregular spikes (like concerts or bank holidays) disrupt standard seasonal patterns.
XGBoost
Extreme Gradient Boosting; a highly efficient and scalable machine learning algorithm that excels with structured, multi-variable data.
The model of choice for complex retail environments where forecasts must incorporate numerous external variables like weather and promotions.
MAPE (Mean Absolute Percentage Error)
A statistical measure of how accurate a forecast system is, representing the average absolute percent error for each time period.
The primary metric IT directors should use to evaluate model performance and set acceptable accuracy tolerances for operational decisions.
Casi di studio
A 200-room hotel with a large conference facility needs to optimize its food and beverage staffing. The current approach relies on historical averages, resulting in understaffing during unexpected conference breakouts and overstaffing on quiet afternoons. They have 14 months of clean WiFi data but limited IT resources.
The IT team should implement a Prophet model rather than a complex LSTM. The data pipeline should aggregate hourly dwell times in the specific zones covering the conference lobby and restaurants. The Prophet model is ideal here because it natively handles the irregular spikes caused by the event calendar (which can be fed in as external regressors). The model output should be integrated directly into the workforce management system, providing a 7-day forecast with a MAPE tolerance of 10%.
A national retail chain wants to automate stock replenishment for high-margin perishable goods across 50 locations. They have 24 months of rich data, including WiFi analytics, POS data, and local weather feeds. They require a highly accurate 3-day forecast.
Given the rich feature set and the requirement for high accuracy (low MAPE) to drive automated supply chain decisions, an XGBoost (Gradient Boosting) model is the optimal choice. The data pipeline must first calibrate the WiFi-derived counts against the POS transaction data to establish a ground-truth baseline. The model will be trained on the 24-month dataset, incorporating weather and promotional calendars as key features. Due to the dynamic nature of retail, an automated weekly retraining cadence must be established to prevent model drift.
Analisi degli scenari
Q1. A stadium IT director is planning to deploy predictive footfall analytics to manage security staffing at various gates. They have 2 years of historical WiFi data. The venue experiences massive, irregular spikes in attendance based on the event schedule, which changes frequently. Which ML model should they prioritize and why?
💡 Suggerimento:Consider the impact of irregular, schedule-driven spikes on standard statistical models.
Mostra l'approccio consigliato
They should prioritize the Prophet model (or potentially a well-engineered XGBoost model if integrating many external features). Prophet is specifically designed to handle irregular spikes and changepoints driven by known events (like a match day schedule). While they have enough data for an LSTM, Prophet's interpretability and native handling of holiday/event effects make it more suitable for managing discrete, scheduled surges.
Q2. A retail operations manager complains that the new WiFi-based predictive footfall dashboard is consistently forecasting 40% fewer visitors than the physical door counters report, leading to understaffing. What is the most likely architectural failure in the deployment?
💡 Suggerimento:Think about the difference between a connected device and a human being.
Mostra l'approccio consigliato
The deployment failed to implement a calibration layer. The system is accurately forecasting the number of WiFi-connected devices (the capture rate), but it has not been calibrated against a ground-truth source (the door counters) to establish the ratio of connected devices to total physical visitors. The IT team must apply a calibration multiplier to the raw forecast.
Q3. Six months after a successful deployment of a predictive staffing model in a large shopping centre, the MAPE (Mean Absolute Percentage Error) has degraded from 5% to 14%. No changes have been made to the code or the infrastructure. What is occurring and how should it be resolved?
💡 Suggerimento:Data patterns change over time, rendering old training data less relevant.
Mostra l'approccio consigliato
The system is experiencing model drift. Visitor behavior or external factors have changed since the model was initially trained. The IT team must implement a structured retraining cadence, feeding the most recent data back into the model to update its weights and capture the new behavioral patterns.
