इनडोर WiFi पोजिशनिंग: गेस्ट नेटवर्क पर लोकेशन ट्रैकिंग कैसे काम करती है
यह आधिकारिक तकनीकी संदर्भ मार्गदर्शिका बताती है कि गेस्ट नेटवर्क पर इनडोर WiFi पोजिशनिंग कैसे काम करती है, जिसमें RSSI ट्रायंगुलेशन, एक्सेस पॉइंट मैपिंग, हीटमैप जनरेशन और एनालिटिक्स प्लेटफॉर्म के साथ एकीकरण शामिल है। यह होटलों, रिटेल चेन, स्टेडियमों और सार्वजनिक क्षेत्र के स्थानों में IT प्रबंधकों, नेटवर्क आर्किटेक्ट्स और CTOs के लिए लिखी गई है, जिन्हें इस तिमाही में डिप्लॉयमेंट का निर्णय लेना है। अंत तक, पाठक प्रोब रिक्वेस्ट से लेकर कार्रवाई योग्य व्यावसायिक बुद्धिमत्ता तक के पूरे डेटा प्रवाह को समझ जाएंगे, जिसमें किसी भी वास्तविक दुनिया के डिप्लॉयमेंट को नियंत्रित करने वाले महत्वपूर्ण अनुपालन और गोपनीयता संबंधी विचार शामिल हैं।
🎧 इस गाइड को सुनें
ट्रांसक्रिप्ट देखें
कार्यकारी सारांश
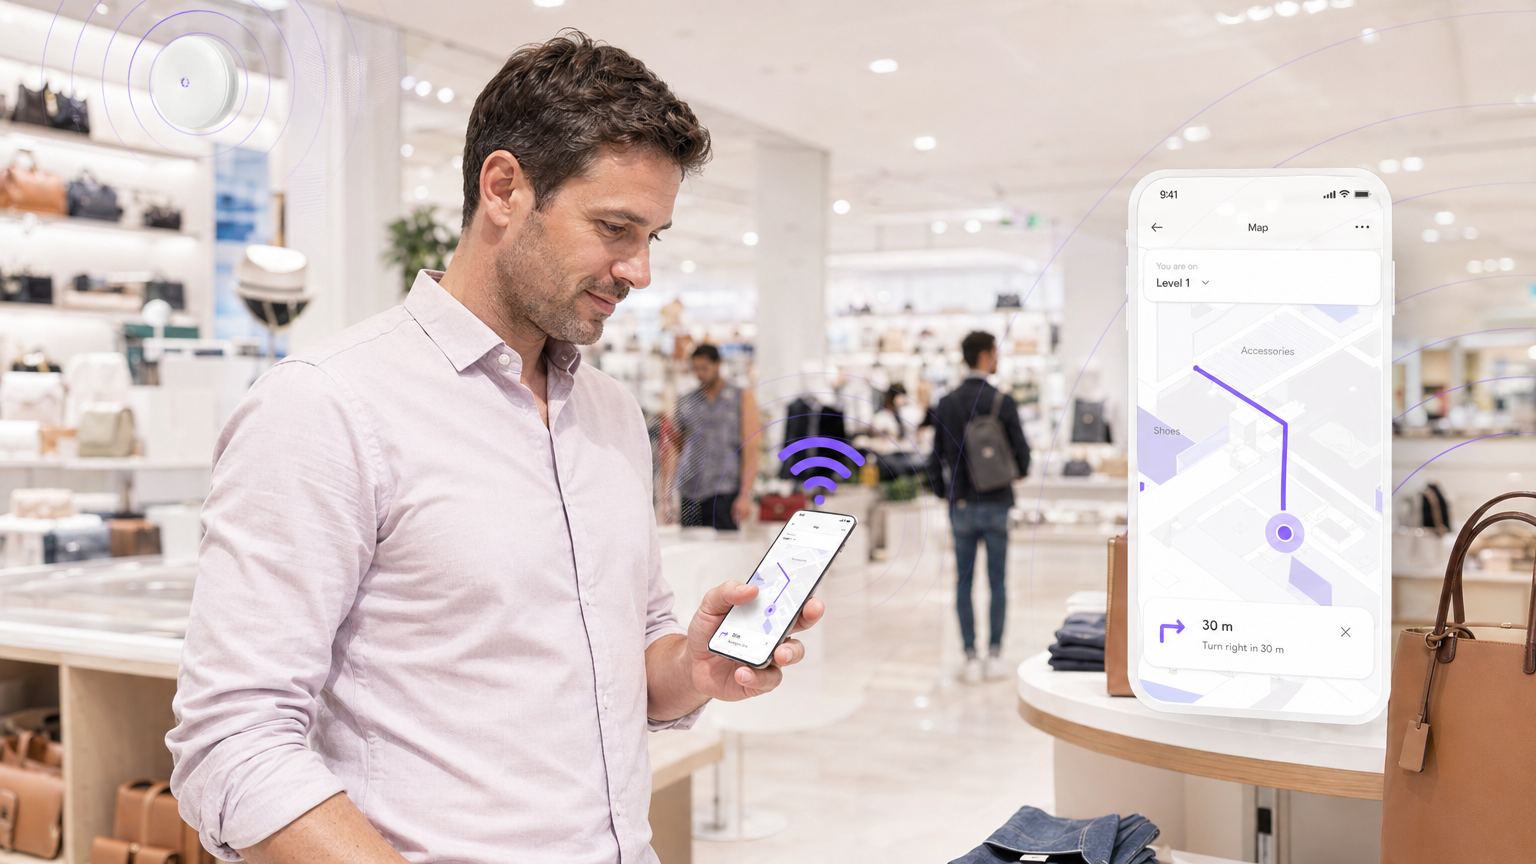
आधुनिक स्थानों के लिए — चाहे वह एक रिटेल फ्लैगशिप हो, एक होटल हो, या एक प्रमुख स्टेडियम हो — भौतिक आगंतुक प्रवाह को समझना उतना ही रणनीतिक रूप से महत्वपूर्ण है जितना डिजिटल वेब ट्रैफिक को ट्रैक करना। GPS इनडोर में विफल रहता है, जिससे एक महत्वपूर्ण दृश्यता अंतर रह जाता है जिससे ऑपरेटरों को वास्तविक राजस्व का नुकसान होता है। यह मार्गदर्शिका बताती है कि एंटरप्राइज़ IT टीमें एक WiFi-आधारित इनडोर पोजिशनिंग सिस्टम (IPS) को डिप्लॉय करने के लिए अपने मौजूदा Guest WiFi इंफ्रास्ट्रक्चर का लाभ कैसे उठा सकती हैं। यह तकनीक नई नहीं है, लेकिन RSSI ट्रायंगुलेशन, कैलिब्रेटेड एक्सेस पॉइंट (AP) मैपिंग और क्लाउड-आधारित WiFi Analytics प्लेटफॉर्म का एकीकरण इतना परिपक्व हो गया है कि डिप्लॉयमेंट अब एक बहु-वर्षीय अनुसंधान पहल के बजाय एक व्यावहारिक, तिमाही-वितरित परियोजना है। यह दस्तावेज़ एक सूचित निर्णय लेने के लिए आवश्यक तकनीकी वास्तुकला, कार्यान्वयन के चरण, सामान्य विफलता मोड और ROI फ्रेमवर्क प्रदान करता है। एनालिटिक्स लेयर के व्यापक परिचय के लिए, हमारी मार्गदर्शिका What Is WiFi Analytics? A Complete Guide देखें।
तकनीकी गहन-विश्लेषण
इनडोर WiFi लोकेशन का भौतिकी
इनडोर पोजिशनिंग की मूलभूत चुनौती यह है कि GPS सिग्नल — जो लगभग 1575 MHz पर काम करते हैं — निर्माण सामग्री से गुजरते समय गंभीर रूप से क्षीण हो जाते हैं। एक कंक्रीट की छत सिग्नल की शक्ति को 20-30 dB तक कम कर सकती है, जिससे GPS एक इमारत की कुछ मंजिलों से नीचे किसी भी चीज़ के लिए अविश्वसनीय हो जाता है। WiFi-आधारित इनडोर पोजिशनिंग इसे किसी भी एंटरप्राइज़ नेटवर्क डिप्लॉयमेंट में पहले से मौजूद 2.4 GHz और 5 GHz सिग्नल का उपयोग करके दरकिनार करती है।
मुख्य तंत्र रिसीव्ड सिग्नल स्ट्रेंथ इंडिकेटर (RSSI) है। जब किसी मोबाइल डिवाइस में WiFi सक्षम होता है, तो वह उपलब्ध नेटवर्क खोजने के लिए समय-समय पर 802.11 प्रोब रिक्वेस्ट फ्रेम प्रसारित करता है। रेंज में मौजूद हर एक्सेस पॉइंट इन फ्रेम को प्राप्त करता है और ट्रांसमिटिंग डिवाइस के MAC एड्रेस को RSSI मान के साथ रिकॉर्ड करता है — सिग्नल शक्ति का एक लॉगरिदमिक माप, जिसे आमतौर पर dBm में व्यक्त किया जाता है, जहाँ -30 dBm एक बहुत मजबूत सिग्नल को दर्शाता है और -90 dBm एक बहुत कमजोर सिग्नल को दर्शाता है।
RSSI ट्रायंगुलेशन (ट्राइलेटरेशन)
एक अकेला AP पुष्टि कर सकता है कि कोई डिवाइस उसके कवरेज क्षेत्र में है, लेकिन दिशा या सटीक दूरी निर्धारित नहीं कर सकता। किसी डिवाइस का पता लगाने के लिए, सिस्टम को एक साथ कम से कम तीन APs से रीडिंग की आवश्यकता होती है — एक प्रक्रिया जिसे सही ढंग से ट्राइलेटरेशन कहा जाता है (हालांकि "ट्रायंगुलेशन" सामान्य उद्योग उपयोग में शब्द है)।
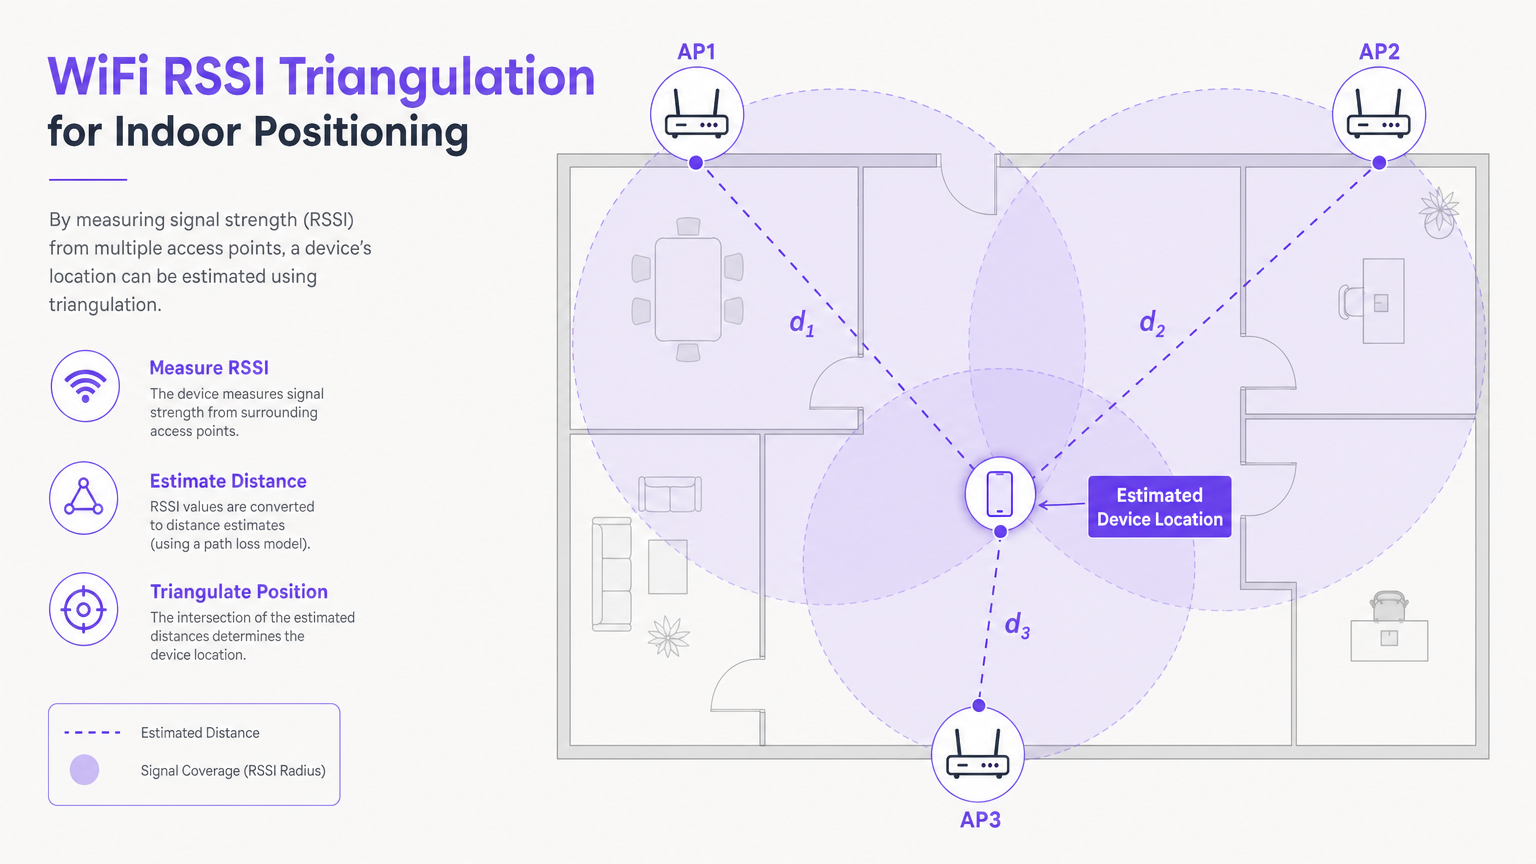
एनालिटिक्स प्लेटफॉर्म प्रत्येक RSSI मान को उस AP से अनुमानित दूरी में बदलने के लिए एक पाथ लॉस मॉडल — आमतौर पर लॉग-डिस्टेंस पाथ लॉस मॉडल — लागू करता है। तीन दूरी के अनुमानों और प्रत्येक AP के ज्ञात भौतिक निर्देशांक के साथ, सिस्टम प्रतिच्छेदन बिंदु को हल करता है, जो डिवाइस के अनुमानित स्थान का प्रतिनिधित्व करता है। व्यवहार में, पर्यावरणीय हस्तक्षेप के कारण, यह प्रतिच्छेदन शायद ही कभी एक सटीक बिंदु होता है; सिस्टम इसके बजाय एक संभाव्यता क्षेत्र की गणना करता है और केंद्रक की रिपोर्ट करता है।
मुख्य सूत्र संदर्भ: लॉग-डिस्टेंस पाथ लॉस मॉडल को इस प्रकार व्यक्त किया जाता है:
PL(d) = PL(d₀) + 10n·log₁₀(d/d₀) + Xσ
जहाँ n पाथ लॉस एक्सपोनेंट है (आमतौर पर इनडोर वातावरण के लिए 2-4), d दूरी है, और Xσ छायांकन प्रभावों का प्रतिनिधित्व करने वाला एक शून्य-माध्य गाऊसी यादृच्छिक चर है।
पैसिव ट्रैकिंग बनाम प्रमाणित एनालिटिक्स
दो परिचालन मोड के बीच अंतर करना आवश्यक है, क्योंकि उनके पास मौलिक रूप से भिन्न डेटा गुणवत्ता और अनुपालन निहितार्थ हैं:
| मोड | ट्रिगर | डेटा गुणवत्ता | अनुपालन विचार |
|---|---|---|---|
| पैसिव उपस्थिति पहचान | डिवाइस में WiFi सक्षम है; कनेक्टेड नहीं है | एकत्रित फुटफॉल, ज़ोन घनत्व | MAC रैंडमाइजेशन व्यक्तिगत ट्रैकिंग को सीमित करता है |
| प्रमाणित एनालिटिक्स | उपयोगकर्ता कैप्टिव पोर्टल के माध्यम से कनेक्ट होता है | समृद्ध फर्स्ट-पार्टी प्रोफाइल, ठहरने का समय, लौटने वाला आगंतुक | लॉगिन पर स्पष्ट GDPR सहमति की आवश्यकता है |
यहाँ MAC रैंडमाइजेशन महत्वपूर्ण चर है। iOS 14 और Android 10 के बाद से, मोबाइल ऑपरेटिंग सिस्टम प्रोब रिक्वेस्ट में उपयोग किए गए MAC एड्रेस को रैंडमाइज करते हैं। इसका मतलब है कि एक डिवाइस प्रत्येक विज़िट पर एक अलग इकाई के रूप में दिखाई देता है, जिससे लौटने वाले व्यक्तियों की पैसिव ट्रैकिंग रुक जाती है। व्यावहारिक निहितार्थ यह है कि पैसिव डेटा एकत्रित हीटमैप और फुटफॉल गणना के लिए उपयोगी है, लेकिन प्रमाणित डेटा — जो उपयोगकर्ता के कैप्टिव पोर्टल के माध्यम से गेस्ट नेटवर्क में लॉग इन करने पर कैप्चर किया जाता है — किसी भी व्यक्तिगत-स्तर के एनालिटिक्स के लिए आवश्यक है।
UWB और BLE सहित पूरक पोजिशनिंग तकनीकों के व्यापक अन्वेषण के लिए, हमारी मार्गदर्शिका Indoor Positioning System: UWB, BLE, & WiFi Guide देखें।
कार्यान्वयन मार्गदर्शिका
चरण 1: पर्यावरण मूल्यांकन और RF योजना
एक भी AP स्थापित होने से पहले, एक गहन RF योजना अभ्यास अनिवार्य है। भौतिक वातावरण सिग्नल प्रसार को निर्धारित करता है, और योजना चरण में की गई धारणाएं जो क्षेत्र में गलत साबित होती हैं, डिप्लॉयमेंट के बाद निदान करने में मुश्किल होने वाले गलत स्थान डेटा का परिणाम होंगी।
AP घनत्व आवश्यकता: सटीक ट्राइलेटरेशन के लिए, कवरेज क्षेत्र में किसी भी बिंदु पर -65 dBm या बेहतर की सिग्नल शक्ति पर एक डिवाइस को कम से कम तीन APs द्वारा सुना जाना चाहिए। यह बुनियादी इंटरनेट एक्सेस कवरेज की तुलना में एक सख्त आवश्यकता है, जो -75 dBm पर कार्य कर सकता है। व्यवहार में, इसका मतलब है खुले वातावरण में लगभग 15-20 मीटर के अंतराल पर APs को डिप्लॉय करना, और उच्च बाधा घनत्व वाले क्षेत्रों (धातु रैक, कंक्रीट कॉलम, कांच के विभाजन) में काफी करीब।
साइट सर्वेक्षण: भौतिक स्थापना से पहले RF योजना सॉफ्टवेयर (जैसे, Ekahau, iBwave) का उपयोग करके एक प्रेडिक्टिव साइट सर्वेक्षण करें। एक सक्रिय साइट सर्वेक्षण के साथ फॉलो अप करें कवरेज को मान्य करने और डेड ज़ोन की पहचान करने के लिए इंस्टॉलेशन के बाद।
चरण 2: AP मैपिंग और प्लेटफ़ॉर्म कॉन्फ़िगरेशन
एक बार जब APs भौतिक रूप से स्थापित हो जाते हैं, तो एनालिटिक्स प्लेटफ़ॉर्म को उनके सटीक निर्देशांक के साथ कॉन्फ़िगर किया जाना चाहिए।
- एनालिटिक्स प्लेटफ़ॉर्म डैशबोर्ड पर एक स्केल्ड फ़्लोर प्लान (PDF, DWG, या PNG प्रारूप में) अपलोड करें।
- प्रत्येक AP के सटीक भौतिक निर्देशांक को डिजिटल फ़्लोर प्लान पर मैप करें। यह कदम गैर-परक्राम्य है — यहाँ कोई भी त्रुटि सीधे स्थान की अशुद्धि में फैल जाती है।
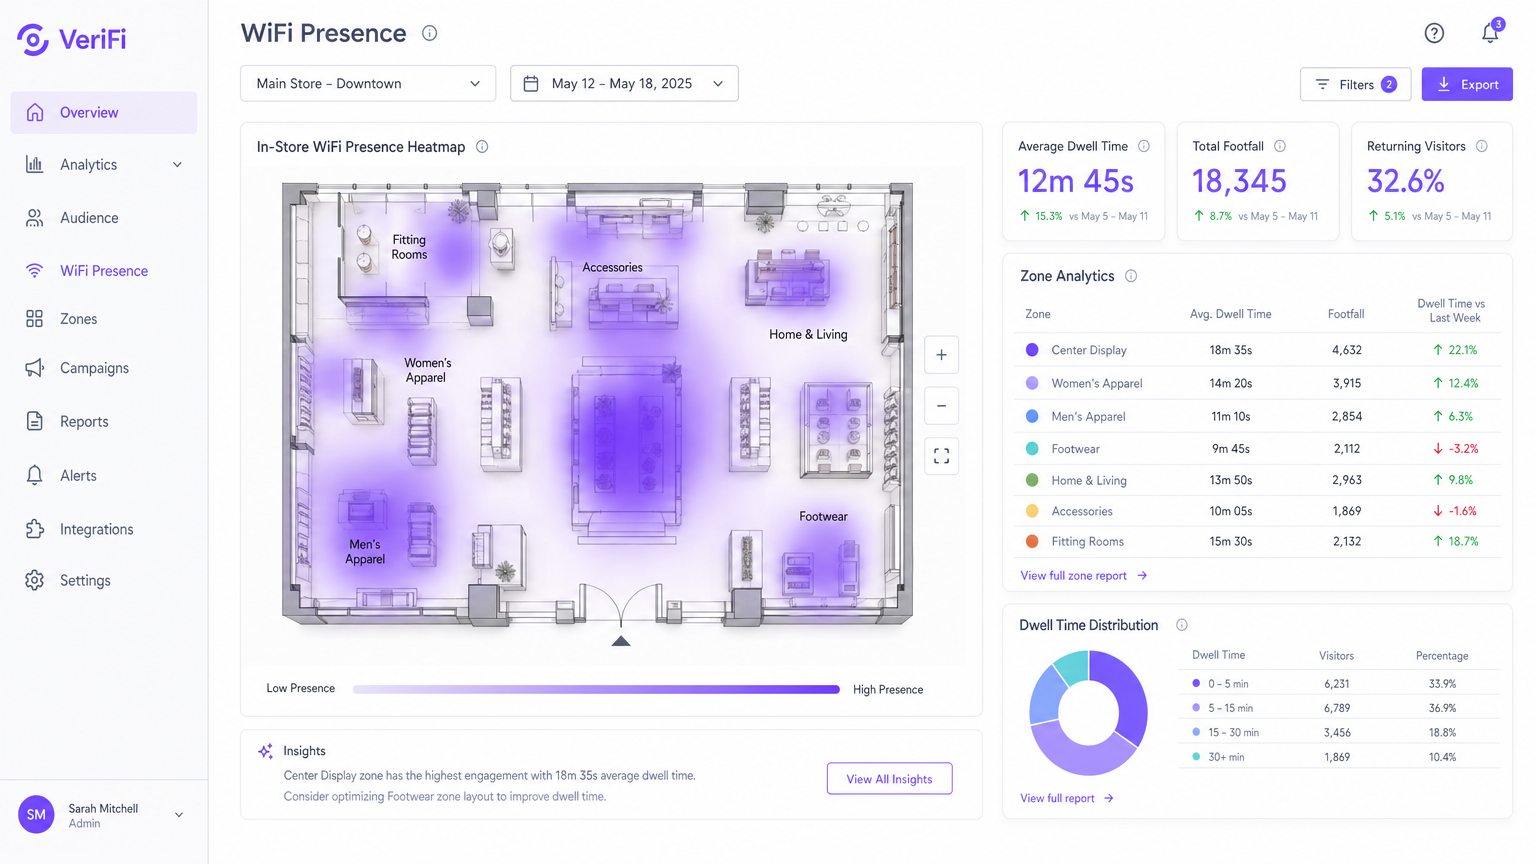
- ज़ोन परिभाषित करें — फ़्लोर प्लान पर नामित बहुभुजीय क्षेत्र (जैसे, "चेकआउट", "मेंसवेयर", "लॉबी") — ताकि प्रति क्षेत्र दानेदार ठहरने का समय और फ़ुटफ़ॉल रिपोर्टिंग सक्षम हो सके।
- वायरलेस LAN कंट्रोलर (WLC) को उपयुक्त API या syslog एकीकरण के माध्यम से एनालिटिक्स प्लेटफ़ॉर्म पर उपस्थिति डेटा अग्रेषित करने के लिए कॉन्फ़िगर करें।
चरण 3: Captive Portal और सहमति फ़्रेमवर्क
प्रमाणीकृत डेटा कैप्चर करने और GDPR तथा समान फ़्रेमवर्क का पालन करने के लिए, एक captive portal तैनात करें जो नेटवर्क एक्सेस प्रदान करने से पहले उपयोगकर्ताओं को एक स्पष्ट सहमति सूचना प्रस्तुत करता है। पोर्टल को न्यूनतम रूप से कैप्चर करना चाहिए: नाम, ईमेल पता, और एनालिटिक्स उद्देश्यों के लिए डेटा प्रोसेसिंग के लिए स्पष्ट सहमति।
सर्वोत्तम अभ्यास
एनालिटिक्स के लिए 5 GHz पर मानकीकरण करें: जबकि 2.4 GHz दीवारों में अधिक प्रभावी ढंग से प्रवेश करता है, यह अत्यधिक भीड़भाड़ वाला है और Bluetooth, माइक्रोवेव ओवन और पड़ोसी नेटवर्क से हस्तक्षेप के अधीन है। क्लाइंट्स को 5 GHz पर निर्देशित करने से स्वच्छ, अधिक सुसंगत RSSI रीडिंग मिलती है, जिससे स्थान की सटीकता में सुधार होता है। सक्षम क्लाइंट्स के लिए 5 GHz को प्राथमिकता देने के लिए WLC पर बैंड स्टीयरिंग कॉन्फ़िगर करें।
नियमित कैलिब्रेशन समीक्षाएँ निर्धारित करें: भौतिक वातावरण स्थिर नहीं होते हैं। एक मौसमी खुदरा लेआउट परिवर्तन, एक नई विभाजन दीवार, या यहां तक कि एक बड़ी अस्थायी स्थापना (जैसे एक व्यापार शो स्टैंड) RF प्रसार को महत्वपूर्ण रूप से बदल सकती है। हर तिमाही में, या स्थल में किसी भी महत्वपूर्ण भौतिक परिवर्तन के तुरंत बाद एक कैलिब्रेशन समीक्षा निर्धारित करें।
डेटा न्यूनीकरण लागू करें: GDPR अनुच्छेद 5(1)(c) के तहत, बताए गए उद्देश्य के लिए केवल न्यूनतम आवश्यक डेटा एकत्र किया जाना चाहिए। ज़ोन-स्तरीय एनालिटिक्स के लिए, इसका मतलब व्यक्तिगत डिवाइस पथों के बजाय एकत्रित गणनाओं को संग्रहीत करना है। डेटा संग्रह के दायरे का विस्तार करने से पहले अपने डेटा संरक्षण अधिकारी से परामर्श करें।
IoT आर्किटेक्चर का लाभ उठाएँ: WiFi पोजिशनिंग व्यापक IoT परिनियोजन के साथ तेजी से एकीकृत हो रही है। यह समझने के लिए कि इनडोर पोजिशनिंग एक व्यापक कनेक्टेड वेन्यू आर्किटेक्चर में कैसे फिट होती है, Internet of Things Architecture: A Complete Guide पर हमारी मार्गदर्शिका देखें।
समस्या निवारण और जोखिम न्यूनीकरण
| विफलता मोड | लक्षण | मूल कारण | शमन |
|---|---|---|---|
| अपर्याप्त AP घनत्व | डिवाइस हीटमैप पर दूर के ज़ोन के बीच "कूदते" हैं | -65 dBm पर डिवाइस को सुनने वाले 3 से कम AP | सक्रिय साइट सर्वेक्षण; डेड ज़ोन में AP जोड़ें |
| गलत AP मैपिंग | हीटमैप भौतिक रूप से असंभव स्थानों में उच्च ठहराव दिखाता है | प्लेटफ़ॉर्म में AP निर्देशांक गलत तरीके से दर्ज किए गए | भौतिक स्थापना रिकॉर्ड के विरुद्ध प्रत्येक AP निर्देशांक को क्रॉस-चेक करें |
| MAC रैंडमाइजेशन | ज्ञात बार-बार आने वाले फ़ुटफ़ॉल के बावजूद लगभग शून्य लौटने वाले विज़िटर मेट्रिक्स | केवल निष्क्रिय ट्रैकिंग; कोई प्रमाणीकृत सत्र नहीं | प्रोत्साहित लॉगिन के साथ captive portal लागू करें |
| मल्टीपाथ हस्तक्षेप | विशिष्ट ज़ोन में अनिश्चित स्थान अनुमान | धातु के रैक या कांच से सिग्नल प्रतिबिंब | APs को फिर से स्थापित करें; दिशात्मक एंटेना का उपयोग करें; एनालिटिक्स प्लेटफ़ॉर्म में Kalman फ़िल्टरिंग लागू करें |
| चैनल भीड़भाड़ | 2.4 GHz पर असंगत RSSI रीडिंग | पड़ोसी नेटवर्क से सह-चैनल हस्तक्षेप | एनालिटिक्स क्लाइंट्स को 5 GHz पर माइग्रेट करें; WLC पर स्वचालित चैनल असाइनमेंट लागू करें |
ROI और व्यावसायिक प्रभाव
इनडोर WiFi पोजिशनिंग के लिए व्यावसायिक मामला सबसे मजबूत तब होता है जब इसे एक ऐसे बुनियादी ढाँचे के निवेश के रूप में प्रस्तुत किया जाता है जो एक साथ कई विभागों में रिटर्न देता है।
खुदरा: 20 स्टोर वाला एक मध्यम आकार का फैशन रिटेलर ज़ोन-स्तरीय ठहरने के समय के डेटा का उपयोग करके यह पहचान सकता है कि कौन से उत्पाद डिस्प्ले सबसे अधिक जुड़ाव उत्पन्न करते हैं। इस डेटा के आधार पर कम प्रदर्शन करने वाले फिक्स्चर को फिर से तैनात करने से तुलनीय परिनियोजन में बिक्री रूपांतरण दरों में 8-15% का सुधार दिखाया गया है। क्षेत्र-विशिष्ट मार्गदर्शन के लिए, हमारे Retail समाधान देखें।
आतिथ्य: 300 कमरों वाला एक होटल फ्रंट डेस्क और F&B आउटलेट पर वास्तविक समय की कतार की लंबाई की निगरानी कर सकता है, चरम अवधि के दौरान सेवा में गिरावट को रोकने के लिए कर्मचारियों को गतिशील रूप से भेज सकता है। संपत्ति के माध्यम से मेहमानों की आवाजाही को ट्रैक करने से हाउसकीपिंग अनुकूलन भी सक्षम होता है, जिससे कमरे के टर्नअराउंड समय में कमी आती है। परिनियोजन उदाहरणों के लिए हमारे Hospitality केस स्टडी देखें।
स्वास्थ्य सेवा: NHS ट्रस्ट और निजी अस्पताल मोबाइल संपत्तियों की खोज में लगने वाले औसत समय को प्रति घटना 20 मिनट से घटाकर 2 मिनट से कम करने के लिए WiFi-आधारित संपत्ति ट्रैकिंग (चिकित्सा उपकरणों पर WiFi-सक्षम टैग के माध्यम से) का उपयोग कर रहे हैं। यह गैर-नैदानिक कार्यों पर बर्बाद होने वाले नैदानिक कर्मचारियों के समय को सीधे कम करता है। हमारे Healthcare समाधानों का अन्वेषण करें।
परिवहन: हवाई अड्डे और रेल ऑपरेटर सुरक्षा और बोर्डिंग गेट के माध्यम से यात्री प्रवाह को प्रबंधित करने, भीड़भाड़ को कम करने और समय पर प्रस्थान दरों में सुधार के लिए उपस्थिति एनालिटिक्स का उपयोग करते हैं। प्रासंगिक केस स्टडी के लिए हमारा Transport सेक्टर पेज देखें।
ROI मापना: परिनियोजन से पहले प्रमुख मीट्रिक (ठहरने का समय, कतार की लंबाई, संपत्ति खोज समय) का एक आधारभूत माप स्थापित करें। परिनियोजन के 30, 60 और 90 दिनों के बाद फिर से मापें। एक अच्छी तरह से तैनात इनडोर पोजिशनिंग सिस्टम आमतौर पर भुगतान प्राप्त करता है12-18 महीनों के भीतर वापस आ जाता है जब पूर्ण परिचालन दक्षता लाभों को ध्यान में रखा जाता है।
इस पोजिशनिंग इंफ्रास्ट्रक्चर के ऊपर स्थित एनालिटिक्स क्षमताओं की व्यापक समझ के लिए, हमारी गाइड देखें: What Is WiFi Analytics? A Complete Guide ।
मुख्य शब्द और परिभाषाएं
RSSI (Received Signal Strength Indicator)
A measurement of the power level of a received radio signal, expressed in dBm (decibels relative to one milliwatt). Values typically range from -30 dBm (excellent) to -90 dBm (very weak).
IT teams use RSSI values reported by multiple APs to estimate a device's distance from each AP and calculate its location via trilateration. The -65 dBm threshold is the industry-standard minimum for reliable positioning.
Trilateration
A geometric method of determining the location of a point by measuring its distance from three or more known reference points, using the intersection of circles (in 2D) or spheres (in 3D).
This is the mathematical foundation of WiFi indoor positioning. It is distinct from triangulation, which uses angles rather than distances, though the terms are often used interchangeably in vendor documentation.
Probe Request
An 802.11 management frame broadcast by a WiFi-enabled device to discover available networks in its vicinity.
Probe requests are the fundamental data source for passive presence detection. They are transmitted even when the device is not connected to any network, as long as WiFi is enabled.
MAC Randomisation
A privacy feature in modern mobile operating systems (iOS 14+, Android 10+) that substitutes a randomly generated MAC address in probe request frames, preventing persistent tracking across sessions.
This is the primary technical barrier to passive individual tracking. IT teams must implement captive portal authentication to obtain a persistent identifier for returning visitor analytics.
Captive Portal
A web page presented to a user before network access is granted, typically requiring authentication or acceptance of terms and conditions.
The captive portal is the critical junction between anonymous presence detection and authenticated first-party analytics. It is also the primary mechanism for GDPR consent capture in guest WiFi deployments.
Dwell Time
The duration a detected device remains within a defined zone or the overall venue, measured from first detection to last detection within a session.
A primary KPI for retail and hospitality operators. High dwell time in a product zone correlates with purchase intent; low dwell time at a service desk may indicate poor service experience.
Multipath Interference
A propagation phenomenon where a radio signal reaches the receiving antenna via two or more paths due to reflections, diffractions, or scattering from obstacles.
Particularly prevalent in environments with metal racking, glass facades, or concrete columns. It causes RSSI readings to fluctuate independently of actual device distance, degrading location accuracy.
Path Loss Exponent
A parameter in the log-distance path loss model that describes how rapidly signal strength attenuates with distance in a given environment. Free space = 2; typical indoor = 3–4; obstructed indoor = 4–6.
Analytics platforms use a calibrated path loss exponent to convert RSSI values into distance estimates. An incorrectly calibrated exponent is a common source of systematic location error.
Zone Analytics
The aggregation of presence and dwell time data within a user-defined polygonal area on the venue floor plan.
Zones are the primary unit of business reporting in WiFi analytics platforms. They translate raw location coordinates into meaningful business areas (e.g., 'Checkout', 'Cafe', 'Exhibition Hall A').
केस स्टडीज
A 12-store fashion retail chain wants to understand how a new store layout affects customer dwell time in the 'Home & Living' section. They have a basic guest WiFi network but no analytics. The IT manager has a 90-day project window and a modest budget.
Step 1: Conduct an active site survey of the flagship store to identify AP coverage gaps. Upgrade AP density in the 'Home & Living' zone to guarantee 3-AP overlap at -65 dBm or better. Step 2: Integrate the wireless LAN controller with the WiFi Analytics platform via the management API. Step 3: Upload the store floor plan and precisely map all AP coordinates. Draw a 'Home & Living' zone polygon in the analytics dashboard. Step 4: Deploy a captive portal offering a 10% discount code in exchange for email registration and GDPR consent. This converts passive MAC-randomised data into authenticated dwell time metrics. Step 5: Run a 30-day baseline measurement before the layout change, then a 30-day post-change measurement. Compare average dwell time and footfall density in the zone between the two periods.
A conference centre hosting 5,000-delegate events is experiencing complaints about 20-minute queues at the main registration desk during the 08:30–09:30 peak window. The operations director wants a data-driven solution that can trigger real-time staff redeployment.
Step 1: Verify AP density around the registration desk is sufficient for accurate presence detection (minimum 3 APs at -65 dBm). Step 2: Define a 'Registration Desk' zone and a 'Registration Queue' zone (the area leading up to the desk) in the analytics platform. Step 3: Configure an automated alert: if the device count in the 'Registration Queue' zone exceeds 40 for more than 3 consecutive minutes, trigger an SMS and push notification to the floor manager's mobile device. Step 4: Establish a secondary alert threshold at 70 devices, triggering escalation to the venue operations director. Step 5: Review the alert logs weekly to refine the threshold values based on actual observed queue-to-complaint correlation.
परिदृश्य विश्लेषण
Q1. You are the network architect for a large department store. The initial heatmaps show devices frequently appearing in the wrong departments — a customer standing in Menswear is being placed in Womenswear on the map. What is the most likely cause and what is your diagnostic and remediation process?
💡 संकेत:Consider both the physical environment and the configuration of the analytics platform.
अनुशंसित दृष्टिकोण दिखाएं
There are two likely causes: (1) Incorrect AP coordinate mapping — the physical location of one or more APs has been entered incorrectly in the analytics platform, causing a systematic offset in all location estimates derived from those APs. Remediation: physically verify the location of every AP against its recorded coordinates in the platform and correct any discrepancies. (2) Insufficient AP density — if fewer than three APs are hearing the device at -65 dBm, the trilateration is working with incomplete data, producing inaccurate estimates. Remediation: conduct an active site survey to identify coverage gaps and add APs as required. Start with cause (1) as it is faster and cheaper to diagnose.
Q2. Your marketing team reports that the 'returning visitor' metric in the WiFi analytics dashboard has been at 0% for three months, despite strong anecdotal evidence from store managers that many customers visit multiple times per week. What is the technical explanation and what is the solution?
💡 संकेत:Consider the privacy features of modern mobile operating systems.
अनुशंसित दृष्टिकोण दिखाएं
The platform is relying solely on passive probe request tracking. Because modern iOS and Android devices randomise their MAC addresses with each probe session, every visit appears as a new, unique device. The system has no mechanism to link visits from the same physical device across sessions. The solution is to implement a captive portal that requires user authentication (email login, social login, or similar). Once a user authenticates, their session is tied to a persistent identifier (email address or user ID), enabling the platform to correctly identify and count returning visitors. Incentivising login — for example, with a loyalty discount — is recommended to maximise the authenticated session rate.
Q3. A new AP was installed to cover a previously dead zone in the venue's basement car park. The AP is confirmed online, serving clients, and appearing in the WLC dashboard. However, the analytics platform shows no presence data for the car park area. What step was missed and how do you resolve it?
💡 संकेत:The network layer and the analytics layer have separate configuration requirements.
अनुशंसित दृष्टिकोण दिखाएं
The AP mapping step was omitted from the analytics platform configuration. While the AP is fully functional at the network layer, its physical coordinates have not been registered in the analytics platform's floor plan. The platform is receiving the presence data from the AP but cannot place it on the map, so it is either being discarded or aggregated into an 'unmapped' category. Resolution: log into the analytics platform, navigate to the floor plan configuration, and add the new AP with its precise physical coordinates. If the car park is on a separate floor level, ensure the correct floor plan level is selected before placing the AP marker.
Q4. The legal team has raised a concern that the indoor positioning system may be processing personal data without adequate legal basis under GDPR. As the IT lead, how do you assess and address this risk?
💡 संकेत:Consider both passive and authenticated tracking modes separately.
अनुशंसित दृष्टिकोण दिखाएं
Assess the two tracking modes separately. For passive tracking (probe requests): MAC-randomised probe data is generally not considered personal data under GDPR when it cannot be linked to an identified individual. However, if the system retains raw MAC addresses for any period, this should be reviewed with your DPO, as a non-randomised MAC could be personal data. Implement data minimisation by aggregating to zone-level counts as quickly as possible and purging raw MAC logs. For authenticated tracking: this clearly involves personal data (email address, device association). The legal basis is typically consent, captured via the captive portal. Ensure the consent notice is specific, granular, and clearly describes the analytics use case. Implement a data retention policy and a subject access request process. Document both modes in your Records of Processing Activities (ROPA) under GDPR Article 30.
