
धीमी WiFi परफॉर्मेंस का निदान करने के लिए पैकेट कैप्चर (PCAP) का उपयोग करना
यह तकनीकी संदर्भ गाइड IT प्रबंधकों, नेटवर्क आर्किटेक्ट्स और वेन्यू ऑपरेशन्स निदेशकों को PCAP (पैकेट कैप्चर) विश्लेषण का उपयोग करके धीमी एंटरप्राइज WiFi परफॉर्मेंस का निदान और समाधान करने के लिए एक व्यवस्थित, पैकेट-स्तरीय कार्यप्रणाली प्रदान करती है। रीट्रांसमिशन दरों, एयरटाइम यूटिलाइजेशन और फिजिकल लेयर मेटाडेटा सहित रॉ 802.11 फ्रेम्स का विश्लेषण करके, टीमें वायर्ड या एप्लिकेशन समस्याओं से RF-लेयर की बाधाओं को सटीकता से अलग कर सकती हैं। होटल, रिटेल चेन, स्टेडियम और कॉन्फ्रेंस सेंटर्स सहित हाई-डेंसिटी वाले स्थानों पर लागू, यह गाइड नेटवर्क क्षमता को वापस पाने और गेस्ट एक्सपीरियंस को सुरक्षित रखने के लिए व्यावहारिक डायग्नोस्टिक वर्कफ़्लो, वास्तविक दुनिया के केस स्टडीज और कॉन्फ़िगरेशन सुधार के कदम प्रदान करती है।
Video overview
इस गाइड को सुनें
पॉडकास्ट ट्रांसक्रिप्ट देखें
हमारी मुख्य श्रृंखला का हिस्सा: गेस्ट WiFi गाइड →
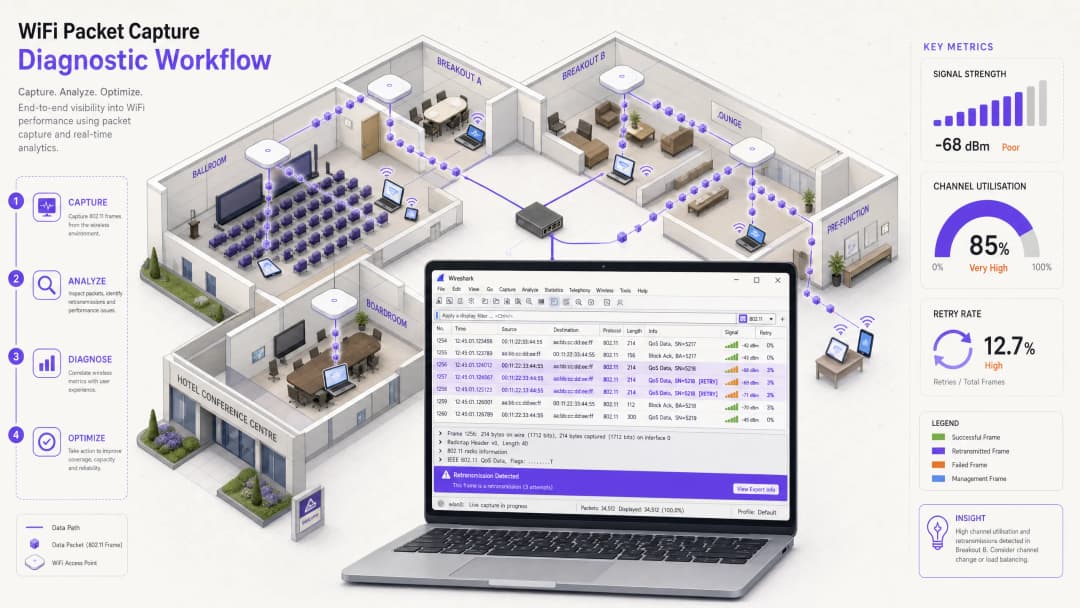
कार्यकारी सारांश
चीफ टेक्नोलॉजी ऑफिसर्स (CTOs), नेटवर्क आर्किटेक्ट्स और वेन्यू ऑपरेशंस डायरेक्टर्स के लिए, "धीमा WiFi" परिचालन दक्षता और मेहमानों की संतुष्टि के लिए एक लगातार बना रहने वाला खतरा है। हालांकि मानक नेटवर्क प्रबंधन डैशबोर्ड उच्च-स्तरीय स्वास्थ्य स्कोर प्रदान करते हैं, लेकिन वे अक्सर वायरलेस प्रदर्शन में गिरावट के मूल कारणों को छुपा देते हैं। होटल कॉन्फ्रेंस सेंटर, रिटेल मॉल और स्टेडियम जैसे उच्च-घनत्व वाले वातावरण में पुरानी प्रदर्शन समस्याओं का समाधान करने के लिए - IT टीमों को सतही मेट्रिक्स से आगे देखना होगा और सीधे वायरलेस फ्रेम का विश्लेषण करना होगा।
पैकेट कैप्चर (PCAP) विश्लेषण का लाभ उठाना सबसे निर्णायक और सटीक तरीका है, जो नेटवर्क इंजीनियरिंग टीमों को भौतिक और डेटा लिंक परतों पर क्लाइंट डिवाइस और एक्सेस पॉइंट के बीच संचार का गहन विश्लेषण करने की अनुमति देता है। यह तकनीकी संदर्भ गाइड 802.11 फ्रेम को कैप्चर और विश्लेषण करने के लिए एक संरचित, वेंडर-न्यूट्रल कार्यप्रणाली की रूपरेखा तैयार करती है। फ्रेम रीट्रांसमिशन दर, चैनल उपयोग और एयरटाइम भुखमरी जैसे महत्वपूर्ण संकेतकों पर ध्यान केंद्रित करके, नेटवर्क एडमिनिस्ट्रेटर वायर्ड बैकहॉल या एप्लीकेशन बाधाओं से वायरलेस भौतिक-परत की समस्याओं को अलग कर सकते हैं। इन नैदानिक कार्यप्रणालियों को लागू करके, और साथ ही Guest WiFi और WiFi Analytics जैसे एंटरप्राइज-ग्रेड समाधानों का उपयोग करके, एक परेशानी भरे नेटवर्क उपयोगिता को एक उच्च-प्रदर्शन और उच्च-ROI वाले व्यावसायिक एसेट में बदला जा सकता है।
Technical Deep-Dive
802.11 Medium and the Necessity of Monitor Mode
वायरलेस प्रदर्शन का सटीक निदान करने के लिए, नेटवर्क आर्किटेक्ट्स को यह समझना होगा कि वायरलेस माध्यम मूल रूप से एक स्विच किए गए वायर्ड नेटवर्क से अलग है। वायरलेस एक साझा, हाफ-डुप्लेक्स माध्यम है जहां किसी भी विशिष्ट मिलीसेकंड पर केवल एक ही डिवाइस एक चैनल पर ट्रांसमिट कर सकता है। इसके अलावा, मानक वायरलेस नेटवर्क इंटरफ़ेस कार्ड (NICs) "मैनेज्ड" या "स्टेशन" मोड में काम करते हैं, जिसका अर्थ है कि वे किसी भी ऐसे फ़्रेम को छोड़ देते हैं जो विशेष रूप से उनके अपने MAC पते पर निर्देशित नहीं होता है। वायरलेस संचार की पूरी तस्वीर को कैप्चर करने के लिए, कैप्चरिंग स्टेशन को Monitor Mode में कॉन्फ़िगर किए गए एडेप्टर का उपयोग करना चाहिए।
Monitor Mode बनाम Promiscuous Mode: हालांकि वायर्ड नेटवर्क में प्रोमिसकुअस मोड NIC को स्थानीय ब्रॉडकास्ट डोमेन पर सभी पैकेट कैप्चर करने की अनुमति देता है, लेकिन यह वायरलेस फ़्रेम हेडर के लिए काम नहीं करता है। Monitor mode एक वायरलेस एडेप्टर को किसी विशेष चैनल पर हवा में सभी 802.11 फ़्रेमों को निष्क्रिय रूप से सूंघने (sniff) की अनुमति देता है, जिससे AP के साथ जुड़े बिना प्रबंधन और नियंत्रण फ़्रेमों के साथ-साथ डेटा पेलोड को कैप्चर करना सक्षम हो जाता है।
802.11 Frame Structure and the Radiotap Header
Monitor mode में कैप्चर किए गए प्रत्येक वायरलेस पैकेट के पहले कैप्चरिंग ड्राइवर द्वारा एक Radiotap Header जोड़ा जाता है। यह हेडर हवा में यात्रा नहीं करता है - इसके बजाय, यह स्निफिंग रेडियो NIC द्वारा कैप्चर किए गए महत्वपूर्ण फिजिकल-लेयर मेटाडेटा प्रदान करता है। मुख्य फिजिकल-लेयर मेट्रिक्स में चैनल और फ्रीक्वेंसी (यह सत्यापित करना कि कैप्चर इच्छित चैनल पर लिया गया था), dBm (RSSI) में सिग्नल की ताकत, और वह डेटा दर जिस पर विशिष्ट फ़्रेम ट्रांसमिट किया गया था, शामिल हैं।
Radiotap हेडर के नीचे 802.11 MAC हेडर होता है, जो फ़्रेमों को तीन प्राथमिक प्रकारों में वर्गीकृत करता है:
| फ़्रेम प्रकार | प्राथमिक उपप्रकार | प्रदर्शन निदान में भूमिका |
|---|---|---|
| मैनेजमेंट | Beacon, Probe Request/Response, Association, Deauthentication | उच्च मात्रा कवरेज अंतराल, आक्रामक रोमिंग, या लीगेसी क्लाइंट ओवरहेड को इंगित करती है। |
| कंट्रोल | ACK, Block ACK, RTS, CTS | रिट्रांसमिशन (ACK की कमी) टकराव या हस्तक्षेप को इंगित करते हैं। RTS/CTS छिपे हुए नोड्स का निदान करता है। |
| डेटा | QoS Data, Null Function | कम-दर वाले डेटा फ़्रेमों का उच्च अनुपात एयरटाइम भुखमरी को इंगित करता है। |
Frame Retransmissions and Airtime Starvation
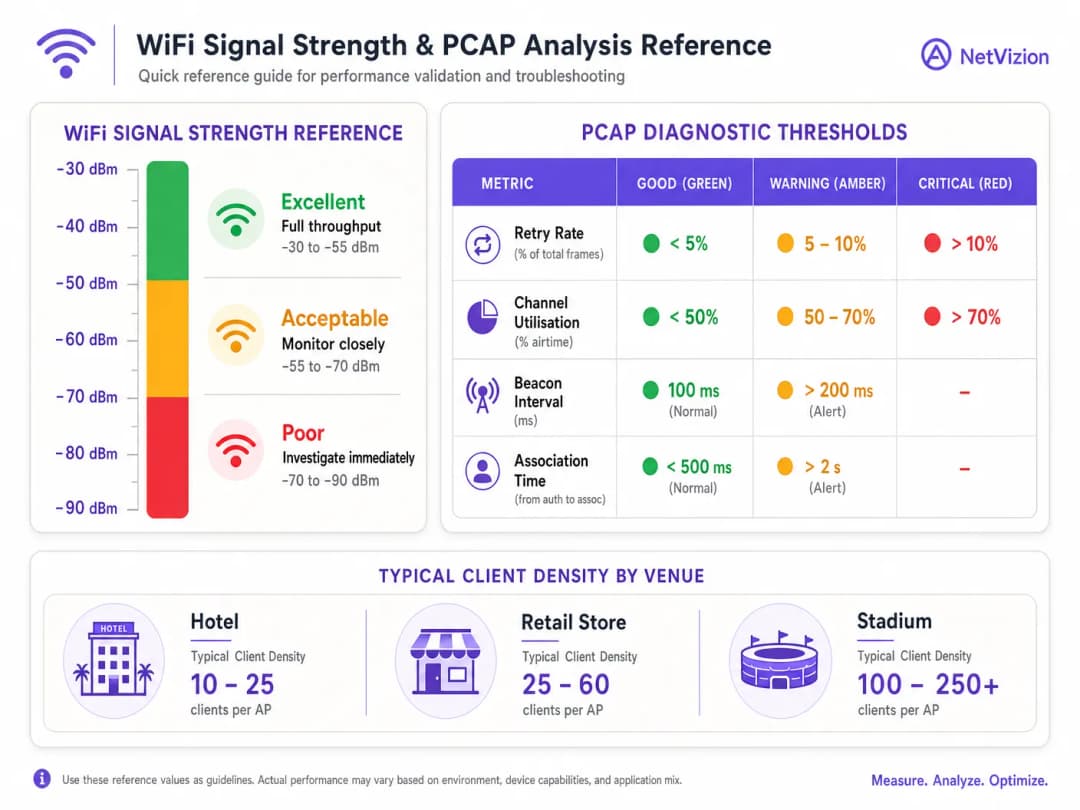
चूंकि 802.11 में ट्रांसमिशन के दौरान टकराव का पता लगाने (collision detection) की सुविधा नहीं होती है, इसलिए यह सकारात्मक पावती (positive acknowledgement) पर निर्भर करता है। प्रत्येक यूनिकास्ट फ़्रेम को प्राप्तकर्ता रेडियो द्वारा एक नियंत्रण ACK फ़्रेम के साथ स्वीकार किया जाना चाहिए। यदि प्रेषक को एक विशिष्ट टाइमआउट विंडो के भीतर ACK प्राप्त नहीं होता है, तो यह अपने पुनः प्रयास काउंटर को बढ़ाता है और फ़्रेम को फिर से ट्रांसमिट करता है। एक स्वस्थ एंटरप्राइज परिनियोजन में, 802.11 Retry Rate 5% से नीचे रहनी चाहिए। 10% से अधिक की पुनः प्रयास दर थ्रूपुट और लेटेंसी में लगातार गिरावट का कारण बनती है।
Airtime starvation तब होता है जब कमजोर सिग्नल स्ट्रेंथ या लेगेसी क्षमताओं वाले क्लाइंट डिवाइस कम दरों पर डेटा ट्रांसमिट करते हैं, जैसे कि 1 Mbps या 6 Mbps। क्योंकि इन कम दर वाले फ्रेम्स को उच्च दर वाले 802.11ac/ax फ्रेम्स की तुलना में ट्रांसमिट होने में काफी अधिक समय लगता है, इसलिए एक अकेला दूर का क्लाइंट उपलब्ध airtime का एक बहुत बड़ा हिस्सा खपत कर सकता है, जिससे आस-पास के हाई-स्पीड क्लाइंट्स को मीडियम नहीं मिल पाता है। यह Hospitality और Retail वातावरण में धीमे WiFi का सबसे आम और गलत निदान किए जाने वाले कारणों में से एक है।
इम्प्लीमेंटेशन गाइड
स्टेप-बाय-स्टेप वायरलेस पैकेट कैप्चर वर्कफ़्लो
PCAP का उपयोग करके धीमे WiFi प्रदर्शन का स्वतंत्र रूप से विश्लेषण और निदान करने के लिए, नेटवर्क इंजीनियरिंग टीमों को इस संरचित पांच-चरणीय नैदानिक वर्कफ़्लो का पालन करना चाहिए।
 स्टेप 1: कैप्चर सेटअप और चैनल लॉकिंग। एक समर्पित बाहरी USB वायरलेस एडॉप्टर का उपयोग करें जो मॉनिटर मोड का समर्थन करता हो। साइट सर्वे टूल या AP कंट्रोलर डैशबोर्ड का उपयोग करके खराब प्रदर्शन करने वाले AP के चैनल की पहचान करें। स्निफिंग एडॉप्टर को मॉनिटर मोड पर कॉन्फ़िगर करें और इसे उस विशिष्ट चैनल और चैनल की चौड़ाई पर लॉक करें। कैप्चर करने वाले लैपटॉप को प्रभावित क्लाइंट डिवाइस के करीब रखें ताकि यह सुनिश्चित हो सके कि स्निफर को समान RF वातावरण मिले।
स्टेप 2: फिजिकल-लेयर हेल्थ की पुष्टि करें। उच्च-लेयर प्रोटोकॉल का विश्लेषण करने से पहले, Radiotap हेडर के भीतर फिजिकल-लेयर विशेषताओं की पुष्टि करें। सुनिश्चित करें कि क्लाइंट का RSSI कम से कम -67 dBm हो और नॉइज़ फ्लोर -95 dBm से नीचे हो, जो हाई-डेंसिटी वॉयस और डेटा का समर्थन करने के लिए 28 dB या उससे अधिक का SNR प्रदान करता है। जांचें कि क्या क्लाइंट कम MCS (Modulation and Coding Scheme) इंडेक्स पर ट्रांसमिट कर रहा है; यदि फ्रेम्स लगातार MCS 2 से नीचे भेजे जा रहे हैं, तो क्लाइंट खराब सिग्नल गुणवत्ता या फिजिकल बाधाओं से पीड़ित है।
स्टेप 3: 802.11 फ्रेम्स को फ़िल्टर और विश्लेषण करें। Wireshark में PCAP खोलें और समस्या को वर्गीकृत करने के लिए विशिष्ट डिस्प्ले फ़िल्टर लागू करें। किसी विशिष्ट क्लाइंट MAC एड्रेस को अलग करने के लिए, wlan.addr == [Client_MAC] का उपयोग करें। रीट्रांसमिशन को फ़िल्टर करने के लिए, wlan.fc.retry == 1 का उपयोग करें। मैनेजमेंट फ्रेम ओवरहेड की निगरानी के लिए, wlan.fc.type == 0 का उपयोग करें। चैनल उपयोग का निरीक्षण करने के लिए, Statistics > I/O Graph पर जाएं और प्रति सेकंड रीट्राई पैकेट्स के मुकाबले प्रति सेकंड कुल पैकेट्स को प्लॉट करें।चरण 4: मूल कारण की पहचान करें। स्थापित प्रदर्शन सीमाओं के विरुद्ध फ़िल्टर किए गए डेटा का विश्लेषण करें। अच्छी सिग्नल शक्ति के बावजूद 10% से अधिक की उच्च पुनः प्रयास दर एक Hidden Node समस्या या गैर-WiFi हस्तक्षेप के कारण होने वाले फ़्रेम टकराव को दर्शाती है। उच्च एयरटाइम खपत के साथ कम डेटा दरें लीगेसी क्लाइंट्स या दूर के उपकरणों के कारण होने वाली Airtime Starvation को दर्शाती हैं। अत्यधिक जांच अनुरोध और प्रतिक्रियाएं "sticky client" व्यवहार या खराब AP कवरेज सीमाओं को दर्शाती हैं।
चरण 5: समाधान लागू करें और पुनः परीक्षण करें। पहचाने गए मूल कारण के आधार पर, उपयुक्त कॉन्फ़िगरेशन परिवर्तन लागू करें। लीगेसी डेटा दरों (1, 2, 5.5, 11 Mbps) को अक्षम करें और न्यूनतम बुनियादी दर को 12 Mbps या 24 Mbps पर सेट करें। छिपे हुए नोड (hidden node) की समस्याओं के लिए, AP पर RTS/CTS सीमा को कॉन्फ़िगर करें। सह-चैनल (co-channel) हस्तक्षेप को कम करने के लिए AP ट्रांसमिट पावर को समायोजित करें। यह सत्यापित करने के लिए कि पुनः प्रयास दर 5% से नीचे आ गई है और औसत डेटा दरें बढ़ गई हैं, एक फॉलो-अप PCAP चलाएं। प्रमाणीकरण और एक्सेस नियंत्रण पर विस्तृत गाइड के लिए, How to Implement 802.1X Authentication with Cloud RADIUS देखें।
अपने विशिष्ट सेटअप को लेकर कोई सवाल हैं?
हमारी टीम 80,000 से अधिक वेन्यू में वेन्यू ऑपरेटरों, IT मैनेजरों और नेटवर्क इंजीनियरों के साथ काम करती है। 20 मिनट का कॉल बुक करें और हम आपको दिखाएंगे कि आपके जैसे अन्य लोगों ने इसे कैसे हल किया।
सर्वोत्तम प्रथाएं
एंटरप्राइज नेटवर्क का निदान करते समय, समाधान आर्किटेक्ट्स को सटीक निदान और दीर्घकालिक स्थिरता सुनिश्चित करने के लिए उद्योग-मानक, वेंडर-तटस्थ सर्वोत्तम प्रथाओं का पालन करना चाहिए।
इंटेलिजेंट और ट्रिगर किए गए कैप्चर का लाभ उठाएं। सैकड़ों APs में लगातार, पूर्ण-पैकेट कैप्चर के लिए अत्यधिक मात्रा में स्टोरेज की आवश्यकता होती है। इसके बजाय, आधुनिक नेटवर्क प्रबंधन प्लेटफार्मों का लाभ उठाएं जो ट्रिगर किए गए PCAPs का समर्थन करते हैं। जब कोई क्लाइंट एसोसिएशन विफलता, उच्च DHCP विलंबता, या अत्यधिक 802.11 पुनः प्रयासों का अनुभव करता है, तो Cisco Catalyst Center या Aruba Central जैसे प्लेटफॉर्म स्वचालित रूप से एक रोलिंग-बफर PCAP को ट्रिगर कर सकते हैं। यह दृष्टिकोण Healthcare और Transport वातावरण के लिए अत्यधिक प्रासंगिक है जहां नेटवर्क विश्वसनीयता मिशन-महत्वपूर्ण है।
वायरलेस बनाम वायर्ड प्रदर्शन बाधाओं को अलग करें। हमेशा सत्यापित करें कि "धीमी WiFi" की शिकायत वास्तव में एक वायरलेस समस्या है या नहीं। अपने PCAP में 802.11 पुनः प्रयास दर के साथ HTTP प्रतिक्रिया समय या TCP राउंड-ट्रिप समय (RTT) की तुलना करें। यदि TCP RTT उच्च है लेकिन 802.11 पुनः प्रयास दर कम (3% से नीचे) है, तो बाधा वायर्ड नेटवर्क, DHCP सर्वर, DNS रिज़ॉल्यूशन या WAN गेटवे में है। यदि 802.11 पुनः प्रयास दर उच्च (10% से ऊपर) है, तो समस्या पूरी तरह से वायरलेस RF डोमेन के भीतर है।कैप्चर के दौरान अनुपालन और सुरक्षा बनाए रखें। सार्वजनिक स्थानों या कॉर्पोरेट वातावरण में रॉ वायरलेस पैकेट कैप्चर करने से संवेदनशील उपयोगकर्ता डेटा उजागर हो सकता है, जिससे GDPR जैसे गोपनीयता नियमों या PCI DSS जैसे सुरक्षा मानकों का उल्लंघन हो सकता है। WPA3 या WPA2 Enterprise का उपयोग करने वाले सुरक्षित वातावरण में, डेटा पेलोड हवा में एन्क्रिप्टेड होते हैं, जो उपयोगकर्ता की गोपनीयता की रक्षा करते हुए भौतिक और MAC-layer समस्या निवारण के लिए पर्याप्त है। प्रदर्शन समस्या निवारण के लिए कैप्चर करते समय, केवल Radiotap, 802.11, और IP हेडर को सुरक्षित रखने और वास्तविक उपयोगकर्ता डेटा को बाहर रखने के लिए tcpdump -s 128 का उपयोग करके पेलोड को पहले 128 बाइट्स तक ट्रंकेट करने के लिए अपने कैप्चर टूल को कॉन्फ़िगर करें।
विक्रेता मार्गदर्शन और मानकों का संदर्भ लें। एंटरप्राइज़ डिप्लॉयमेंट के लिए, अपनी PCAP कार्यप्रणाली को IEEE 802.11 मानकों और विक्रेता-विशिष्ट मार्गदर्शन के साथ संरेखित करें। Cisco-आधारित वातावरण के लिए, प्लेटफॉर्म-विशिष्ट कैप्चर प्रक्रियाओं के लिए Cisco Wireless APs: 2026 Guide to Products & Deployment देखें। एक्सेस कंट्रोल और ऑथेंटिकेशन डायग्नोस्टिक्स के लिए, 10 Best Network Access Control (NAC) Solutions for 2026 व्यापक सुरक्षा प्रबंधन के साथ PCAP निष्कर्षों को एकीकृत करने के लिए संदर्भ प्रदान करता है।
समस्या निवारण और समाधान
नीचे दी गई तालिका PCAP के माध्यम से पहचाने गए सामान्य वायरलेस विफलता मोड, उनके पैकेट-स्तरीय संकेतक और अनुशंसित समाधान चरणों की रूपरेखा तैयार करती है:
| विफलता मोड | PCAP संकेतक | मूल कारण | समाधान के चरण |
|---|---|---|---|
| हिडन नोड समस्या | उच्च RSSI के बावजूद डेटा फ्रेम पर उच्च पुनः प्रयास दर। | दो क्लाइंट AP के साथ संचार कर सकते हैं लेकिन दूरी या बाधाओं के कारण एक-दूसरे से छिपे हुए हैं, जिससे एक साथ प्रसारण होता है। | AP पर RTS/CTS सीमाएं सक्षम करें; भौतिक बाधाओं को दूर करने के लिए APs को पुनः स्थापित करें। |
| को-चैनल हस्तक्षेप | एक ही चैनल पर कई BSSIDs से बीकन की उच्च मात्रा के कारण चैनल का उपयोग >70%। | एक ही चैनल पर बहुत अधिक APs या अत्यधिक व्यापक चैनल चौड़ाई। | एक व्यवस्थित चैनल योजना लागू करें; चैनल की चौड़ाई को 20 या 40 MHz तक कम करें; AP ट्रांसमिट पावर को समायोजित करें। |
| स्टीकी क्लाइंट व्यवहार | एक मजबूत सिग्नल प्रदान करने वाले AP के करीब होने के बावजूद क्लाइंट एक दूर के AP (कम RSSI, कम डेटा दर) से जुड़ा रहता है। | क्लाइंट रोमिंग एल्गोरिदम निष्क्रिय है; AP ट्रांसमिट पावर बहुत अधिक है। | AP ट्रांसमिट पावर को समायोजित करें; न्यूनतम बुनियादी डेटा दरों को 12 या 24 Mbps पर सेट करें; 802.11v/k/r रोमिंग लागू करें। |
| DHCP / DNS विलंबता | EAPOL हैंडशेक तेजी से पूरा होता है, लेकिन बाद के DHCP या DNS फ्रेम में कई सेकंड की देरी प्रदर्शित होती है। | वायरलेस लिंक बेहतर ढंग से काम कर रहा है, लेकिन अपस्ट्रीम वायर्ड नेटवर्क सेवाएं बाधित हैं। | वायर्ड इंफ्रास्ट्रक्चर का समस्या निवारण करें; DHCP लीज समय और पूल आकार सत्यापित करें; क्लाउड-प्रबंधित ऑथेंटिकेशन लागू करें। |
ROI और व्यावसायिक प्रभाव
सटीक PCAP डायग्नोस्टिक्स के माध्यम से एंटरप्राइज WiFi प्रदर्शन को सुव्यवस्थित करने से सीधे, मापने योग्य व्यावसायिक लाभ मिलते हैं। रिटेल चेन, होटल और सार्वजनिक स्थानों जैसे अत्यधिक ट्रैफ़िक वाले स्थानों में, नेटवर्क अपटाइम और प्रदर्शन सीधे ग्राहक संतुष्टि और व्यावसायिक राजस्व से जुड़े होते हैं।
एयरटाइम बर्बाद करने वाले लीगेसी डिवाइस और को-चैनल व्यवधान की पहचान करने और उन्हें खत्म करने के लिए PCAP का उपयोग करके, नेटवर्क टीमें अपनी मौजूदा वायरलेस क्षमता का 40% तक पुनः प्राप्त कर सकती हैं। यह ऑप्टिमाइज़ेशन महंगे हार्डवेयर रिप्लेसमेंट चक्रों को टाल देता है, जिससे स्थान अतिरिक्त AP खरीदे बिना या स्विच इन्फ्रास्ट्रक्चर को अपग्रेड किए बिना उच्च क्लाइंट डेंसिटी का समर्थन कर सकते हैं। बड़े पैमाने के इंस्टॉलेशन में, केवल अनुमान लगाने के बजाय एक व्यवस्थित PCAP डायग्नोस्टिक कार्यप्रणाली को अपनाने से मीन टाइम टू रेजोल्यूशन (MTTR) 60% तक कम हो जाता है। इंजीनियर्स तेजी से यह पता लगा सकते हैं कि कोई धीमा एप्लिकेशन RF व्यवधान, क्लाइंट-साइड ड्राइवर समस्याओं या वायर्ड नेटवर्क में बाधाओं के कारण है या नहीं।
हॉस्पिटैलिटी और रिटेल ऑपरेटरों के लिए, विश्वसनीय WiFi ग्राहक जुड़ाव की नींव है। एक ऑप्टिमाइज़्ड वायरलेस नेटवर्क को Purple के Guest WiFi और WiFi Analytics प्लेटफॉर्म के साथ एकीकृत करने से व्यवसाय सटीक, फर्स्ट-पार्टी ग्राहक डेटा कैप्चर करने, लक्षित मार्केटिंग अभियान चलाने और ब्रांड निष्ठा बढ़ाने में सक्षम होते हैं। Retail और Hospitality जैसे उद्योगों में, यह डेटा संग्रह इंजन उस चीज़ को बदल देता है जो पारंपरिक रूप से एक लागत केंद्र (WiFi इन्फ्रास्ट्रक्चर) है, उसे एक शक्तिशाली राजस्व-उत्पादक प्लेटफॉर्म में बदल देता है। शैक्षणिक संस्थानों के लिए, WiFi in Schools: The 2026 Administrator & IT Guide इन डायग्नोस्टिक सिद्धांतों को उच्च-डेंसिटी, मल्टी-डिवाइस परिवेशों में लागू करने पर अतिरिक्त संदर्भ प्रदान करता है।
संदर्भ
[1] Cisco Meraki: Analyzing Wireless Packet Captures [2] VIAVI Solutions: What is Packet Capture? [3] QA Cafe: Troubleshooting Slow Apps with Packet Captures [4] Purple Guide: How to Fix Slow WiFi Without Upgrading Your Internet Plan [5] Purple Guide: The Ultimate Guide to WiFi Channel Selection
मुख्य परिभाषाएं
Monitor Mode
एक विशेष वायरलेस कार्ड स्थिति जो एक एडेप्टर को किसी एक्सेस पॉइंट के साथ संबद्ध किए बिना, प्रबंधन, नियंत्रण और डेटा फ़्रेम सहित एक विशिष्ट चैनल पर हवा में सभी 802.11 फ़्रेमों को निष्क्रिय रूप से सूँघने (sniff) की अनुमति देती है।
कच्ची वायरलेस PCAP फ़ाइलों को कैप्चर करने के लिए आवश्यक है। मानक 'मैनेज्ड' मोड होस्ट डिवाइस को संबोधित नहीं किए गए फ़्रेम को खारिज कर देता है, जिससे यह वायरलेस डायग्नोस्टिक्स के लिए अनुपयुक्त हो जाता है।
Radiotap Header
कैप्चरिंग ड्राइवर द्वारा कैप्चर किए गए 802.11 फ़्रेमों से पहले जोड़ा गया एक मानकीकृत हेडर, जिसमें भौतिक-परत मेटाडेटा जैसे सिग्नल शक्ति (RSSI), चैनल फ्रीक्वेंसी और ट्रांसमिशन डेटा दर शामिल होती है।
Wireshark में भौतिक RF वातावरण का विश्लेषण करने के लिए उपयोग किया जाता है, ठीक उसी मिलीसेकंड पर जब कोई फ़्रेम कैप्चर किया गया था। सिग्नल की गुणवत्ता और डेटा दर विश्लेषण के लिए जमीनी सच्चाई प्रदान करता है।
Retry Rate
सकल ट्रांसमिट किए गए 802.11 फ़्रेमों का प्रतिशत जिनके MAC हेडर में 'Retry' बिट सेट है, जो यह दर्शाता है कि वे प्राप्त होने वाले पावती (ACK) फ़्रेम की कमी के कारण रीट्रांसमिशन हैं।
वायरलेस स्वास्थ्य के लिए एक प्रमुख मीट्रिक। 10% से अधिक की दरें गंभीर हस्तक्षेप, टकराव या छिपे हुए नोड की समस्याओं का संकेत देती हैं जो सभी जुड़े हुए क्लाइंट्स के लिए थ्रूपुट और लेटेंसी को कम कर देंगी।
Airtime Starvation
ऐसी स्थिति जहाँ कम डेटा दरों (जैसे, 1 या 6 Mbps) पर ट्रांसमिट करने वाले पुराने या दूर के क्लाइंट डिवाइस उपलब्ध वायरलेस एयरटाइम का एक बड़ा हिस्सा खा जाते हैं, जिससे हाई-स्पीड क्लाइंट्स के पास अपर्याप्त क्षमता बचती है।
कम डेटा दरों और उच्च चैनल उपयोग के लिए फ़िल्टर करके PCAP में निदान किया गया। विरासत (legacy) दरों को अक्षम करके और 12 या 24 Mbps की न्यूनतम बुनियादी दर निर्धारित करके हल किया गया।
Hidden Node Problem
एक RF कोलिशन परिदृश्य जहाँ दो वायरलेस क्लाइंट डिवाइस एक ही AP के साथ संचार कर सकते हैं लेकिन एक-दूसरे को सुन नहीं सकते, जिससे एक साथ ट्रांसमिशन होते हैं जो AP पर टकराते हैं।
बेहतरीन सिग्नल स्ट्रेंथ के बावजूद उच्च रिट्राई रेट द्वारा इसका पता लगाया जाता है। यह धातु की अलमारियों वाले रिटेल स्थानों या कंक्रीट की दीवारों वाले गोदामों में आम है। RTS/CTS थ्रेशोल्ड को सक्षम करके इसे ठीक किया जाता है।
Beacon Frame
एक 802.11 मैनेजमेंट फ्रेम जिसे एक AP द्वारा आसपास के क्लाइंट्स को अपनी उपस्थिति, SSID, समर्थित डेटा रेट और क्षमताओं का विज्ञापन करने के लिए समय-समय पर (आमतौर पर हर 100ms में) ब्रॉडकास्ट किया जाता है।
हाई-डेंसिटी डिप्लॉयमेंट में, एक ही चैनल पर बड़ी संख्या में AP होने से Beacon ओवरहेड उपलब्ध एयरटाइम का 50% तक खर्च कर सकता है, विशेष रूप से तब जब इसे कम बेसिक रेट पर ट्रांसमिट किया जाता है।
RTS/CTS (Request to Send / Clear to Send)
वायरलेस माध्यम तक पहुँच को समन्वित करने के लिए उपयोग किया जाने वाला एक हैंडशेक मैकेनिज्म, जहाँ एक क्लाइंट डेटा ट्रांसमिट करने से पहले एक RTS फ्रेम भेजता है, और AP सभी नजदीकी उपकरणों के लिए चैनल आरक्षित करने के लिए एक CTS फ्रेम के साथ जवाब देता है।
रिटेल स्टोर और गोदामों जैसे हाई-डेंसिटी या भौतिक रूप से बाधित वातावरण में हिडन नोड समस्या के कारण होने वाले कोलिशन को कम करने के लिए उपयोग किया जाता है।
Channel Utilisation
समय का वह प्रतिशत जब वायरलेस माध्यम व्यस्त रहता है, चाहे वह डिकोड करने योग्य 802.11 ट्रांसमिशन के कारण हो या नॉन-WiFi फिजिकल लेयर नॉइज़ के कारण।
70% से अधिक Utilisation के परिणामस्वरूप आमतौर पर सभी जुड़े हुए क्लाइंट्स के लिए गंभीर लेटेंसी और थ्रूपुट में गिरावट आती है। इसे Wireshark में Statistics > I/O Graph के माध्यम से मापा जाता है।
EAPOL (Extensible Authentication Protocol over LAN)
802.1X ऑथेंटिकेशन प्रक्रिया के दौरान वायरलेस क्लाइंट और ऑथेंटिकेटर (AP) के बीच EAP ऑथेंटिकेशन संदेशों को स्थानांतरित करने के लिए उपयोग किया जाने वाला प्रोटोकॉल।
एक PCAP में दिखाई देने वाले EAPOL एक्सचेंज में देरी RADIUS ऑथेंटिकेशन सर्वर में रुकावटों का संकेत देती है, जिसे उपयोगकर्ता अक्सर 'धीमा WiFi' समझ लेते हैं जबकि वायरलेस लिंक स्वयं स्वस्थ होता है।
हल किए गए उदाहरण
एक 200 कमरों वाला लक्जरी होटल अपने मुख्य बॉलरूम में एक टेक कॉन्फ्रेंस की मेजबानी कर रहा है। मुख्य सत्र के दौरान, 150 से अधिक मेहमान रिपोर्ट करते हैं कि वे गेस्ट WiFi से कनेक्ट तो हो सकते हैं लेकिन वेब पेज लोड नहीं कर पा रहे हैं, और बेहद धीमी परफॉर्मेंस का अनुभव कर रहे हैं। मानक डैशबोर्ड दिखाते हैं कि चैनल 36 पर 5 GHz चैनल यूटिलाइजेशन 82% पर है, लेकिन एक्टिव डेटा थ्रूपुट बहुत कम है। ऑन-साइट IT टीम को मूल कारण की पहचान करने और तत्काल समाधान लागू करने की आवश्यकता है।
नेटवर्क आर्किटेक्ट मॉनिटर-मोड एडॉप्टर का उपयोग करके चैनल 36 पर एक वायरलेस पैकेट कैप्चर शुरू करता है।
स्टेप 1 - PCAP विश्लेषण: कैप्चर से पता चलता है कि कुल एयरटाइम का 45% मैनेजमेंट फ्रेम्स द्वारा उपभोग किया जा रहा है। विशेष रूप से, होटल के अपने APs से बीकन फ्रेम्स 1 Mbps की न्यूनतम बेसिक दर पर प्रसारित किए जा रहे हैं, और भीड़ में मौजूद सैकड़ों पैसिव क्लाइंट डिवाइसों से प्रोब रिक्वेस्ट और प्रोब रिस्पॉन्स की भारी बाढ़ आ रही है।
स्टेप 2 - फिजिकल लेयर निरीक्षण: Radiotap हेडर की जांच से पता चलता है कि कई पुराने 802.11b/g डिवाइस 2 Mbps पर QoS डेटा फ्रेम्स प्रसारित कर रहे हैं, जो लंबे समय तक माध्यम पर कब्जा कर रहे हैं और नए 802.11ac/ax क्लाइंट्स के लिए एयरटाइम की कमी का कारण बन रहे हैं।
स्टेप 3 - समाधान: वायरलेस कंट्रोलर में, आर्किटेक्ट लीगेसी डेटा दरों (1, 2, 5.5, 11 Mbps) को निष्क्रिय कर देता है और न्यूनतम बेसिक दर को 12 Mbps पर सेट करता है। यह APs को 12 गुना तेजी से बीकन प्रसारित करने के लिए मजबूर करता है, जिससे चैनल का 30% से अधिक एयरटाइम तुरंत वापस मिल जाता है। यह खराब सिग्नल वाले दूर के क्लाइंट्स को कनेक्ट होने से भी रोकता है, जिससे उन्हें नजदीकी APs पर रोमिंग करने के लिए प्रोत्साहन मिलता है। इसके अतिरिक्त, आर्किटेक्ट 2.4 GHz ट्रांसमिट पावर को घटाकर 6 dBm कर देता है और ड्यूल-बैंड क्लाइंट्स को क्लीनर 5 GHz बैंड पर भेजने के लिए बैंड स्टीयरिंग को सक्षम करता है।
स्टेप 4 - सत्यापन: समाधान के बाद का एक PCAP पुष्टि करता है कि चैनल यूटिलाइजेशन गिरकर 38% हो जाता है, रीट्राई दरें 4% से नीचे आ जाती हैं, और गेस्ट वेब पेज तुरंत लोड होने लगते हैं।
एक राष्ट्रीय रिटेल चेन रिपोर्ट करती है कि चेकआउट लेन में वायरलेस पॉइंट-ऑफ-सेल (POS) टर्मिनल व्यस्त खरीदारी के घंटों के दौरान रुक-रुक कर कनेक्शन टूटने और धीमी ट्रांजैक्शन प्रोसेसिंग का सामना करते हैं। स्टोर POS टर्मिनलों के लिए 2.4 GHz पर चैनल 11 का उपयोग करते हैं। एक स्थानीय साइट सर्वे टिल पर -52 dBm की उत्कृष्ट सिग्नल स्ट्रेंथ दिखाता है, लेकिन ट्रांजैक्शन में देरी बनी रहती है। नेटवर्क टीम पर आगामी पीक ट्रेडिंग अवधि से पहले इसे हल करने का दबाव है।
एक समाधान आर्किटेक्ट पीक आवर्स के दौरान एक लक्षित PCAP निष्पादित करता है।
चरण 1 - क्लाइंट MAC द्वारा फ़िल्टर करें: आर्किटेक्ट wlan.addr == [POS_MAC] का उपयोग करके विफल हो रहे POS टर्मिनल के MAC एड्रेस के लिए कैप्चर को फ़िल्टर करता है।
चरण 2 - मुख्य निष्कर्ष: -52 dBm की उत्कृष्ट सिग्नल शक्ति के बावजूद, POS टर्मिनल के लिए 802.11 रीट्राय दर 24% पर पहुंच जाती है। PCAP से पता चलता है कि संबंधित कंट्रोल ACK फ़्रेम प्राप्त किए बिना बड़ी मात्रा में डेटा फ़्रेम भेजे गए, जिससे तत्काल पुनरूर्षण (retransmission) हुआ। चैनल 11 पर कोई अन्य सक्रिय SSID नहीं है, जिससे मानक सह-चैनल हस्तक्षेप की संभावना समाप्त हो जाती है। हालांकि, PCAP से पता चलता है कि बैकरूम स्टॉक रूम में एक वायरलेस इन्वेंट्री स्कैनर उसी AP पर ट्रांसमिट कर रहा है। मोटी कंक्रीट की दीवारों के कारण, POS टर्मिनल और इन्वेंट्री स्कैनर एक-दूसरे के ट्रांसमिशन को नहीं सुन सकते हैं, लेकिन दोनों AP के साथ संचार कर सकते हैं - यह एक क्लासिक Hidden Node Problem है।
चरण 3 - समाधान: आर्किटेक्ट वायरलेस कंट्रोलर में POS SSID पर 2347 बाइट्स का RTS/CTS थ्रेशोल्ड कॉन्फ़िगर करता है। किसी भी बड़े डेटा फ़्रेम को ट्रांसमिट करने से पहले, POS टर्मिनल को अब एक RTS फ़्रेम भेजना होगा; AP सभी क्लाइंट्स द्वारा सुने जाने वाले CTS फ़्रेम के साथ प्रतिक्रिया करता है, माध्यम को आरक्षित करता है और टकराव को रोकता है। इसके अतिरिक्त, POS टर्मिनलों को एक समर्पित, सुरक्षित 5 GHz SSID पर माइग्रेट किया जाता है, जिसमें शेल्फिंग के माध्यम से बेहतर पैठ है और कम भीड़भाड़ होती है।
चरण 4 - सत्यापन: एक अनुवर्ती PCAP दिखाता है कि POS टर्मिनल की रीट्राय दर गिरकर 2.5% हो जाती है, और ट्रांजैक्शन लेटेंसी पूरी तरह से समाप्त हो जाती है।
अभ्यास प्रश्न
Q1. एक बड़े रिटेल मॉल के IT मैनेजर मोबाइल इन्वेंट्री स्कैनर्स के लिए रुक-रुक कर होने वाले कनेक्टिविटी ड्रॉप की समस्या का समाधान कर रहे हैं। एक वायरलेस साइट सर्वे से गोदाम की पिछली गलियों में -72 dBm की सिग्नल स्ट्रेंथ का पता चलता है। मॉनिटर-मोड पैकेट कैप्चर से स्कैनर के MAC एड्रेस पर 14% का 802.11 रिट्राई रेट दिखाई देता है, और कई डेटा फ्रेम 1 Mbps पर ट्रांसमिट हो रहे हैं। इस धीमे प्रदर्शन का सबसे संभावित कारण क्या है, और इसके दो तत्काल सुधारात्मक कदम क्या हैं?
संकेत: सिग्नल स्ट्रेंथ थ्रेशोल्ड (विश्वसनीय एंटरप्राइज़ संचालन के लिए न्यूनतम -67 dBm है) और चैनल पर अन्य सभी क्लाइंट्स के लिए एयरटाइम क्षमता पर 1 Mbps ट्रांसमिशन रेट के प्रभाव, दोनों पर विचार करें।
मॉडल उत्तर देखें
इसका मुख्य कारण खराब सिग्नल कवरेज (जो -72 dBm द्वारा इंगित होता है, जो अनुशंसित -67 dBm थ्रेशोल्ड से कम है) और एयरटाइम की कमी (जो स्कैनर द्वारा 1 Mbps पर ट्रांसमिट करने के कारण होती है) का संयोजन है। सिग्नल कमजोर होने के कारण, स्कैनर कनेक्शन बनाए रखने के लिए अपनी डेटा रेट कम कर देता है, जिससे अत्यधिक एयरटाइम खर्च होता है और कोलिशन व सिग्नल की गिरावट के कारण रिट्राई रेट बढ़कर 14% हो जाता है।
तत्काल सुधारात्मक कदम: (1) वायरलेस कंट्रोलर में लेगेसी डेटा रेट को अक्षम करें और न्यूनतम बेसिक रेट को 12 Mbps पर सेट करें। यह स्कैनर को नजदीकी AP पर रोम करने के लिए मजबूर करेगा या उसे इतनी कम और अक्षम दरों पर जुड़ने से रोकेगा। (2) मौजूदा AP का स्थान बदलें या पिछली गली के पास एक नया AP जोड़ें ताकि सिग्नल स्ट्रेंथ कम से कम -67 dBm तक आ सके, जिससे यह सुनिश्चित हो सके कि स्कैनर उच्च MCS इंडेक्स पर ट्रांसमिट कर सके और तुरंत रिट्राई रेट कम हो और एयरटाइम वापस मिल सके।
Q2. एक कॉर्पोरेट कार्यालय में धीमे WiFi नेटवर्क के पैकेट कैप्चर विश्लेषण के दौरान, एक नेटवर्क इंजीनियर देखता है कि औसत TCP Round-Trip Time (RTT) 450ms है और HTTP रिस्पांस समय औसत 3.2 सेकंड है। हालांकि, 802.11 फ्रेम रिट्राई दर लगातार 3% से कम है, और कुल चैनल उपयोग केवल 22% है। यह डेटा प्रदर्शन की बाधा (bottleneck) के स्थान के बारे में क्या संकेत देता है?
संकेत: RF-लेयर मैट्रिक्स (रिट्राई रेट, चैनल यूटिलाइजेशन) की तुलना ट्रांसपोर्ट और एप्लिकेशन-लेयर मैट्रिक्स (TCP RTT, HTTP रिस्पॉन्स टाइम) से करें। इसका क्या अर्थ है जब मैट्रिक्स का एक सेट स्वस्थ हो और दूसरा न हो?
मॉडल उत्तर देखें
यह डेटा इंगित करता है कि प्रदर्शन की बाधा (bottleneck) वायरलेस नेटवर्क पर नहीं है; इसके बजाय, यह अपस्ट्रीम वायर्ड नेटवर्क, सर्वर या स्वयं एप्लिकेशन पर मौजूद है। 3% से कम की 802.11 रिट्राई दर और 22% का चैनल उपयोग बिना किसी भौतिक-परत हस्तक्षेप, कंजेशन या टकराव की समस्याओं के एक स्वस्थ, स्वच्छ RF वातावरण के उत्कृष्ट संकेतक हैं। इसलिए उच्च TCP RTT (450ms) और धीमा HTTP रिस्पांस समय (3.2 सेकंड) AP द्वारा वायर्ड स्विच पर ट्रैफ़िक अग्रेषित करने के बाद होने वाली देरी के कारण होना चाहिए - संभावित रूप से एक ओवरलोडेड DHCP सर्वर, धीमा DNS रिज़ॉल्यूशन, WAN गेटवे कंजेशन, या एप्लिकेशन सर्वर पर एक बाधा। नेटवर्क इंजीनियर विश्वास के साथ वायरलेस नेटवर्क को निर्दोष घोषित कर सकता है और समस्या निवारण को वायर्ड बैकहॉल और सर्वर इंफ्रास्ट्रक्चर पर केंद्रित कर सकता है।
Q3. एक स्टेडियम संचालन निदेशक 15,000 संभावित दर्शकों वाले कार्यक्रम की तैयारी कर रहा है। स्टेडियम के मौजूदा WiFi नेटवर्क में पूरे सीटिंग क्षेत्र में 5 GHz APs तैनात हैं। एक पूर्व-इवेंट PCAP दिखाता है कि बिना किसी सक्रिय अतिथि के भी, चैनल 44 पर चैनल उपयोग 35% है, जिसमें लगभग पूरी तरह से 40 APs के बीकन फ्रेम शामिल हैं जो एक-दूसरे की सुनने की सीमा के भीतर हैं। इस घटना को क्या कहा जाता है, और निदेशक कार्यक्रम शुरू होने से पहले इसका समाधान कैसे कर सकता है?
संकेत: डिफ़ॉल्ट बीकन अंतराल और बुनियादी दरों पर एक ही चैनल पर बहुत अधिक APs प्रसारित करने के प्रभाव के बारे में सोचें। 1 Mbps बनाम 24 Mbps पर एक सिंगल बीकन फ्रेम कितना एयरटाइम लेता है?
मॉडल उत्तर देखें
इस घटना को मैनेजमेंट फ्रेम कंजेशन (विशेष रूप से, बीकन ओवरहेड) कहा जाता है। यह तब होता है जब APs की एक उच्च डेंसिटी को एक ही चैनल पर कॉन्फ़िगर किया जाता है और बिना किसी क्लाइंट के जुड़े होने पर भी 1 Mbps की सबसे कम बुनियादी दर पर हर 100ms में बीकन प्रसारित किया जाता है, जिससे उपलब्ध एयरटाइम का एक बड़ा हिस्सा समाप्त हो जाता है।
समाधान के चरण: (1) चैनल 44 को साझा करने वाले APs की संख्या को कम करके, DFS चैनलों सहित 5 GHz स्पेक्ट्रम का अधिक उपयोग करके, या यदि समर्थित हो तो 6 GHz तैनात करके चैनल योजना को अनुकूलित करें, यह सुनिश्चित करते हुए कि एक ही चैनल पर APs भौतिक रूप से एक-दूसरे से सुरक्षित दूरी पर हों। (2) न्यूनतम बुनियादी दर को बढ़ाकर 24 Mbps करें। बीकन को 1 Mbps के बजाय 24 Mbps पर प्रसारित करने के लिए बाध्य करके, प्रत्येक बीकन 24 गुना तेजी से प्रसारित होता है, जिससे मैनेजमेंट ओवरहेड द्वारा उपयोग किया जाने वाला एयरटाइम तुरंत लगभग 30% से घटकर 2% से कम हो जाता है, जिससे वास्तविक डेटा ट्रैफ़िक के लिए चैनल पुनः प्राप्त हो जाता है।
इस श्रृंखला में आगे पढ़ें
WiFi Roaming समस्याओं के निदान के लिए एक चरण-दर-चरण मार्गदर्शिका
यह व्यापक मार्गदर्शिका उद्यम IT लीडरों और नेटवर्क आर्किटेक्ट्स को WiFi roaming समस्याओं के निदान और समाधान के लिए एक आधिकारिक, चरण-दर-चरण कार्यप्रणाली प्रदान करती है। IEEE 802.11k/v/r मानकों के तकनीकी गहन अध्ययन को वास्तविक दुनिया के केस स्टडीज और पैकेट-स्तरीय विश्लेषण के साथ जोड़कर, यह संदर्भ टीमों को 'sticky client' समस्या को समाप्त करने और निर्बाध मोबाइल कनेक्टिविटी प्रदान करने के लिए सक्षम बनाता है। इसमें RF साइट सर्वेक्षण और नियंत्रक कॉन्फ़िगरेशन ऑडिट से लेकर ओवर-द-एयर पैकेट कैप्चर विश्लेषण और समाधान के बाद के सत्यापन तक का पूरा नैदानिक वर्कफ़्लो शामिल है।
आपके स्टेडियम का WiFi ठप क्यों हो जाता है (और इसे कैसे ठीक करें)
यह आधिकारिक तकनीकी गाइड स्टेडियम WiFi कंजेशन के मूल कारण — प्रोग्रैमेटिक विज्ञापनों और टेलीमेट्री को लोड करने वाले 50,000 डिवाइसों की एक साथ बैकग्राउंड चैटर — की जांच करती है, और प्राथमिक शमन रणनीति के रूप में Edge DNS फ़िल्टरिंग को तैनात करने के लिए एक विस्तृत आर्किटेक्चरल ब्लूप्रिंट प्रदान करती है। IT निदेशकों, CTO और नेटवर्क आर्किटेक्ट्स के लिए डिज़ाइन किया गया, यह वेन्यू ऑपरेटरों को बैंडविड्थ पुनः प्राप्त करने और बड़े पैमाने पर उच्च-प्रदर्शन कनेक्टिविटी प्रदान करने में मदद करने के लिए कार्रवाई योग्य कार्यान्वयन मार्गदर्शन, वास्तविक दुनिया के केस स्टडीज़ और मापने योग्य ROI फ्रेमवर्क प्रदान करता है।
गैस्ट WiFi पर कनेक्टेड लेकिन नो इंटरनेट एरर को हल करना
यह आधिकारिक तकनीकी संदर्भ गाइड बताती है कि कैसे भीड़भाड़ वाले नेटवर्क के कारण होने वाले DNS टाइमआउट गैस्ट WiFi पर 'Connected, No Internet' एरर को ट्रिगर करते हैं। यह नेटवर्क आर्किटेक्ट्स और IT प्रबंधकों को इन बाधाओं को हल करने और गैस्ट ऑनबोर्डिंग को बेहतर बनाने के लिए एंटरप्राइज DNS फिल्टर को तैनात करने के लिए व्यावहारिक कार्यान्वयन चरण प्रदान करता है।
अपने विशिष्ट सेटअप को लेकर कोई सवाल हैं?
हमारी टीम 80,000 से अधिक वेन्यू में वेन्यू ऑपरेटरों, IT मैनेजरों और नेटवर्क इंजीनियरों के साथ काम करती है। 20 मिनट का कॉल बुक करें और हम आपको दिखाएंगे कि आपके जैसे अन्य लोगों ने इसे कैसे हल किया।