How to Measure WiFi Signal Strength and Coverage
This technical reference guide equips network technicians and IT managers with a practical, vendor-neutral framework for auditing WiFi signal strength and coverage using RSSI, SNR, and heatmapping tools. It covers the physics of RF propagation, step-by-step survey methodology, and real-world remediation scenarios drawn from hospitality and logistics environments. Optimising coverage directly reduces helpdesk overheads, supports compliance requirements, and unlocks the telemetry data needed to drive operational intelligence across enterprise venues.
Listen to this guide
View podcast transcript

Executive Summary
For IT managers and network architects overseeing large-scale venues — whether hospitality , retail , stadiums, or public-sector environments — delivering consistent, high-performance WiFi is a baseline operational requirement, not a differentiator. Poor signal strength and coverage gaps directly impact staff productivity, operational efficiency, and guest experience. This guide provides a practical, vendor-neutral framework for measuring WiFi signal strength, interpreting the critical metrics of RSSI (Received Signal Strength Indicator) and SNR (Signal-to-Noise Ratio), and deploying heatmap tools for comprehensive coverage audits. By standardising how your teams measure and remediate wireless networks, you can mitigate risk, ensure alignment with standards such as PCI DSS and IEEE 802.1X, and optimise the return on your wireless infrastructure investment. The guide also addresses the hidden performance costs that arise from poor RF design — costs explored in depth in The Hidden Cost of Telemetry Data on Corporate WLANs .
Technical Deep-Dive: RSSI, SNR, and the Physics of Coverage
Measuring WiFi coverage extends well beyond checking the signal bars on a device. Those bars are an arbitrary, manufacturer-defined representation of signal quality and should never be used as an engineering baseline. Effective coverage measurement requires empirical RF data, collected systematically and interpreted against defined performance thresholds.
RSSI: The Coverage Baseline
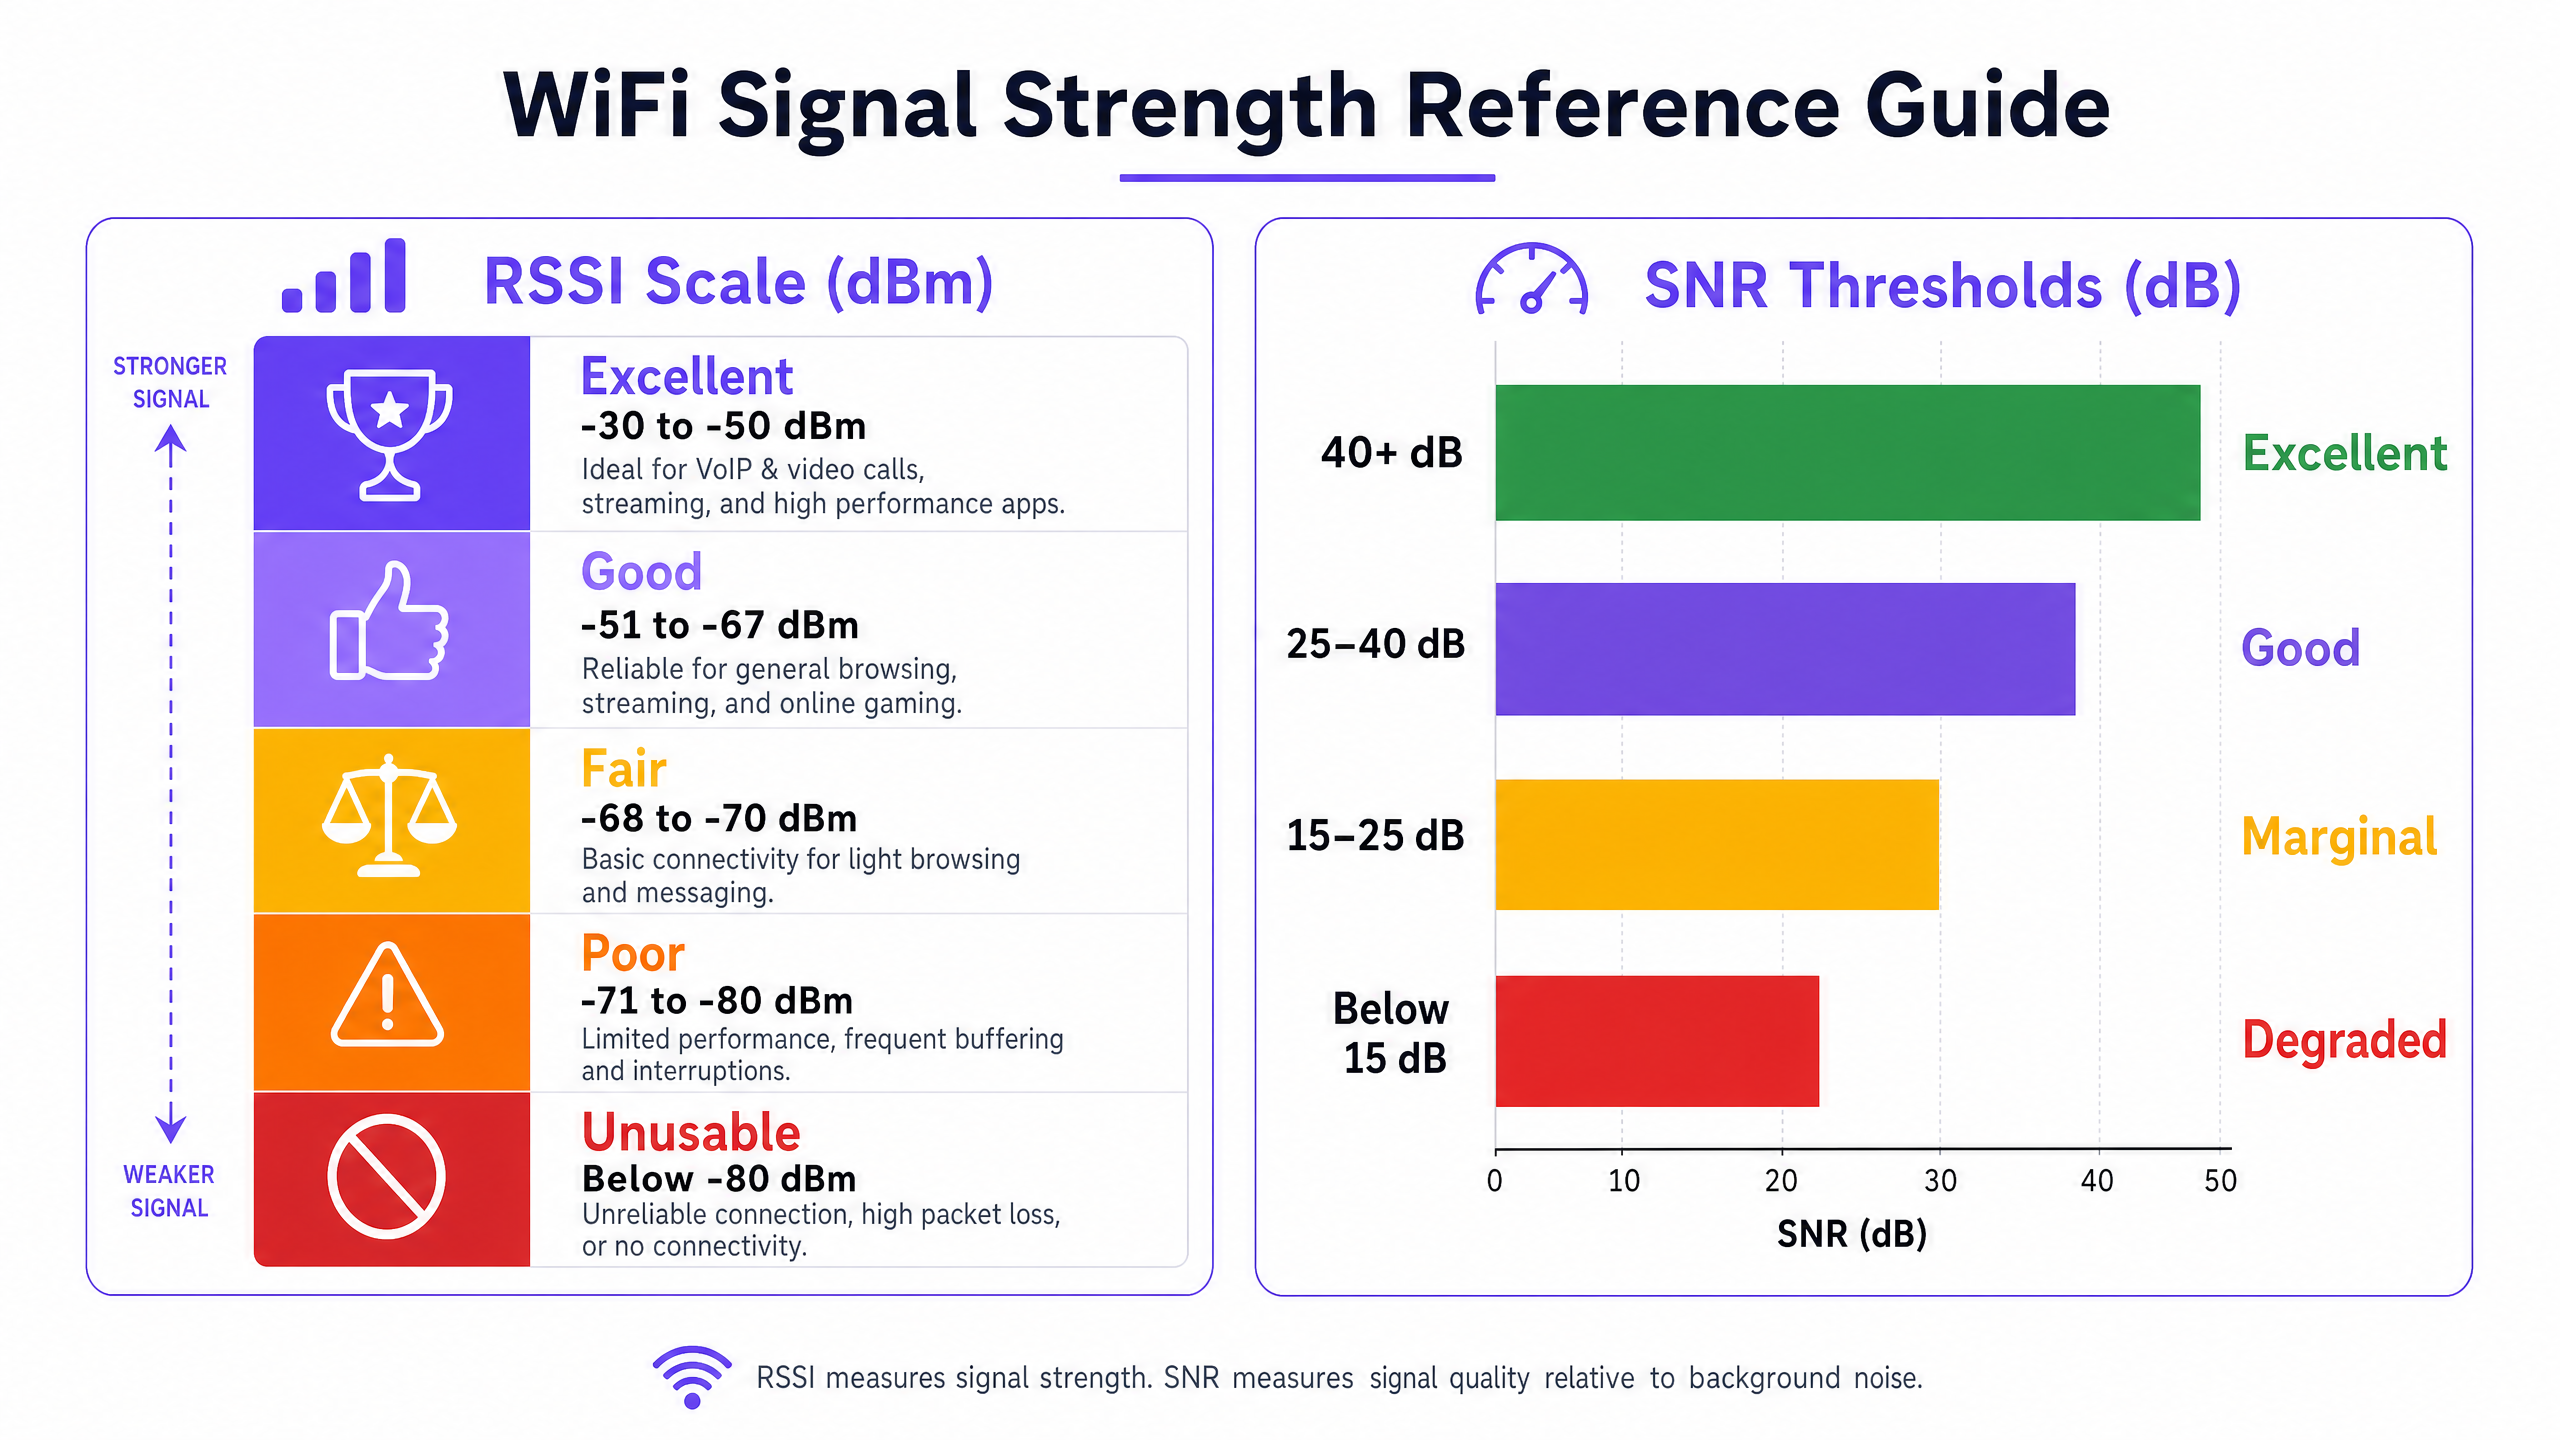
RSSI is the fundamental metric for measuring the power level of the RF signal received by the client device. It is expressed in decibels relative to a milliwatt (dBm). Because it operates on a negative scale, values closer to zero represent a stronger signal. The scale is logarithmic: every 3 dB change represents a doubling or halving of signal power, which means the difference between -67 dBm and -73 dBm is not incremental — it is a fourfold reduction in received power.
The following thresholds represent the practical operating ranges for enterprise deployments:
| RSSI Range | Classification | Suitable Applications |
|---|---|---|
| -30 to -50 dBm | Excellent | VoIP, HD video conferencing, high-throughput data |
| -51 to -67 dBm | Good | All standard enterprise applications |
| -68 to -70 dBm | Marginal | Basic web browsing, email |
| -71 to -80 dBm | Poor | Intermittent connectivity, high packet loss |
| Below -80 dBm | Unusable | Connection drops, unusable performance |
The -67 dBm threshold is the industry-standard minimum for reliable enterprise connectivity. Most enterprise client devices are programmed to initiate a roaming scan when the signal drops below this level, making it the critical design parameter for cell overlap planning.
SNR: The Quality Multiplier
A strong RSSI is a necessary but insufficient condition for good network performance. SNR measures the difference between the received signal strength and the background RF noise floor, expressed in decibels (dB). It determines the modulation and coding scheme (MCS) that devices can negotiate with the AP, which directly governs achievable throughput. Wi-Fi 6 (802.11ax) supports up to 1024-QAM, but that requires an SNR of approximately 35 dB or higher. At low SNR values, devices fall back to lower-order modulation schemes, dramatically reducing throughput.
| SNR Range | Classification | Impact on Throughput |
|---|---|---|
| > 40 dB | Excellent | Maximum data rates (1024-QAM achievable) |
| 25 – 40 dB | Good | Reliable high-throughput operation |
| 15 – 25 dB | Marginal | Reduced data rates, increased retries |
| < 15 dB | Degraded | Significant packet loss, connection instability |
Co-Channel and Adjacent Channel Interference
In high-density environments — a conference centre during a major event, a retail store on peak trading days — interference is the primary constraint on network capacity. Co-Channel Interference (CCI) occurs when multiple APs transmit on the same channel within range of each other. Under the 802.11 CSMA/CA protocol, devices must wait for the channel to be clear before transmitting, creating contention and reducing effective throughput. Adjacent Channel Interference (ACI) arises when APs use overlapping channels — for example, channels 1 and 2 in the 2.4 GHz band — causing spectral overlap and signal degradation.
The 2.4 GHz band offers only three non-overlapping channels (1, 6, and 11), making it structurally unsuitable for high-density deployments. The 5 GHz band provides up to 24 non-overlapping 20 MHz channels, and the 6 GHz band (Wi-Fi 6E/7) adds a further 59 channels, making these the correct target for enterprise capacity planning.
Implementation Guide: Conducting a WiFi Coverage Audit
A structured coverage audit is the foundation of any optimisation programme. The following methodology is vendor-neutral and applicable to environments from a 50-room hotel to a 60,000-seat stadium.
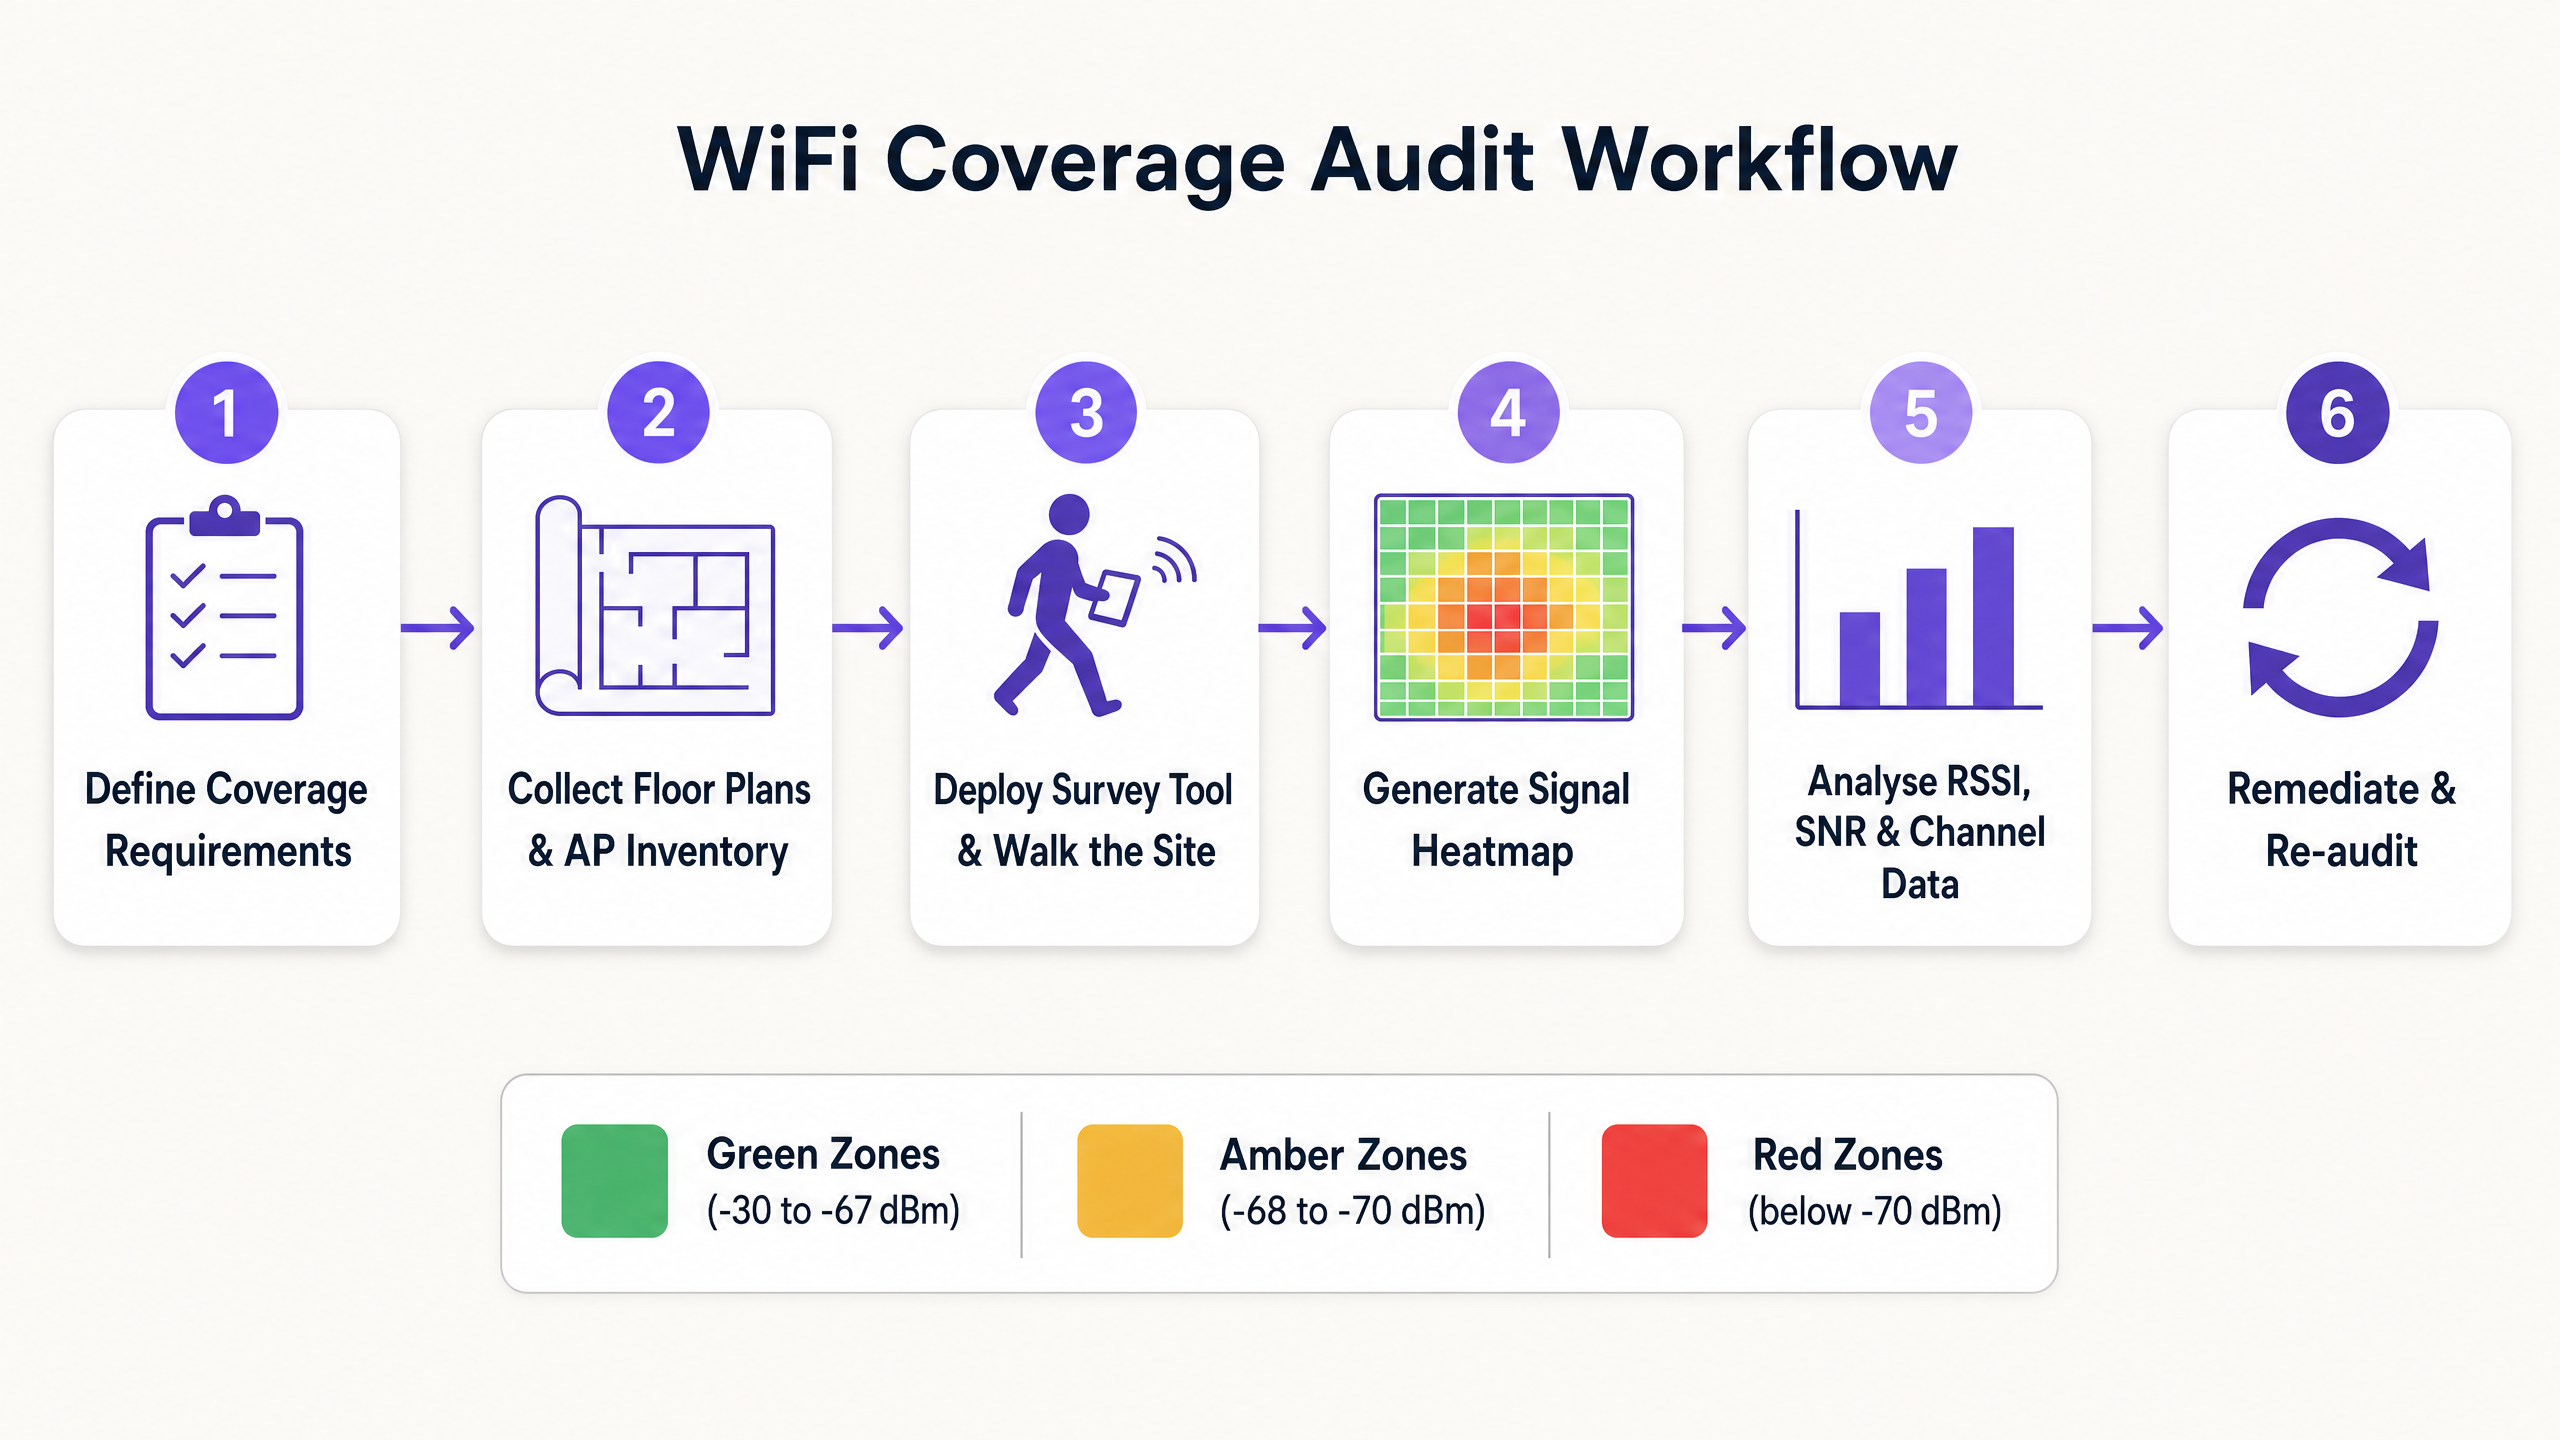
Step 1: Define Coverage Requirements and Performance Thresholds
Before conducting any survey, document the specific requirements for the environment. A warehouse running barcode scanners has fundamentally different requirements from a clinical environment supporting patient monitoring devices or a conference centre running high-density video conferencing. Define the miminimum acceptable RSSI and SNR thresholds for each application type, and identify any compliance requirements (e.g., PCI DSS for retail payment systems, or HIPAA-adjacent standards for healthcare environments).
Step 2: Collect Floor Plans and AP Inventory
Obtain accurate, scaled floor plans for all areas in scope. Import these into your survey tool and document the current AP inventory, including model, firmware version, transmit power settings, and channel assignments. This baseline is essential for correlating survey findings with configuration parameters.
Step 3: Select the Appropriate Survey Type
Three survey methodologies serve different purposes:
Predictive Survey: Uses software modelling to simulate the RF environment based on floor plans, wall materials, and AP placement. Essential for greenfield deployments and major redesigns. Accuracy depends on the quality of the building material database used.
Passive Survey: The surveying device listens to all RF traffic in the environment, capturing beacon frames from every visible AP to map RSSI, channel utilisation, and rogue device presence. This is the standard method for auditing existing coverage and generating heatmaps. It does not require the surveying device to associate with the network.
Active Survey: The surveying device associates with the target network and actively transmits data (typically via iPerf or ICMP) to measure real-world throughput, latency, jitter, and roaming performance. This is the definitive method for validating that the network performs as designed under load.
Step 4: Execute the Walk Survey
For passive and active surveys, the technician walks the entire coverage area at a consistent pace, typically 0.5 to 1 metre per second, ensuring the survey tool captures sufficient data points per square metre. Pay particular attention to areas with known attenuation sources: concrete pillars, metal shelving, lift shafts, and areas with high water content (e.g., aquariums, large planters).
Step 5: Generate and Interpret Heatmaps
Post-survey, generate the following heatmaps as a minimum:
- RSSI Heatmap: Identifies dead zones and coverage gaps against your defined threshold.
- SNR Heatmap: Highlights areas where interference is degrading signal quality.
- Channel Interference Heatmap: Identifies CCI and ACI hotspots.
- AP Coverage Overlap Heatmap: Validates that cell overlap is sufficient for seamless roaming.
When reviewing heatmaps, ensure that coverage cell edges maintain 15–20% overlap at the -67 dBm threshold. Insufficient overlap results in roaming failures; excessive overlap at high transmit power results in CCI.
Step 6: Remediate and Re-audit
Document all findings and prioritise remediation actions by impact. Common remediation steps include adjusting AP transmit power, modifying channel assignments, relocating APs to overcome attenuation, adding APs to fill coverage gaps, and implementing band steering to push capable clients to 5 GHz. Following remediation, conduct a validation survey to confirm that changes have achieved the desired outcome.
Best Practices for Enterprise WiFi Optimisation
Design for Capacity, Not Just Coverage. In modern enterprise environments, the challenge is rarely providing a signal; it is supporting hundreds of concurrent devices with consistent performance. High-density design requires more APs operating at lower transmit power, with tighter channel reuse patterns. This is particularly relevant in hospitality venues and transport hubs where device density can be extreme.
Standardise on 5 GHz and 6 GHz. The 2.4 GHz band is structurally congested. Push all capable corporate and staff devices to the 5 GHz or 6 GHz bands using band steering or SSID separation. Reserve 2.4 GHz for legacy IoT devices that cannot operate on higher frequencies. For a detailed analysis of the performance impact of unmanaged device traffic on corporate WLANs, refer to The Hidden Cost of Telemetry Data on Corporate WLANs .
Implement Robust Authentication. Ensure corporate networks are secured with IEEE 802.1X and WPA3-Enterprise. For guest and visitor access, deploy a managed Guest WiFi solution with a secure captive portal. As explored in How a wi fi assistant Enables Passwordless Access in 2026 , modern authentication frameworks can eliminate password management overhead while maintaining security compliance.
Adopt Continuous Monitoring. A point-in-time audit captures the RF environment at a single moment. The wireless environment is dynamic — new interference sources emerge, device populations change, and physical modifications alter propagation patterns. Implement a WiFi Analytics platform to continuously monitor network health, client performance, and coverage metrics. This also enables the collection of footfall and dwell time data that supports broader operational intelligence initiatives, including those aligned with smart city programmes such as those led by Iain Fox at Purple .
Troubleshooting and Risk Mitigation
When coverage or performance issues arise, a structured diagnostic approach prevents misdiagnosis and wasted remediation effort.
1. Determine the Scope. Is the issue affecting a single user, a defined area, or the entire venue? A single-user issue almost always points to a client device problem (driver, hardware, or roaming configuration). An area-specific issue points to the RF environment. A venue-wide issue points to infrastructure (controller, DHCP, DNS, or upstream connectivity).
2. Verify the Physical Layer. Confirm that affected APs are receiving adequate PoE power, that cabling is intact, and that APs have not been physically obstructed or relocated since the last survey. A surprisingly high proportion of performance issues trace back to physical changes in the environment.
3. Analyse the RF Environment. Use a spectrum analyser to identify non-WiFi interference sources. Microwave ovens, wireless CCTV cameras, and Bluetooth devices operating in the 2.4 GHz band are common culprits. In industrial environments, variable-frequency drives and other motor control equipment can generate significant broadband RF noise.
4. Review AP Configuration. Check transmit power levels, channel assignments, and firmware versions. Confirm that dynamic radio management (DRM) policies are operating correctly and that no APs have reverted to default high-power settings.
5. Examine Client Capabilities. Older client devices with outdated wireless drivers, or devices with aggressive power-saving settings, frequently exhibit connectivity issues regardless of network quality. Maintain a register of approved client hardware and driver versions for corporate-managed devices.
ROI and Business Impact
Investing in regular WiFi audits and optimisation delivers measurable, quantifiable business value across multiple dimensions.
Staff Productivity. Eliminating dead zones and interference ensures that staff can access critical operational applications without interruption — whether that is inventory management on a retail floor, patient record access in a healthcare facility, or operational coordination in a transport hub. Even a 5-minute-per-day reduction in connectivity-related delays across a 200-person operation represents over 170 hours of recovered productivity per year.
Reduced Support Overhead. A stable, well-designed network generates significantly fewer helpdesk tickets. WiFi connectivity issues are consistently among the top three categories of IT support requests in large organisations. Resolving the underlying RF issues — rather than repeatedly addressing symptoms — delivers sustained reductions in support volume.
Compliance and Risk Mitigation. For organisations subject to PCI DSS (retail payment environments), GDPR (any organisation processing personal data over WiFi), or sector-specific standards, a documented and regularly audited wireless network is a compliance requirement. Rogue AP detection, enabled by passive survey tooling and continuous monitoring, is a specific PCI DSS requirement.
Operational Intelligence. An optimised network provides accurate, high-fidelity telemetry data. This data — covering device counts, dwell times, and movement patterns — is the foundation of venue analytics. As Purple's offline maps capability demonstrates ( Purple Launches Offline Maps Mode for Seamless, Secure Navigation to WiFi Hotspots ), a well-instrumented wireless network enables advanced location services that drive both operational efficiency and visitor experience.
Key Definitions
RSSI (Received Signal Strength Indicator)
A measurement of the power level of the RF signal received by the client device, expressed in negative decibels relative to a milliwatt (dBm). Values closer to zero indicate a stronger signal.
The primary metric for assessing basic coverage. Used to identify dead zones and validate that signal strength meets the minimum threshold for the target application.
SNR (Signal-to-Noise Ratio)
The difference between the received signal strength (RSSI) and the background RF noise floor, expressed in decibels (dB). Determines the modulation scheme devices can negotiate, directly governing throughput.
Critical for diagnosing performance issues in environments where RSSI appears adequate but throughput is poor. The key metric for identifying interference-related degradation.
Co-Channel Interference (CCI)
Interference caused when multiple APs within range of each other transmit on the same channel, forcing devices to defer transmission under the 802.11 CSMA/CA protocol.
The primary cause of capacity degradation in high-density deployments. Mitigated through careful channel planning, dynamic radio management, and reducing AP transmit power.
Adjacent Channel Interference (ACI)
Interference caused by APs transmitting on spectrally overlapping channels (e.g., channels 1 and 2 in the 2.4 GHz band), causing signal bleed between channels.
Prevented by using only non-overlapping channels: 1, 6, and 11 in the 2.4 GHz band. Not an issue in the 5 GHz or 6 GHz bands when using 20 MHz channel widths.
Attenuation
The loss of RF signal strength as waves pass through physical objects. Attenuation varies significantly by material: glass causes ~2 dB loss, drywall ~3 dB, concrete ~10–15 dB, and metal causes near-total reflection.
Must be factored into predictive surveys and physical AP placement decisions. Particularly significant in warehouses, hospitals, and venues with metal infrastructure.
Passive Survey
A site survey method in which the surveying tool listens to all RF traffic without associating with any network, capturing beacon frames to map RSSI, channel utilisation, and rogue AP presence.
The standard method for auditing existing coverage and generating heatmaps. Does not require network credentials and can detect all visible APs including unauthorised devices.
Active Survey
A site survey method in which the surveying device associates with the target network and actively transmits data to measure real-world throughput, latency, jitter, and roaming performance.
Used to validate actual network performance under simulated load conditions. Essential for applications with strict latency or throughput requirements, such as VoIP or AGV control systems.
Roaming (802.11r / Fast BSS Transition)
The process of a client device transitioning from one AP to another as it moves through a venue. 802.11r (Fast BSS Transition) reduces the authentication overhead during roaming, minimising the transition latency.
Requires careful cell overlap design (15–20% at -67 dBm) to ensure seamless transitions. Critical for voice, video, and real-time control applications. Sticky client behaviour — where devices hold onto a weak signal — is a common roaming failure mode.
Worked Examples
A 300-room luxury hotel is experiencing frequent guest and staff complaints about dropped VoIP calls and poor video streaming in the newly renovated West Wing. The IT team has confirmed via the network management system that all APs in the wing are online and reporting normal status.
Step 1: Deploy a technician to conduct a combined passive and active site survey of the West Wing using a professional survey tool. Step 2: Generate an RSSI heatmap — this shows signal strength is generally above -67 dBm throughout the wing, ruling out basic coverage gaps. Step 3: Generate an SNR heatmap — this reveals significant areas where SNR drops below 15 dB, particularly in corridors and meeting rooms. Step 4: Generate a Channel Interference heatmap — this identifies severe Co-Channel Interference (CCI) caused by the newly installed APs operating at maximum transmit power (23 dBm) on the same 5 GHz channels as adjacent APs. Step 5: Remediation — implement a dynamic radio management (DRM) profile to automatically reduce transmit power to 8–12 dBm and assign non-overlapping channels. Disable 2.4 GHz radios on every other AP to reduce CCI on the legacy band. Step 6: Conduct a validation active survey to confirm that SNR has improved above 25 dB across the wing and that roaming performance meets the VoIP threshold.
A large retail distribution centre is deploying a fleet of autonomous guided vehicles (AGVs) that require continuous, low-latency WiFi connectivity. During initial testing, the AGVs frequently disconnect when transitioning between aisles, causing operational disruptions.
Step 1: Document the AGV connectivity requirements — minimum RSSI of -65 dBm, SNR above 25 dB, and roaming latency below 50 ms for the control protocol. Step 2: Conduct an active survey along all planned AGV routes, with the survey tool configured to simulate the AGV client profile. Step 3: Analysis reveals that the existing APs, mounted 15 metres high on the ceiling with omnidirectional antennas, provide adequate signal in empty aisles but the RSSI drops to -78 dBm when aisles are fully stocked with metal shelving and liquid products — materials with high RF attenuation coefficients. Step 4: The channel plan also shows CCI between APs sharing channels in adjacent aisles. Step 5: Remediation — redesign the WLAN using directional patch antennas (e.g., 8 dBi patch) mounted at the ends of aisles at a height of 2 metres, directing RF energy down the corridors. Implement a dedicated SSID for AGVs with 802.11r (Fast BSS Transition) enabled to reduce roaming latency. Step 6: Validate with an active survey along all AGV routes under full inventory load conditions.
Practice Questions
Q1. A hospital IT manager is receiving complaints from nursing staff about dropped calls on their VoIP handsets in a specific ward. A passive survey confirms that RSSI throughout the ward is consistently between -55 dBm and -62 dBm. What is the most likely root cause, and what diagnostic step should be taken next?
Hint: RSSI is well within the acceptable range. Consider what other metric determines whether that signal can support VoIP traffic.
View model answer
The issue is almost certainly low SNR rather than a coverage gap. An RSSI of -55 to -62 dBm is excellent, so the signal is not the problem. The next step is to generate an SNR heatmap for the ward. Low SNR in this scenario is likely caused by Co-Channel Interference (CCI) from adjacent APs, or potentially from non-WiFi interference sources such as medical equipment operating in the 2.4 GHz band. A spectrum analysis should also be conducted to identify non-WiFi interference sources.
Q2. You are designing a WLAN for a high-density conference centre that will host events with up to 2,000 concurrent devices. Your predictive survey indicates that 60 APs are required to achieve the necessary capacity. How should you approach the 2.4 GHz radio configuration?
Hint: Consider the number of non-overlapping channels available in the 2.4 GHz band relative to the number of APs.
View model answer
The 2.4 GHz radios on the majority of APs should be disabled. With only three non-overlapping channels (1, 6, and 11) available in the 2.4 GHz band, deploying 60 APs all transmitting on 2.4 GHz in a single space would create catastrophic Co-Channel Interference, rendering the band unusable. A common approach is to enable 2.4 GHz on approximately one in four APs to provide basic coverage for legacy devices, while directing all capable clients to the 5 GHz and 6 GHz bands where sufficient non-overlapping channels exist to support the full AP count.
Q3. A retail store manager reports that WiFi performance near the front entrance is poor. A passive survey reveals an RSSI of -77 dBm at the entrance. The nearest AP is located 18 metres away, behind a structural concrete pillar. What is the remediation approach?
Hint: Consider the attenuation characteristics of the physical obstacle and the options available for improving coverage.
View model answer
The concrete pillar is causing significant RF attenuation, creating a coverage shadow at the entrance. At -77 dBm, the signal is in the 'poor' range and insufficient for reliable connectivity. The primary remediation option is to install an additional AP near the entrance to provide direct, unobstructed coverage. If cabling to that location is not feasible, the existing AP could be relocated to a position with line-of-sight to the entrance. Increasing the transmit power of the existing AP is unlikely to be effective — the attenuation from a concrete pillar is typically 10–15 dB, and increasing transmit power by that amount would likely cause CCI with other APs in the store.