WiFi Analytics Use Cases: How Businesses Are Utilising Location Data
This guide provides IT managers, network architects, CTOs, and venue operations directors with a practical, authoritative reference on WiFi analytics use cases — covering how businesses across retail, healthcare, hospitality, and events are utilising location data from existing wireless infrastructure to drive operational efficiency and commercial ROI. It examines the technical architecture underpinning spatial intelligence platforms, details real-world deployment scenarios, and provides vendor-neutral implementation guidance alongside compliance and risk mitigation frameworks. For any organisation operating a physical venue with guest WiFi, this guide maps the path from passive connectivity to active business intelligence.
Listen to this guide
View podcast transcript
📚 Part of our core series: Marketing & Analytics Platform →
Executive Summary
For IT leaders and venue operations directors, deploying a robust wireless network is no longer just about providing internet access — it is a strategic investment in spatial intelligence. This guide explores practical wifi analytics use cases across enterprise environments, detailing how organisations utilise location data to optimise operations, enhance customer experiences, and drive measurable ROI. By transforming standard access points into a comprehensive Guest WiFi and WiFi Analytics engine, businesses can extract actionable insights from device probe requests and association data. From retail footfall mapping to queue management in healthcare facilities, we examine the technical architecture, deployment strategies, and risk mitigation protocols required to turn connectivity into commercial advantage. For a foundational overview of the technology, see What Is WiFi Analytics? A Complete Guide .
Technical Deep Dive
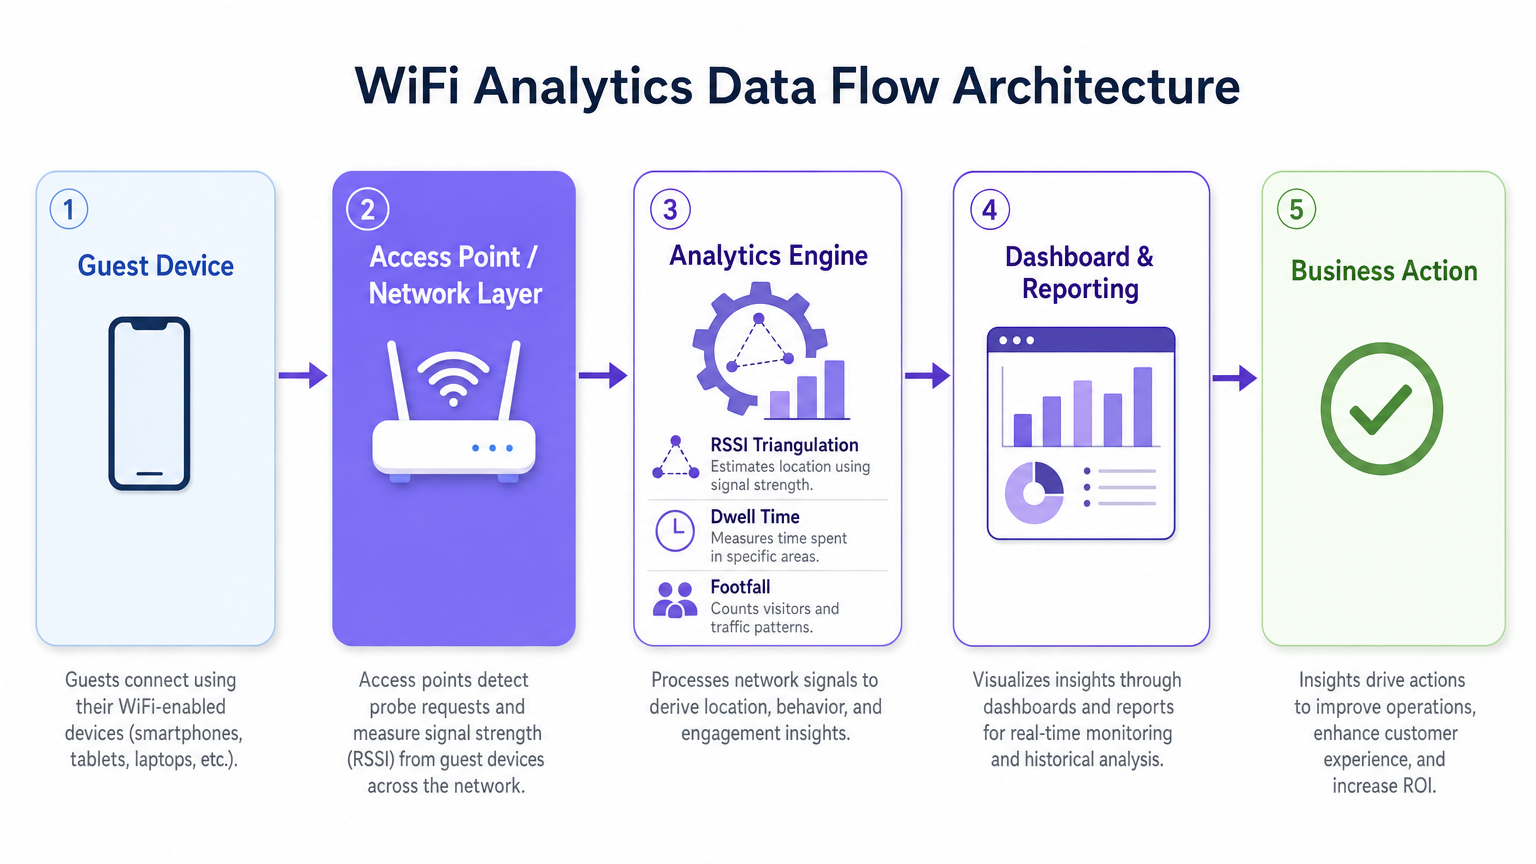
Understanding the mechanics of a WiFi Analytics platform requires examining the data flow from the client device to the analytics engine. Modern access points (APs) detect unassociated probe requests broadcast by smartphones seeking known networks. By aggregating Received Signal Strength Indicator (RSSI) values across multiple APs, the system triangulates device locations with accuracy that varies depending on deployment density and environmental RF conditions.
When a user actively connects via a captive portal, the analytics engine links the MAC address to an authenticated user profile. This transition from anonymous presence analytics to authenticated demographic data is the foundation of enterprise spatial intelligence. Platforms like Purple's Guest WiFi solution are specifically designed to facilitate this transition at scale, integrating captive portal management, consent collection, and analytics in a single deployment.
Data Collection Mechanisms
The three primary mechanisms of data collection in a WiFi analytics deployment are presence analytics, location analytics, and authenticated analytics. Presence analytics utilises unassociated probe requests to count footfall, measure dwell times, and identify returning visitors based on hashed MAC addresses, providing broad venue traffic visibility without requiring active connections. Location analytics employs trilateration algorithms to map device movement across a floor plan; advanced deployments may integrate complementary positioning technologies as detailed in the Indoor Positioning System: UWB, BLE, & WiFi Guide to enhance precision beyond standard WiFi capabilities. Authenticated analytics captures demographic and behavioural data when users authenticate through the captive portal, integrating with CRM systems and loyalty programmes to build comprehensive, longitudinal user profiles.
A critical technical consideration is MAC address randomisation. Modern iOS and Android operating systems randomise device MAC addresses to protect user privacy, which means that presence analytics based solely on unassociated probe requests will overcount unique visitors over extended periods. The mitigation strategy is to incentivise active authentication — through compelling captive portal offers, seamless social login, or OpenRoaming integration — so that the analytics engine tracks authenticated sessions rather than ephemeral randomised MACs. This directly links the quality of your portal experience to the quality of your analytics data.
Architecture and Standards
A production-grade WiFi analytics deployment follows a five-layer architecture: the client device layer, the access point and network layer (supporting IEEE 802.11ax / Wi-Fi 6 for high-density environments), the analytics engine performing RSSI triangulation and dwell-time computation, the dashboard and reporting layer, and the business action layer where insights drive operational decisions. For high-density venues — stadiums, conference centres, large retail floors — Wi-Fi 6 is the minimum recommended standard, introducing OFDMA and BSS Colouring to manage concurrent connections without throughput degradation.
Compliance with GDPR, CCPA, and PCI DSS (where payment data intersects with network infrastructure) is non-negotiable. MAC address hashing, explicit consent capture at the captive portal, data minimisation, and defined retention policies are baseline requirements for any deployment handling personal data.
Implementation Guide
Successfully deploying a WiFi analytics solution requires a structured approach to network design, hardware selection, and software configuration.
Phase 1 — Network Assessment and Site Survey. Conduct a comprehensive RF site survey to evaluate existing coverage, identify interference sources, and determine optimal AP placement. For location analytics accuracy, you need a minimum of three APs detecting any given device simultaneously. In practice, this means AP spacing of approximately 15–20 metres in open-plan environments, with denser placement in high-value zones such as retail checkout areas or hospital waiting rooms.
Phase 2 — Captive Portal Design and Authentication Strategy. Design a Captive Portal that minimises friction while maximising data acquisition. Implement progressive profiling — collect a minimal data set at first connection (email address and consent) and enrich the profile over subsequent visits. Support multiple authentication methods: social login (Google, Facebook), email registration, and OpenRoaming for seamless roaming users. Ensure the portal is mobile-optimised and loads within three seconds on a 4G connection.
Phase 3 — Analytics Platform Integration. Integrate the analytics platform with existing business intelligence tools, CRM systems, and marketing automation platforms. Purple's WiFi Analytics platform provides pre-built integrations with major CRM and marketing platforms, enabling cross-functional teams to act on spatial insights without requiring bespoke development. Define your key performance indicators before deployment — footfall counts, dwell times, return visit rates, zone-level heat maps — and configure dashboards accordingly.
Phase 4 — Compliance and Data Governance. Implement a Data Protection Impact Assessment (DPIA) before go-live. Ensure privacy notices are accurate, consent mechanisms are explicit and granular, and data retention policies are enforced at the platform level. Appoint a data owner responsible for ongoing compliance monitoring.
Best Practices
To maximise the value of a WiFi analytics investment, adhere to the following industry-standard recommendations.
Optimise AP density specifically for location analytics, not just coverage. A network designed for basic internet access will typically have insufficient AP overlap for reliable trilateration. Conduct a separate location-analytics-specific survey and adjust AP placement or add supplementary APs in high-value zones.
Implement MAC randomisation mitigation through compelling Captive Portal design. The connection rate — the proportion of detected devices that authenticate — is the single most important metric for analytics data quality. A well-designed portal with a clear value proposition (free WiFi, loyalty points, exclusive content) consistently achieves connection rates of 40–60% in retail and hospitality environments.
Calibrate location algorithms regularly. Environmental changes — new physical structures, seasonal product displays, varying crowd densities — affect RF propagation and can degrade location accuracy over time. Schedule quarterly calibration reviews and recalibrate after any significant physical changes to the venue.
Integrate WiFi analytics data with other operational data sources. The insights become significantly more powerful when correlated with point-of-sale data, staffing schedules, and marketing campaign timelines. This cross-functional integration is where the ROI case becomes compelling for senior stakeholders.
For organisations deploying across automotive or transport environments, the Wi-Fi in Auto: The Complete 2026 Enterprise Guide and Internet of Things Architecture: A Complete Guide provide relevant architectural context for extending WiFi analytics beyond traditional venue settings.
Troubleshooting & Risk Mitigation
Enterprise deployments commonly encounter challenges in three areas: data accuracy, user adoption, and compliance.
Inaccurate location data is typically caused by insufficient AP density, significant RF interference from adjacent networks or physical obstructions, or failure to account for MAC randomisation. Diagnose by comparing expected footfall counts against manual observation counts during a controlled test period. If variance exceeds 20%, conduct a fresh site survey and review AP placement.
Low authentication rates indicate a Captive Portal experience that is too complex, too slow, or insufficiently compelling. Audit the portal load time, the number of steps to authentication, and the clarity of the value proposition. A/B test different portal designs and offers to identify the highest-converting configuration.
Data privacy violations represent the most significant risk, with GDPR fines reaching up to 4% of global annual turnover. Mitigate by implementing a rigorous compliance programme from the outset: explicit consent capture, accurate privacy notices, data minimisation, anonymisation of presence analytics data, and regular compliance audits. Ensure your analytics platform vendor provides a Data Processing Agreement (DPA) and is certified to ISO 27001 or equivalent.
ROI & Business Impact
The business case for WiFi analytics is strongest when framed around specific operational outcomes rather than generic data collection. The following benchmarks are based on typical enterprise deployments across Purple's customer base.
| Vertical | Primary Use Case | Typical Outcome |
|---|---|---|
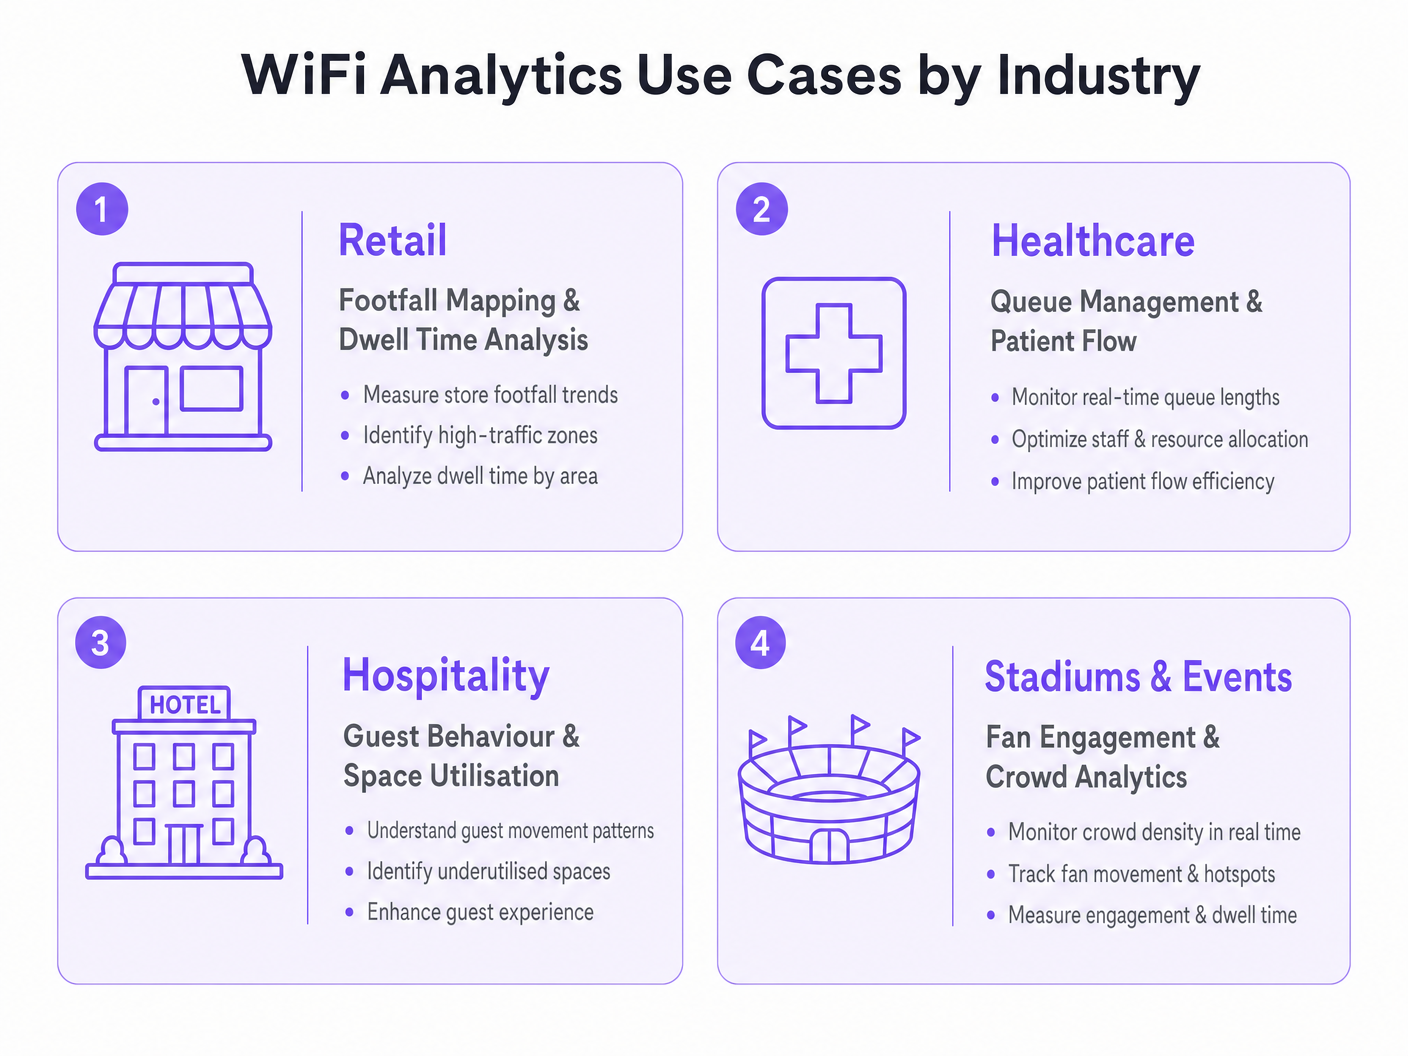
| Retail | Footfall mapping and zone optimisation | 8–15% uplift in average transaction value |
| Healthcare | Queue management and patient flow | 20–30% reduction in average wait times |
| Hospitality | Guest behaviour and space utilisation | 12–18% improvement in F&B revenue per guest |
| Transport | Passenger flow and concession optimisation | 10–20% increase in retail concession revenue |
Measure success against a defined baseline established during the pre-deployment site survey. Track your key metrics — footfall, dwell time, return visit rate, authenticated connection rate — on a weekly cadence for the first quarter post-deployment, then monthly thereafter. Correlate analytics data with financial performance metrics to build the ROI narrative for senior stakeholders and justify further investment in the platform.
The investment payback period for a well-executed WiFi analytics deployment typically ranges from 12 to 18 months, with ongoing annual value delivery through continuous operational optimisation and enriched first-party data for marketing and loyalty programmes.
Key Definitions
RSSI (Received Signal Strength Indicator)
A measurement of the power level of a received radio signal, expressed in decibels relative to one milliwatt (dBm). In WiFi analytics, RSSI values from multiple access points are used to triangulate the approximate location of a client device.
IT teams encounter RSSI when configuring location analytics engines and when troubleshooting inaccurate positioning data. A higher RSSI (closer to 0 dBm) indicates a stronger signal and more reliable location data.
Probe Request
A management frame broadcast by a WiFi-enabled device to discover available networks. Probe requests are transmitted even when the device is not connected to any network, making them the basis for passive presence analytics.
The foundation of anonymous footfall counting. IT teams should understand that modern devices randomise the MAC address in probe requests, which affects the accuracy of unique visitor counts in presence analytics deployments.
MAC Address Randomisation
A privacy feature implemented in modern mobile operating systems (iOS 14+, Android 10+) that causes devices to use randomised MAC addresses in probe requests and, in some configurations, when connecting to networks. This prevents persistent tracking of devices across time and locations.
The primary technical challenge for WiFi analytics deployments relying on passive presence data. Mitigation requires incentivising active authentication through the captive portal, where the authenticated session provides a stable identifier.
Captive Portal
A web page presented to users when they connect to a public or guest WiFi network, requiring authentication or acceptance of terms before granting internet access. In WiFi analytics deployments, the captive portal is the primary mechanism for collecting authenticated user data and consent.
The design and performance of the captive portal directly determines the authentication rate, which is the key driver of analytics data quality. IT teams should treat captive portal optimisation as a continuous improvement activity.
Trilateration
A geometric technique for determining the position of a point by measuring its distance from three or more known reference points. In WiFi analytics, trilateration uses RSSI values from multiple access points to estimate device location on a floor plan.
The core algorithm behind WiFi-based indoor positioning. IT teams should understand that trilateration accuracy degrades with fewer than three reference APs, with significant RF interference, or in environments with complex physical layouts.
Dwell Time
The duration a device (and by proxy, a person) remains within a defined zone or venue. Dwell time is a key metric in WiFi analytics, used to measure customer engagement with specific areas of a retail store, waiting times in healthcare settings, or fan engagement in stadium concourse areas.
One of the most commercially actionable metrics in WiFi analytics. High dwell time in a retail zone correlates with purchase intent; low dwell time in a hospitality venue may indicate a poor customer experience. Used alongside footfall data to calculate zone efficiency.
Presence Analytics
The analysis of WiFi probe request data to determine the number of devices (and by proxy, people) present in a venue or zone, without requiring active network connection. Provides passive footfall counting and dwell time measurement.
The entry-level capability of most WiFi analytics platforms. Useful for broad traffic trend analysis but subject to distortion from MAC randomisation. IT teams should use presence analytics for directional insights and authenticated analytics for precise, demographically segmented data.
OpenRoaming
A Wireless Broadband Alliance (WBA) standard that enables seamless, automatic WiFi authentication across participating networks using identity credentials from trusted providers (mobile operators, social identity providers). Eliminates the need for manual captive portal interaction for participating users.
Increasingly relevant for enterprise deployments seeking to maximise authenticated connection rates without increasing portal friction. Purple supports OpenRoaming as an authentication method, enabling venues to capture analytics data from roaming users who would otherwise bypass the captive portal.
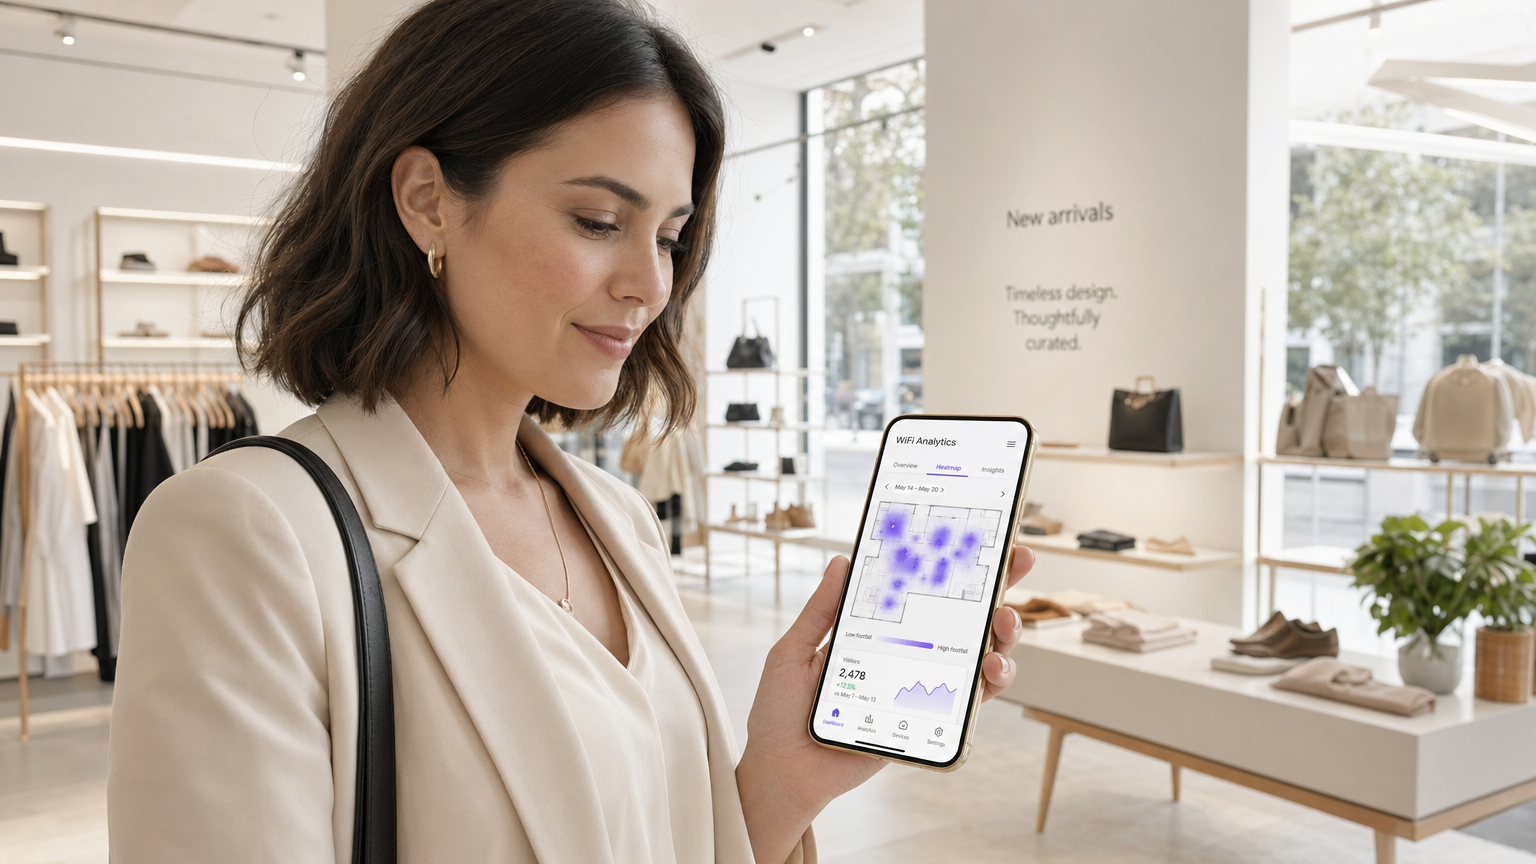
Heat Map
A data visualisation technique that uses colour gradients to represent the density or intensity of a variable across a geographic area. In WiFi analytics, heat maps display footfall density or dwell time intensity across a venue floor plan, enabling rapid identification of high-traffic and low-traffic zones.
The most commonly used visualisation in WiFi analytics dashboards. IT teams and operations directors use heat maps to communicate spatial insights to non-technical stakeholders and to inform decisions about store layout, staffing allocation, and facility management.
Worked Examples
A UK fashion retailer with 12 stores notices that conversion rates are declining despite stable footfall. Store managers report that customers seem to browse the front of the store but rarely reach the back sections where higher-margin products are displayed. How should the IT and operations teams deploy WiFi analytics to diagnose and address this problem?
Deploy Purple's WiFi Analytics platform across all 12 stores, ensuring sufficient AP density (minimum 3 APs per zone) to support zone-level location tracking. Configure floor plan maps for each store within the analytics platform, defining zones that correspond to product categories and store sections. Run a 4-week baseline data collection period to establish footfall heat maps, dwell times by zone, and customer journey paths. Analyse the data to identify the specific point in the store layout where customer flow drops off. Cross-reference with point-of-sale data to identify which zones correlate with higher transaction values. Use the insights to inform a store layout redesign — repositioning high-margin categories into high-traffic zones identified by the heat maps. Implement a captive portal offering a loyalty discount to incentivise authentication, enabling demographic segmentation of the analytics data. Re-measure after the layout change to quantify the uplift.
An NHS trust is experiencing patient satisfaction issues related to waiting times in its outpatient departments. The operations director wants to use WiFi analytics to gain real-time visibility into patient flow and queue lengths. What are the technical and compliance considerations for this deployment?
Deploy WiFi analytics across the outpatient department, mapping waiting areas, consultation rooms, and corridors as distinct zones. Configure real-time alerting within the analytics platform to trigger notifications to the operations team when queue lengths in specific waiting areas exceed defined thresholds (e.g., more than 15 devices detected in a waiting zone for more than 30 minutes). Integrate the analytics platform with the existing patient management system via API to correlate WiFi presence data with appointment schedules. For compliance, conduct a DPIA before deployment, as patient location data in a healthcare setting is particularly sensitive. Implement strict data anonymisation — ensure that WiFi analytics data cannot be linked back to individual patient records. Use presence analytics (unassociated probe requests) for queue monitoring rather than authenticated analytics, minimising the personal data collected. Provide clear signage in waiting areas informing patients that WiFi analytics are in use for service improvement purposes.
Practice Questions
Q1. A 500-bed hospital trust wants to deploy WiFi analytics to monitor patient flow through its A&E department. The CISO raises concerns about GDPR compliance, specifically whether location tracking of patients constitutes processing of sensitive personal data. How do you structure the deployment to achieve the operational objective while satisfying the compliance requirement?
Hint: Consider whether the operational objective (queue monitoring) requires authenticated personal data, or whether anonymous presence analytics would be sufficient. Think about the distinction between presence analytics and authenticated analytics in the context of GDPR's data minimisation principle.
View model answer
Structure the deployment using presence analytics only for queue monitoring — unassociated probe request data provides sufficient signal for counting devices in waiting zones and measuring dwell times without requiring authentication or the collection of personal data. Implement strict data anonymisation: hash all MAC addresses before storage, apply a rolling anonymisation window of no more than 24 hours, and ensure the analytics platform cannot link WiFi data to patient records. Provide clear signage in the A&E department informing visitors that anonymous WiFi analytics are in use for service improvement. Conduct a DPIA documenting the data minimisation approach and the technical controls in place. This approach achieves the operational objective — real-time queue visibility and dwell time monitoring — while processing no personal data, thereby avoiding the GDPR compliance risk entirely.
Q2. A retail chain deploys WiFi analytics across 20 stores and finds that the footfall counts from the analytics platform are consistently 40% higher than manual door counter readings. What are the most likely causes and how do you diagnose and resolve the discrepancy?
Hint: Think about the sources of overcounting in presence analytics. Consider the impact of MAC randomisation, the behaviour of devices in adjacent areas (car parks, neighbouring stores), and the configuration of the detection zone boundaries.
View model answer
The most likely causes of overcounting are: (1) MAC randomisation causing individual devices to be counted multiple times as their MAC address changes; (2) probe requests from devices outside the store perimeter being detected by APs near windows or entrances — devices in the car park or on the street are being included in the count; (3) staff devices being included in the footfall count. Diagnose by comparing the analytics data against manual counts at specific time windows and correlating with known variables (e.g., is the discrepancy consistent across all stores or concentrated in stores with large car parks?). Resolution: configure detection zone boundaries to exclude the perimeter area, implement a minimum dwell time threshold (e.g., only count devices detected for more than 2 minutes) to filter out pass-by devices, exclude known staff MAC addresses or implement a staff device exclusion list, and use authenticated session data as a cross-validation source. Accept that presence analytics will always produce higher counts than door counters due to multi-device households and use the data for trend analysis rather than absolute counts.
Q3. A stadium operator wants to use WiFi analytics to improve the fan experience during match days, specifically to reduce queuing at concession stands and to enable targeted push notifications to fans in specific zones. The IT team has a Wi-Fi 6 network with 200 APs deployed across the venue. What additional configuration and integrations are required to deliver both use cases?
Hint: Consider the different data requirements for the two use cases: queue monitoring is an operational use case that can use presence analytics, while targeted push notifications require authenticated user profiles with location data and a notification delivery mechanism.
View model answer
For queue monitoring at concession stands: configure zone-level presence analytics for each concession area, set up real-time alerting when device counts in a zone exceed a defined threshold, and integrate the alerts with the stadium operations centre dashboard. This use case can be delivered using presence analytics alone and does not require user authentication. For targeted push notifications: deploy a captive portal on the stadium WiFi with a compelling authentication offer (e.g., match day loyalty points, exclusive content). Integrate the WiFi analytics platform with the stadium's CRM and mobile app via API. Configure zone-level location tracking to identify which fans are in which areas of the stadium. Use the analytics platform's segmentation capability to create audience segments based on location (e.g., fans in the East Stand concourse) and trigger push notifications via the mobile app integration. Ensure the captive portal consent capture explicitly covers location-based marketing communications, and provide fans with a clear opt-out mechanism. Test the notification latency — from zone detection to notification delivery — to ensure it is under 60 seconds for time-sensitive offers.
Continue reading in this series
Privacy by Design: Anonymizing WiFi Data for GDPR Compliance
This authoritative guide details the technical architecture and implementation strategies for anonymising WiFi data to ensure GDPR compliance. It provides IT leaders and network architects with actionable frameworks for balancing robust venue analytics with strict data privacy requirements.
Privacy by Design: Anonymising WiFi Data for GDPR Compliance
This authoritative guide details the technical architecture and implementation strategies for anonymising WiFi data to ensure GDPR compliance. It provides IT leaders and network architects with actionable frameworks for balancing robust venue analytics with strict data privacy requirements.
Heatmapping vs Presence Analytics: Technical Differences
This authoritative technical guide details the critical architectural and operational differences between WiFi heatmapping and presence analytics for enterprise venue operators. It provides IT leaders, network architects, and operations directors with actionable deployment frameworks, real-world implementation scenarios, and vendor-neutral best practices for extracting maximum ROI from their existing wireless infrastructure.