How to Calculate Dwell Time Using WiFi Location Analytics
This guide provides a comprehensive technical reference for calculating wifi dwell time using WiFi location analytics, covering the full architecture from 802.11 probe request capture through RSSI-based trilateration to geofenced zone analysis. It is designed for IT managers, network architects, and venue operations directors who need to deploy accurate, scalable location intelligence across retail, hospitality, healthcare, and public-sector environments. Readers will gain actionable implementation guidance, real-world case studies, and a clear framework for translating raw spatial data into measurable business outcomes.
Listen to this guide
View podcast transcript
Executive Summary
For enterprise venues — from expansive retail floors to sprawling stadiums — understanding visitor behaviour is no longer a marketing luxury; it is a critical operational requirement. Wifi dwell time, the duration a device remains within a defined physical zone, serves as the foundational metric for measuring spatial engagement. However, accurately calculating dwell time using existing wireless infrastructure requires navigating complex RF environments, MAC randomization, and varying device probe frequencies.
This guide provides senior IT professionals, network architects, and operations directors with a definitive technical reference on how to calculate dwell time using WiFi location analytics. We explore the mechanics of device detection, the role of Received Signal Strength Indicator (RSSI) and trilateration, and how platforms like Purple translate raw probe requests into actionable business intelligence. By leveraging your existing Guest WiFi infrastructure, organisations can deploy scalable analytics without costly overlay hardware networks. The ROI case is compelling: venues that implement location analytics consistently report measurable improvements in conversion rates, operational efficiency, and customer satisfaction.
Technical Deep-Dive: The Mechanics of Dwell Time
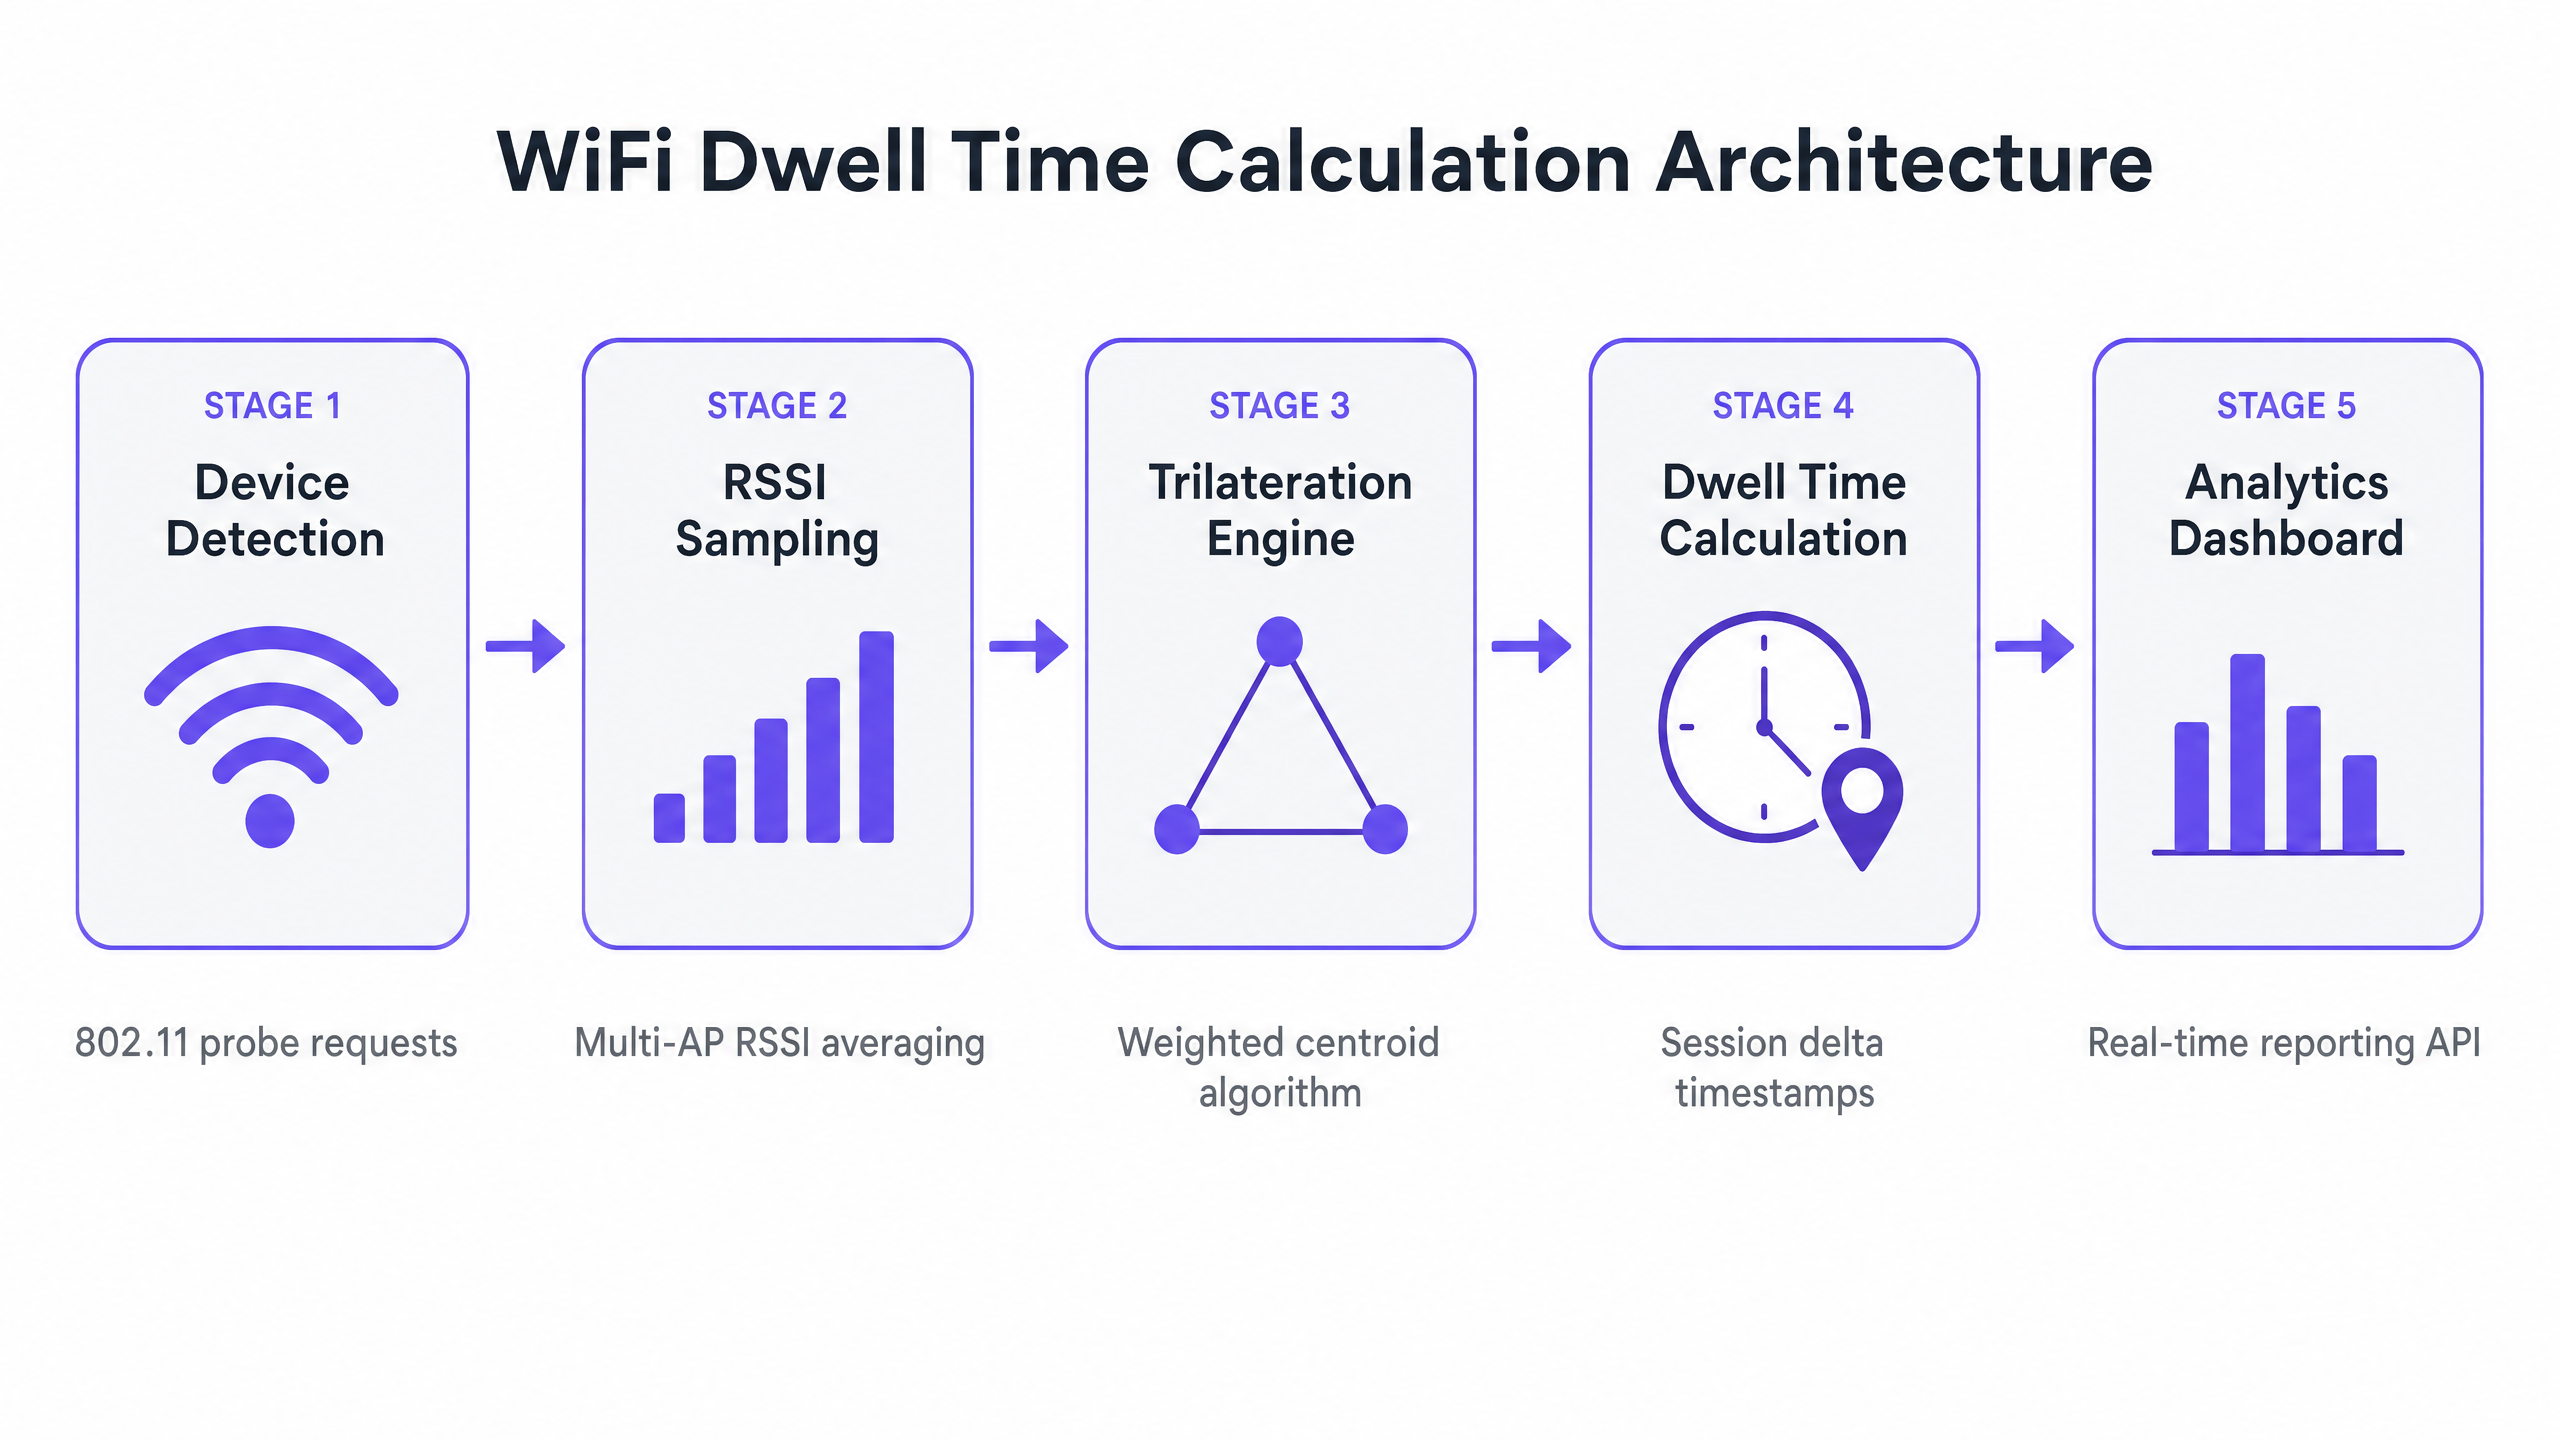
Calculating dwell time is fundamentally a problem of spatial and temporal resolution. It requires identifying a device, estimating its position, and tracking that position continuously over time. Each of these three stages introduces its own technical challenges, and a robust solution must address all of them.
1. Device Detection and Identification
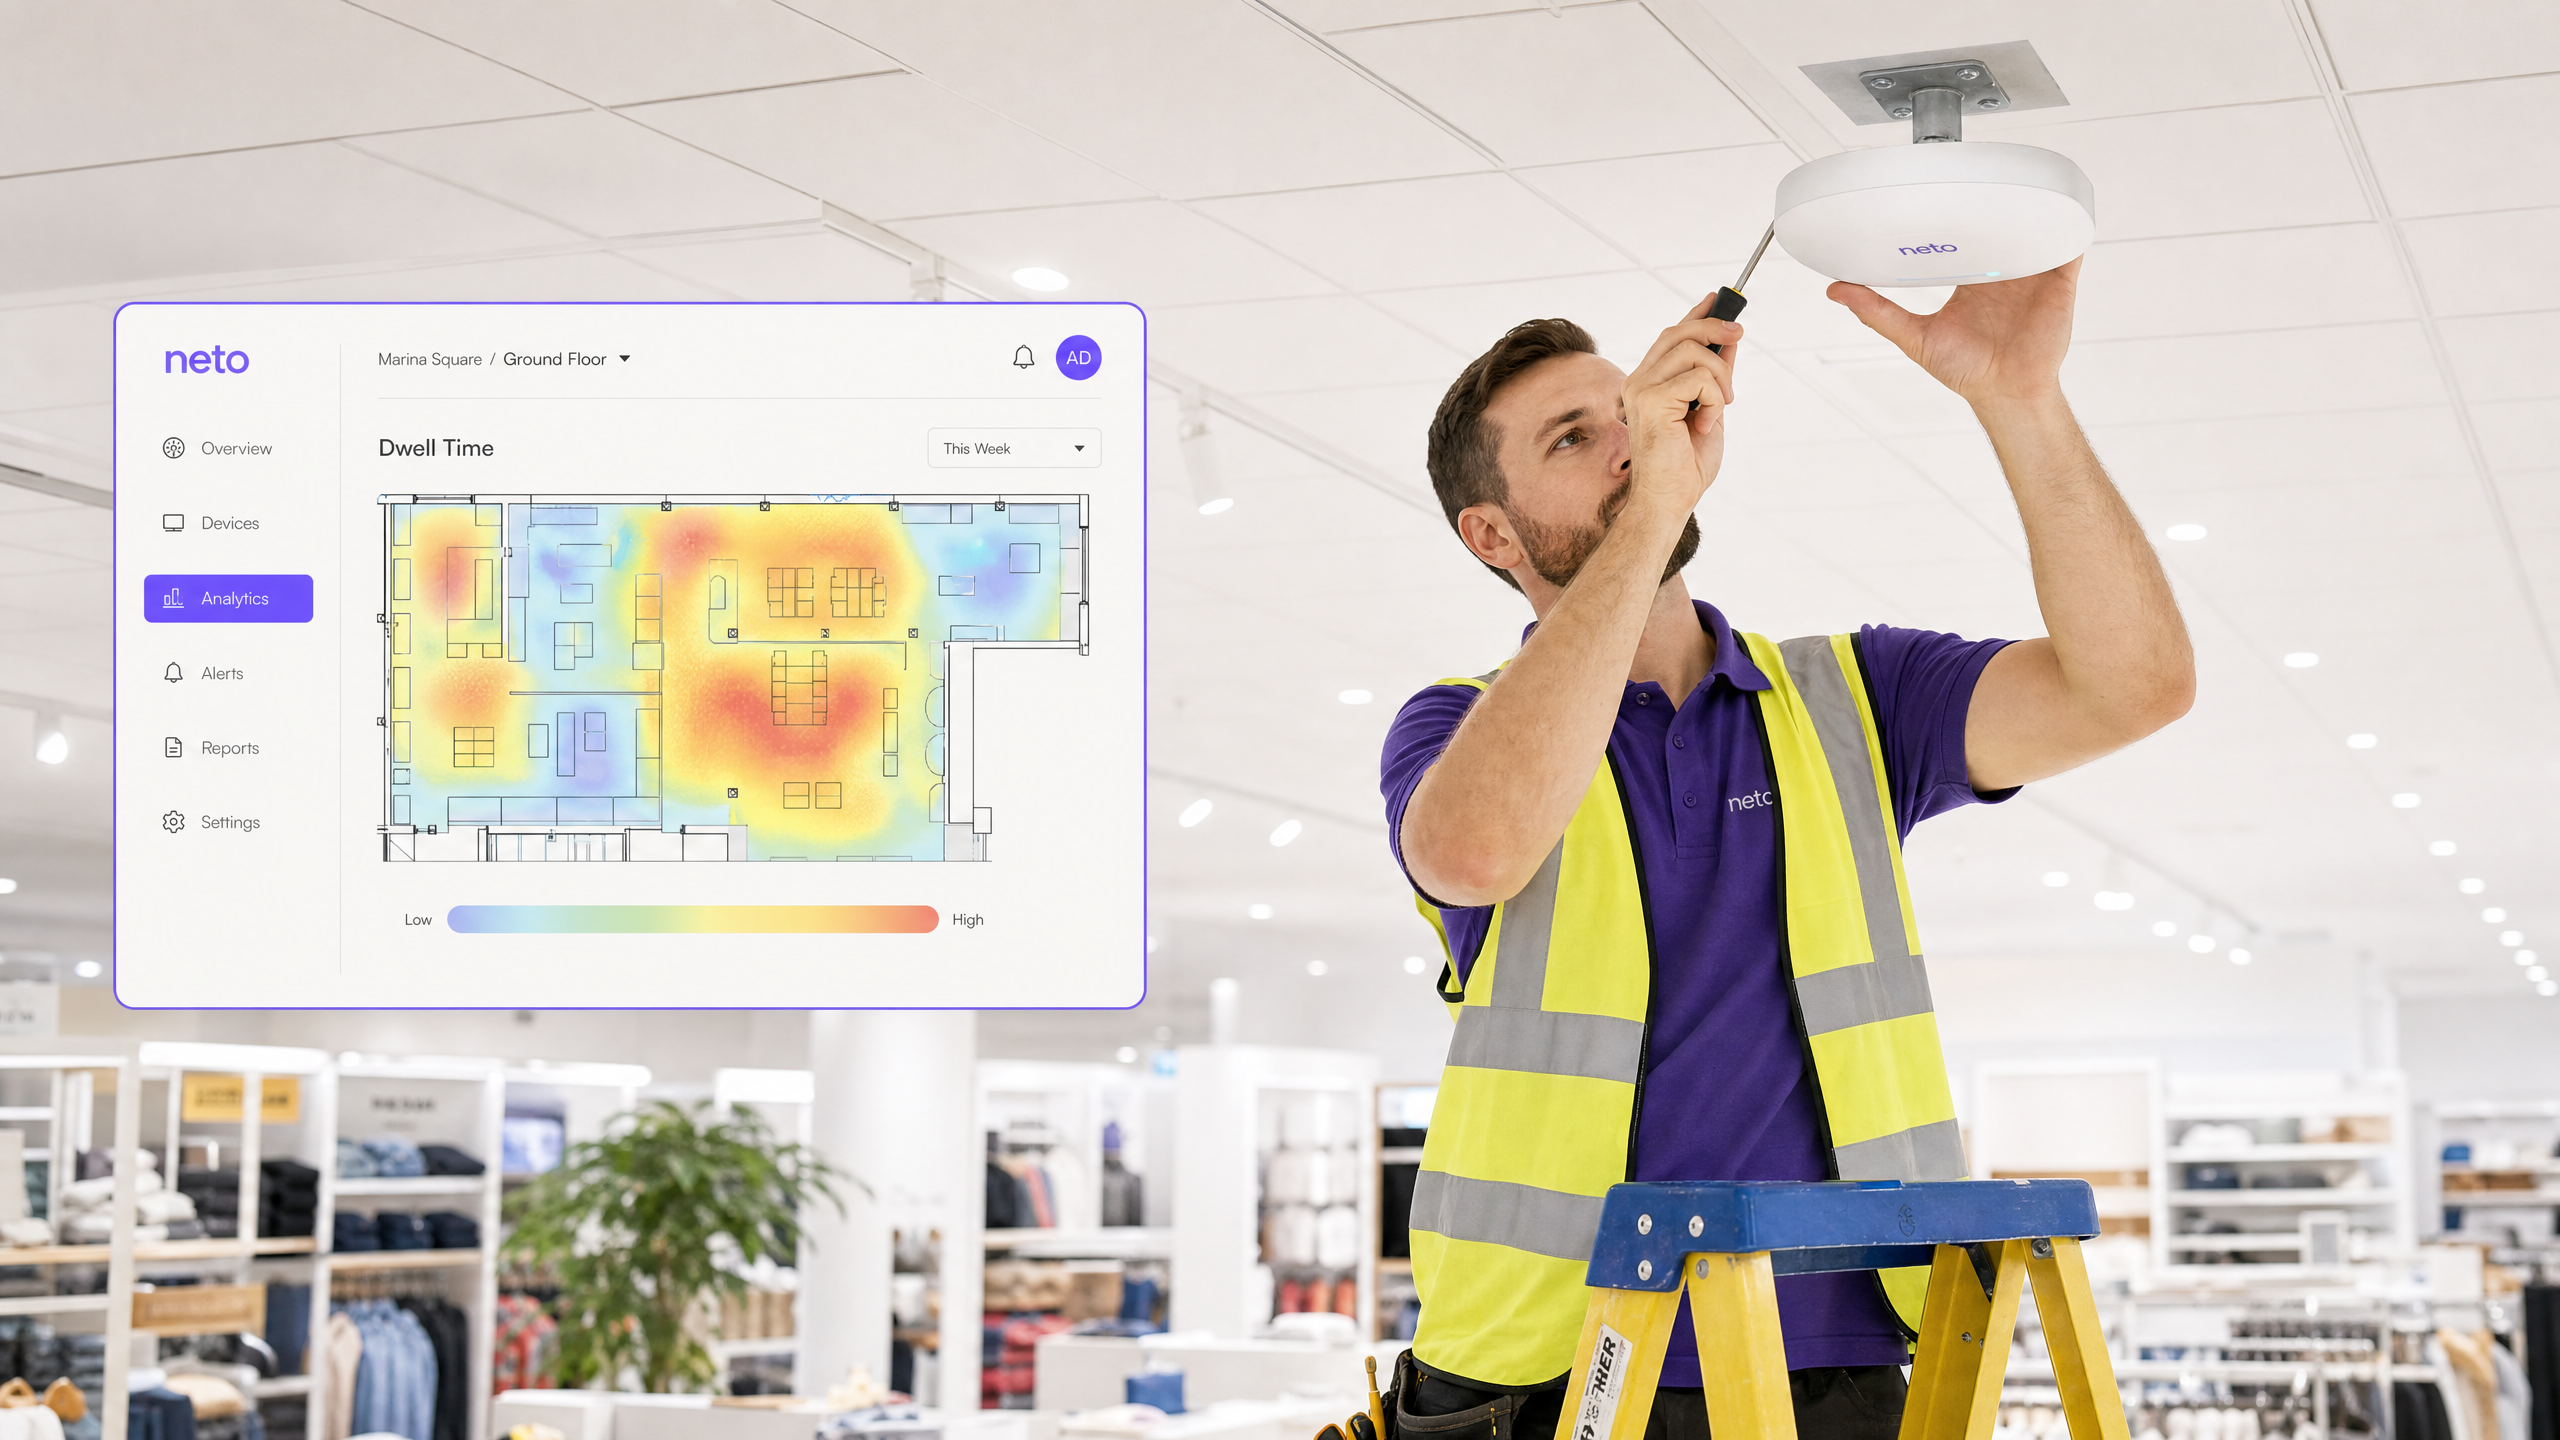
The process begins with the passive detection of 802.11 probe requests. Mobile devices continuously broadcast these management frames to discover available wireless networks. Access Points (APs) acting as sensors capture these frames, which contain the device's MAC address, a timestamp, and the signal strength at the receiving AP (RSSI).
Historically, the MAC address provided a persistent, hardware-level identifier. However, modern mobile operating systems — iOS 14+, Android 10+, and Windows 10+ — implement MAC randomization to enhance user privacy. When a device is not associated with a network, it uses a temporary, randomized MAC address that rotates periodically. This directly challenges passive dwell time calculation, as a single physical device may appear as multiple unique visitors over a session.
To maintain session continuity for accurate dwell time calculation, analytics platforms must employ one of two strategies. The first is heuristic fingerprinting, which involves analysing the Information Elements (IEs) within the probe request frame — such as supported data rates, channel lists, and vendor-specific fields — to probabilistically link probe requests from the same device even when the MAC address changes. The second, and far more reliable approach, is to rely on authenticated sessions. When a user explicitly connects to the Guest WiFi network, the platform receives the device's true hardware MAC address and can tie it to a persistent user profile. This deterministic identification is the gold standard for accurate, long-term dwell metrics.
2. Spatial Estimation: RSSI and Trilateration
Once a device is detected, the system must determine its physical location. The most widely deployed approach utilises RSSI-based trilateration, a technique explained in depth in the guide The Mechanics of WiFi Wayfinding: Trilateration and RSSI Explained .
The principle is straightforward: RSSI decays predictably with distance according to the Free-Space Path Loss (FSPL) model. By measuring the signal strength at multiple APs, the system can estimate the distance from the device to each AP. When three or more APs detect the same probe request, the analytics engine can calculate the device's position by finding the intersection of circles (or spheres in a 3D multi-floor environment) whose radii correspond to the estimated distances from each AP.
In practice, RF environments are far from the idealised free-space model. Multipath fading, caused by signal reflections off walls, metal shelving, and human bodies, introduces significant RSSI variance. To mitigate this, production-grade analytics engines apply several techniques:
| Technique | Purpose | Typical Gain |
|---|---|---|
| Weighted Centroid Algorithm | Assigns higher weight to APs with stronger RSSI readings | Reduces position error by 15–30% |
| Kalman Filtering | Smooths location estimates over time to remove transient noise | Reduces jitter in real-time tracking |
| Fingerprint Mapping | Pre-maps RSSI signatures at known locations for calibration | Improves accuracy in complex RF environments |
| Multi-AP Averaging | Averages RSSI across multiple sample intervals | Reduces impact of momentary interference |
For reliable trilateration, the Rule of Three applies: a device must be heard by at least three APs simultaneously at a signal strength of -75 dBm or better. Networks designed purely for coverage — where a single AP provides a signal across a large area — will not support accurate location analytics. This is a critical architectural distinction that must be addressed before deployment.
3. Temporal Calculation: Defining and Computing Dwell
With a stream of location coordinates, the analytics engine maps device positions against geofenced zones defined within the platform. A geofence is a virtual polygon drawn over a floor plan, representing a meaningful physical area such as a checkout queue, a promotional display, or a hotel lobby.
Dwell time is not simply the delta between the first and last observed timestamps. A robust calculation must account for device sleep cycles, brief zone departures, and the inherent noise in location estimates. The standard calculation logic defines three key parameters:
Entry Event: The device's estimated position enters a defined geofenced zone and remains within it for a minimum period — the Dwell Threshold — to filter out passersby. A common threshold for retail environments is 30 seconds; for healthcare waiting areas, 60 seconds may be more appropriate.
Exit Event: The device's position moves outside the zone boundary, or the device is not detected by any AP for a defined Timeout Period (typically 3–5 minutes). The timeout handles devices that enter sleep mode or are placed in a bag, preventing premature session termination.
Dwell Duration: The delta between the Entry Event timestamp and the Exit Event timestamp, minus any timeout buffer. This is the metric reported to the WiFi Analytics dashboard.
Implementation Guide
Deploying a robust WiFi location analytics solution requires careful planning and alignment between network architecture and business objectives. The following steps represent a vendor-neutral deployment framework applicable to any enterprise WLAN environment.
Step 1: Infrastructure Assessment and Densification
Conduct a thorough RF site survey to evaluate your existing WLAN deployment against location-service requirements. The key question is whether your current AP placement supports the Rule of Three across all target zones. Use a tool such as Ekahau or iBwave to model AP coverage and identify gaps. If your network was designed solely for throughput and coverage, you will almost certainly need to densify the deployment, particularly in high-value zones. Budget for additional APs and cabling as part of the project scope.
Step 2: Zone Definition and Geofencing
Map your physical space into logical zones within the analytics platform. Import your floor plans and define geofenced areas that align with your business questions. In a Retail environment, typical zones include the entrance, specific product categories, promotional areas, and the checkout. In a Hospitality setting, relevant zones might include the lobby, restaurant, bar, conference suites, and pool area. Ensure zones are sized appropriately — a minimum of 20–30 square metres is a practical lower bound for WiFi-based location analytics.
Step 3: Controller Integration and Data Pipeline
Integrate your wireless controller (Cisco, Aruba, Meraki, Ruckus, or equivalent) with the analytics platform. This typically involves configuring the controller to forward RTLS (Real-Time Location System) data streams or location API updates to the analytics engine. Ensure the data pipeline is configured for near real-time delivery — latency above 30 seconds will degrade the quality of live operational dashboards. All data transmission must be encrypted in transit (TLS 1.2 minimum) and comply with GDPR and any applicable data protection regulations.
Step 4: Threshold Configuration and Baseline Establishment
Configure Dwell Thresholds and Timeout Periods for each zone based on the expected behaviour in that area. Run the system for a minimum of four to six weeks before drawing conclusions, to establish a statistically robust baseline. This baseline is essential for identifying meaningful deviations — a sudden drop in dwell time at a promotional display, for example, may indicate a merchandising issue or a staffing gap.
Best Practices
The following recommendations reflect industry-standard approaches to deploying WiFi location analytics at scale.
Calibrate the RF Environment Regularly. The physical environment of a venue changes continuously — new displays, seasonal inventory, crowd density all alter RF propagation. A site survey conducted at deployment will not remain accurate six months later. Build a quarterly calibration cadence into your operational schedule, and recalibrate immediately following any significant physical change to the space.
Segment Passive and Authenticated Analytics. Educate stakeholders on the distinction between passive analytics (unauthenticated devices, subject to MAC randomization) and authenticated analytics (users who have logged into the Guest WiFi). Passive data provides reliable trend data at scale; authenticated data provides deterministic, individual-level tracking. Use passive data for macro-level footfall and zone popularity analysis, and authenticated data for conversion attribution and personalised engagement.
Correlate with Operational Data. Dwell time in isolation is a metric, not an insight. The value is unlocked when spatial data is correlated with Point of Sale (PoS) data, staffing schedules, or service delivery records. A high dwell time at a checkout queue, for instance, is only actionable when correlated with transaction volumes and staffing levels. This correlation is the foundation of the ROI case for location analytics investment.
Align with Privacy and Compliance Requirements. Ensure your deployment complies with GDPR (in the UK and EU), and any sector-specific regulations relevant to your industry. In Healthcare environments, patient location data may be subject to additional data protection requirements. Implement data minimisation principles — collect only what is necessary, anonymise where possible, and define clear data retention policies.
Troubleshooting and Risk Mitigation
The following table summarises the most common failure modes in WiFi dwell time deployments and the recommended remediation steps.
| Failure Mode | Likely Cause | Remediation |
|---|---|---|
| Inflated visitor counts, short dwell times | MAC randomization on unauthenticated devices | Drive Guest WiFi authentication; use heuristic fingerprinting for passive data |
| Erratic location data (devices jumping between zones) | Insufficient AP density or multipath fading | Densify APs; tune smoothing algorithms; recalibrate RF model |
| Zones capturing passersby | Dwell Threshold set too low | Increase minimum dwell threshold for the affected zone |
| Checkout zone capturing entrance traffic | Overlapping or oversized zone definitions | Tighten geofence boundaries; ensure zones do not overlap |
| Stale or delayed dashboard data | Data pipeline latency or API rate limiting | Review controller integration; increase API polling frequency |
| Poor accuracy in multi-floor environments | 2D trilateration applied to 3D space | Implement floor-level discrimination using AP elevation data |
ROI and Business Impact
Implementing WiFi location analytics transforms physical spaces into measurable, optimisable environments. The business case operates across three dimensions: revenue generation, operational efficiency, and customer experience.
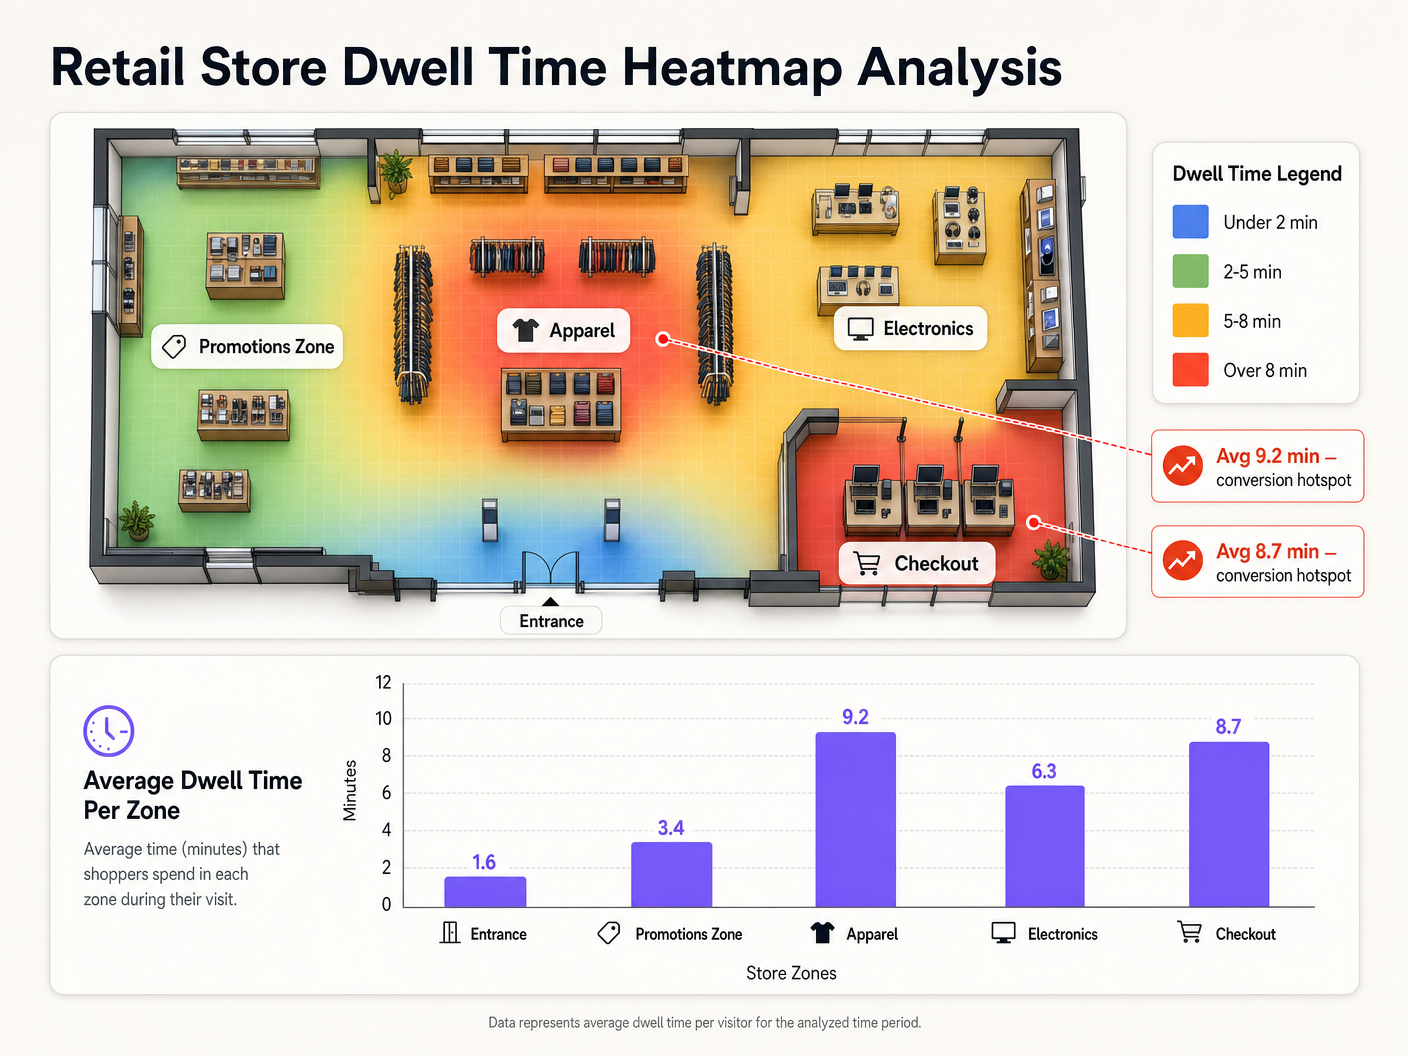
On the revenue side, dwell time data enables evidence-based merchandising decisions. Knowing that a specific end-cap display generates an average dwell time of 9.2 minutes — versus 1.6 minutes at the entrance — allows category managers to prioritise high-margin products in high-engagement zones. For Transport operators, understanding dwell patterns in retail concessions directly informs tenancy negotiations and revenue share agreements.
On the operational side, real-time dwell analytics enable dynamic staffing. A queue management system that triggers a staff alert when checkout dwell time exceeds a defined threshold can reduce wait times without the cost of permanent overstaffing. This directly contributes to improved customer satisfaction — a topic explored in depth in How To Improve Guest Satisfaction: The Ultimate Playbook .
On the experience side, location intelligence enables contextually relevant engagement. When integrated with Purple's WiFi Analytics platform, dwell data can trigger personalised notifications — a discount offer delivered to a customer who has spent more than five minutes in the footwear section, for example. This capability is increasingly relevant as venues explore passwordless access models that reduce authentication friction while maintaining data quality.
For public-sector organisations and smart city initiatives, dwell analytics provide the evidence base for infrastructure investment decisions — understanding how citizens use public spaces, transport hubs, and civic buildings. Purple's expanding public-sector capability, as highlighted in the appointment of Iain Fox as VP Growth for Public Sector , reflects the growing demand for this type of spatial intelligence in government and municipal environments.
The total cost of ownership for a WiFi location analytics deployment is typically low relative to the operational value generated, particularly where the analytics layer is deployed over an existing WLAN infrastructure. The marginal cost is primarily the analytics platform licence and the engineering time required for integration and calibration — not a greenfield hardware investment.
Key Definitions
Wifi Dwell Time
The measured duration a WiFi-enabled device remains within a defined physical zone, calculated from the delta between an entry event and an exit event as detected by the wireless infrastructure.
The primary metric for spatial engagement analytics. Used by retail operators, venue managers, and healthcare administrators to understand how people use physical spaces.
Received Signal Strength Indicator (RSSI)
A measurement of the power level of a received radio signal, expressed in decibels relative to one milliwatt (dBm). Values typically range from 0 dBm (maximum signal) to -100 dBm (minimum detectable signal).
The raw input for distance estimation in WiFi location analytics. RSSI of -75 dBm or better at three or more APs is the minimum requirement for reliable trilateration.
Trilateration
A mathematical technique for determining the position of a point by measuring its distance from three or more known reference points. In WiFi analytics, the reference points are Access Points and the distances are estimated from RSSI readings.
The core positioning algorithm used by WiFi location analytics platforms. Distinct from triangulation, which uses angles rather than distances.
MAC Randomization
A privacy feature implemented in modern mobile operating systems (iOS 14+, Android 10+) where a device uses a temporary, randomized MAC address when probing for networks, rather than its permanent hardware address.
The primary technical challenge for passive WiFi analytics. Causes a single physical device to appear as multiple unique visitors, inflating footfall counts and fragmenting dwell time sessions. Mitigated by encouraging Guest WiFi authentication.
Geofencing
The creation of a virtual geographic boundary — defined as a polygon on a floor plan — that triggers analytical events (entry, exit, dwell) when a tracked device crosses the boundary.
Used within the analytics dashboard to define specific areas for localized dwell time measurement. Zone size and placement are critical configuration decisions that directly impact data quality.
Dwell Threshold
The minimum duration a device must remain within a geofenced zone before the analytics platform registers an entry event and begins counting dwell time.
Essential for data quality. A threshold that is too low will count passersby as dwellers; a threshold that is too high will miss genuine short-duration engagements. Must be tuned per zone based on expected behaviour.
Multipath Fading
A phenomenon where a radio signal reaches a receiving antenna via two or more paths — direct line-of-sight and one or more reflected paths — causing constructive or destructive interference that distorts the received signal strength.
The primary source of RSSI inaccuracy in complex indoor environments such as warehouses, retail stores, and hospitals. Mitigated through AP densification, smoothing algorithms, and RF fingerprinting.
Probe Request
An 802.11 management frame broadcast by a client device to discover available wireless networks. Contains the device's MAC address (which may be randomized), supported data rates, and other capability information.
The fundamental data packet captured by APs to detect the presence of devices in a venue. The raw input for all passive WiFi location analytics.
Deterministic Identification
The ability to identify a specific device or user with certainty, typically achieved through an authentication event where the device's true hardware MAC address is revealed to the network.
Achieved when a user authenticates to the Guest WiFi network. Enables accurate long-term dwell tracking that is immune to MAC randomization, and allows spatial data to be tied to a known user profile for conversion attribution.
Free-Space Path Loss (FSPL)
The attenuation of radio signal strength that occurs as the signal propagates through free space, increasing with distance and frequency according to a logarithmic model.
The theoretical basis for RSSI-to-distance conversion in trilateration. Real-world environments deviate significantly from the FSPL model due to obstacles and reflections, which is why calibration and smoothing algorithms are essential.
Worked Examples
A national retail chain with 150 stores wants to measure the effectiveness of a new end-cap promotional display. The marketing team needs to know how long shoppers are stopping at the display, and whether high dwell time correlates with increased sales of the promoted SKU.
Step 1 — Zone Creation: Define a tight geofence (approximately 4m x 3m) around the end-cap display within the Purple analytics dashboard, distinct from the broader aisle zone. Step 2 — Threshold Configuration: Set a minimum dwell threshold of 20 seconds to filter out customers simply walking past the aisle end. Step 3 — Baseline Period: Run the analytics for two weeks before the promotion launches to establish a baseline dwell time for that zone. Step 4 — Promotion Period Measurement: Activate the promotion and monitor dwell time daily. Export the dwell time data via the analytics API. Step 5 — Correlation: Join the dwell time dataset with PoS transaction data for the promoted SKU, segmented by time of day and day of week. Calculate the Pearson correlation coefficient between average zone dwell time and hourly SKU sales volume. Step 6 — Reporting: Present the correlation data to the category management team with a recommendation to replicate the display format in high-footfall stores.
A large NHS trust needs to monitor patient wait times in the Emergency Department triage area to ensure compliance with the four-hour SLA target. The IT team has an existing Cisco Meraki deployment but no current analytics capability.
Step 1 — Infrastructure Audit: Conduct an RF site survey of the triage waiting area. Verify that a minimum of three Meraki APs hear devices in all seating areas at -70 dBm or better. The ED environment typically has high RF interference from medical equipment; densify if necessary. Step 2 — Meraki Location API Integration: Enable the Meraki Scanning API on the relevant APs and configure it to POST location data to the Purple analytics platform endpoint at 30-second intervals. Step 3 — Zone Definition: Define the triage waiting area as a distinct zone within Purple. Set the dwell threshold to 60 seconds and the timeout to 10 minutes (to account for patients who may be briefly taken to a side room). Step 4 — Real-Time Alerting: Configure a webhook alert to notify the duty charge nurse via the hospital's operational messaging system (e.g., Microsoft Teams or Vocera) if the average dwell time in the triage zone exceeds 45 minutes. Step 5 — Reporting: Generate weekly dwell time reports segmented by time of day and day of week to identify peak pressure periods for staffing optimisation.
Practice Questions
Q1. You are deploying location analytics in a large warehouse with high metal racking throughout. Initial tests show device locations jumping erratically between aisles, and average dwell times are inconsistent. What is the most likely root cause and what remediation steps would you recommend?
Hint: Consider how the physical structure of the environment affects RF signal propagation, and what this means for the reliability of RSSI-based distance estimation.
View model answer
The erratic location data is caused by severe multipath fading. Metal racking reflects and scatters RF signals, meaning the RSSI values received by APs are heavily distorted by reflected paths rather than representing true line-of-sight distances. This makes the trilateration engine's distance estimates unreliable. Recommended remediation: (1) Densify the AP deployment, positioning APs at the end of each aisle to maximise line-of-sight coverage down the aisle length. (2) Consider directional antennas focused down specific aisles to reduce cross-aisle interference. (3) Implement RF fingerprinting — pre-map RSSI signatures at known grid points throughout the warehouse to create a calibrated location model that accounts for the specific RF characteristics of the environment. (4) Tune the analytics platform's Kalman filter smoothing parameters to reduce the impact of transient RSSI spikes on the location estimate.
Q2. A retail operations director reports that the analytics platform is showing total daily visitor counts that are three times higher than the manual door counter, and average dwell times of under two minutes across all zones. The deployment relies entirely on passive probe request monitoring. What is the architectural issue and how would you resolve it?
Hint: Think about what happens to a device's identifier over the course of a one-hour shopping visit on a modern smartphone.
View model answer
The issue is MAC randomization. Modern smartphones rotate their randomized MAC address periodically — in some cases every few minutes. Because the platform is relying entirely on passive probe requests, each new MAC address is interpreted as a new, unique visitor. A single shopper who spends an hour in the store may generate ten or more unique MAC addresses, each appearing as a separate visitor with a short dwell time. The resolution is twofold: (1) Implement a Guest WiFi authentication flow to drive users onto the network, providing a persistent hardware MAC address and a known user identity. Even a 30–40% authentication rate will significantly improve data quality. (2) For the remaining passive data, implement heuristic fingerprinting to probabilistically link probe requests from the same device based on Information Element patterns, reducing (though not eliminating) the inflation caused by MAC rotation. Communicate clearly to stakeholders that passive visitor counts are trend indicators, not absolute figures.
Q3. You have deployed location analytics in a shopping centre and defined a zone around a specific food court seating area. The data shows that the zone has an unusually high average dwell time of 45 minutes, but the food court operator reports that most customers are only seated for 15–20 minutes. What configuration issue might explain this discrepancy?
Hint: Consider how the analytics platform handles devices that stop sending probe requests while remaining physically present in the zone.
View model answer
The most likely cause is an incorrectly configured Timeout Period. When a customer finishes eating and puts their phone in their pocket or bag, the device may enter a low-power state and stop broadcasting probe requests. If the Timeout Period is set too long — for example, 30 minutes — the platform will continue the dwell session for 30 minutes after the last detected probe, even if the customer has already left. This artificially inflates the reported dwell time. The fix is to reduce the Timeout Period to a value that reflects the typical gap between probe broadcasts in the environment — usually 3–5 minutes is appropriate for a busy public venue. Additionally, review whether the geofence boundary for the food court zone is inadvertently capturing adjacent areas (e.g., a corridor or queue) where customers may linger after leaving the seating area.