Casi d'uso di WiFi Analytics: Come le aziende utilizzano i dati di localizzazione
Questa guida fornisce a responsabili IT, architetti di rete, CTO e direttori delle operazioni di sede un riferimento pratico e autorevole sui casi d'uso di WiFi analytics — illustrando come le aziende nei settori della vendita al dettaglio, della sanità, dell'ospitalità e degli eventi stiano sfruttando i dati di localizzazione dall'infrastruttura wireless esistente per migliorare l'efficienza operativa e il ROI commerciale. Esamina l'architettura tecnica alla base delle piattaforme di intelligenza spaziale, illustra scenari di implementazione reali e fornisce indicazioni sull'implementazione neutrali rispetto ai fornitori, insieme a framework di conformità e mitigazione del rischio. Per qualsiasi organizzazione che gestisce una sede fisica con guest WiFi, questa guida traccia il percorso dalla connettività passiva all'intelligenza aziendale attiva.
Ascolta questa guida
Visualizza trascrizione del podcast
📚 Part of our core series: Marketing & Analytics Platform →
Riepilogo Esecutivo
Per i responsabili IT e i direttori delle operazioni di sede, l'implementazione di una rete wireless robusta non riguarda più solo la fornitura di accesso a internet — è un investimento strategico nell'intelligenza spaziale. Questa guida esplora casi d'uso pratici di WiFi analytics in ambienti aziendali, descrivendo come le organizzazioni sfruttano i dati di localizzazione per ottimizzare le operazioni, migliorare le esperienze dei clienti e generare un ROI misurabile. Trasformando gli access point standard in un motore completo di Guest WiFi e WiFi Analytics , le aziende possono estrarre insight azionabili dalle richieste di sonda dei dispositivi e dai dati di associazione. Dalla mappatura del flusso di visitatori nel retail alla gestione delle code nelle strutture sanitarie, esaminiamo l'architettura tecnica, le strategie di implementazione e i protocolli di mitigazione del rischio necessari per trasformare la connettività in un vantaggio commerciale. Per una panoramica fondamentale della tecnologia, consulta Cos'è WiFi Analytics? Una Guida Completa .
Approfondimento Tecnico
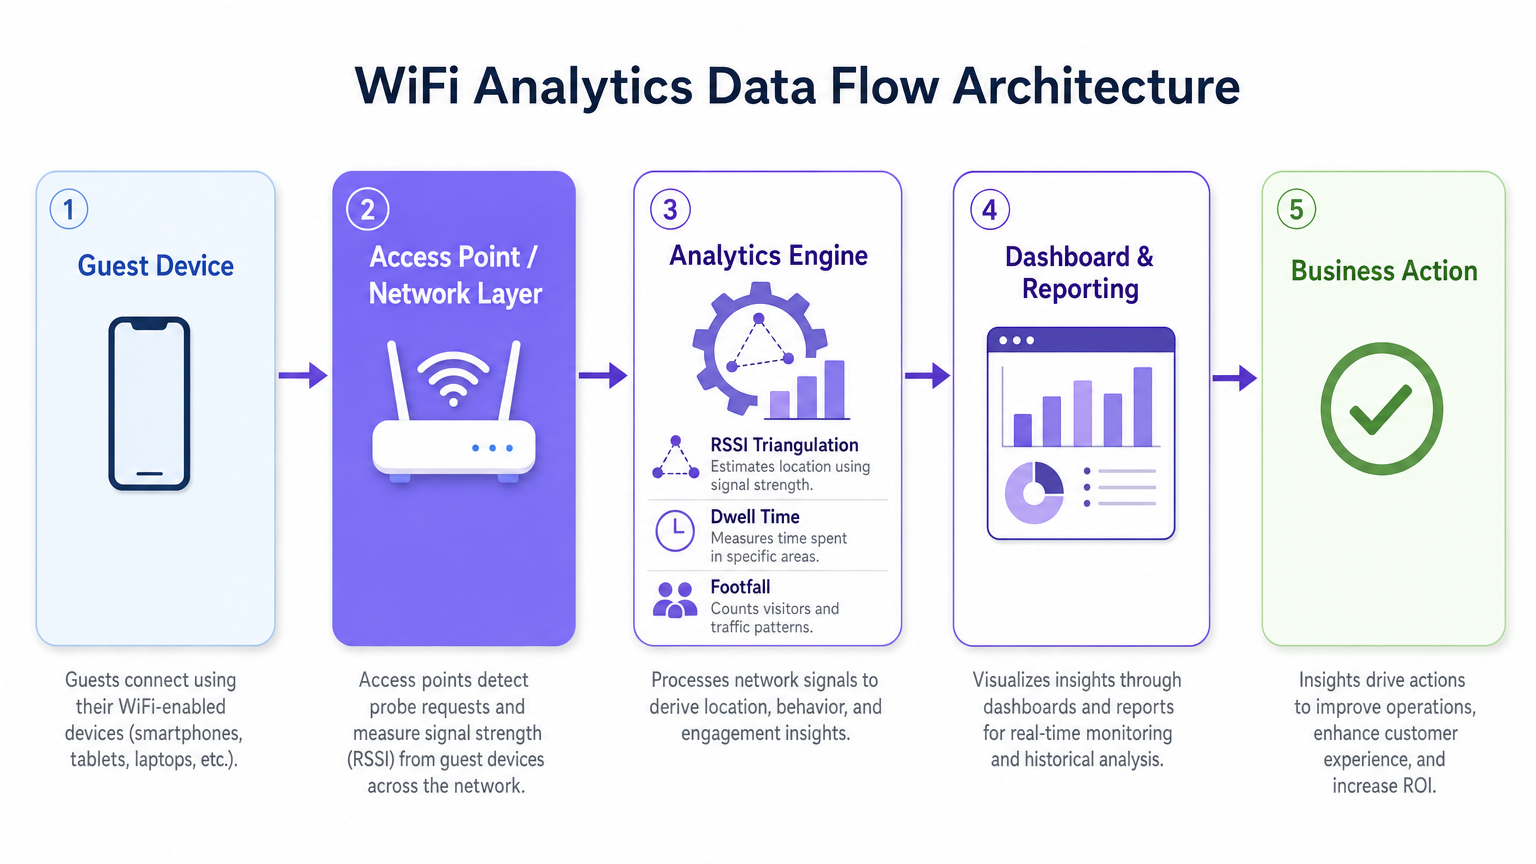
Comprendere le meccaniche di una piattaforma WiFi Analytics richiede l'esame del flusso di dati dal dispositivo client al motore di analisi. Gli access point (AP) moderni rilevano le richieste di sonda non associate trasmesse dagli smartphone che cercano reti conosciute. Aggregando i valori di Received Signal Strength Indicator (RSSI) su più AP, il sistema triangola le posizioni dei dispositivi con una precisione che varia a seconda della densità di implementazione e delle condizioni RF ambientali.
Quando un utente si connette attivamente tramite un captive portal, il motore di analisi collega l'indirizzo MAC a un profilo utente autenticato. Questa transizione dall'analisi della presenza anonima ai dati demografici autenticati è il fondamento dell'intelligenza spaziale aziendale. Piattaforme come la soluzione Guest WiFi di Purple sono specificamente progettate per facilitare questa transizione su larga scala, integrando la gestione del captive portal, la raccolta del consenso e l'analisi in un'unica implementazione.
Meccanismi di Raccolta Dati
I tre meccanismi principali di raccolta dati in un'implementazione di WiFi analytics sono l'analisi della presenza, l'analisi della localizzazione e l'analisi autenticata. L'analisi della presenza utilizza richieste di sonda non associate per contare il flusso di visitatori, misurare i tempi di permanenza e identificare i visitatori di ritorno basandosi su indirizzi MAC hash, fornendo un'ampia visibilità del traffico della sede senza richiedere connessioni attive. L'analisi della localizzazione impiega algoritmi di trilaterazione per mappare il movimento dei dispositivi su una planimetria; implementazioni avanzate possono integrare tecnologie di posizionamento complementari, come dettagliato nella Guida ai Sistemi di Posizionamento Indoor: UWB, BLE e WiFi , per migliorare la precisione oltre le capacità WiFi standard. L'analisi autenticata acquisisce dati demografici e comportamentali quando gli utenti si autenticano tramite il captive portal, integrandosi con sistemi CRM e programmi fedeltà per costruire profili utente completi e longitudinali.
Una considerazione tecnica critica è la randomizzazione dell'indirizzo MAC. I moderni sistemi operativi iOS e Android randomizzano gli indirizzi MAC dei dispositivi per proteggere la privacy degli utenti, il che significa che l'analisi della presenza basata esclusivamente su richieste di sonda non associate sovrastimerà i visitatori unici per periodi prolungati. La strategia di mitigazione consiste nell'incentivare l'autenticazione attiva — tramite offerte accattivanti del captive portal, login social senza interruzioni o integrazione OpenRoaming — in modo che il motore di analisi tracci le sessioni autenticate anziché i MAC randomizzati ed effimeri. Questo collega direttamente la qualità dell'esperienza del tuo portale alla qualità dei tuoi dati analitici.
Architettura e Standard
Un'implementazione di WiFi analytics di livello produttivo segue un'architettura a cinque strati: lo strato del dispositivo client, lo strato dell'access point e della rete (che supporta IEEE 802.11ax / Wi-Fi 6 per ambienti ad alta densità), il motore di analisi che esegue la triangolazione RSSI e il calcolo del tempo di permanenza, lo strato di dashboard e reporting, e lo strato di azione aziendale dove gli insight guidano le decisioni operative. Per le sedi ad alta densità — stadi, centri congressi, grandi superfici commerciali — il Wi-Fi 6 è lo standard minimo raccomandato, introducendo OFDMA e BSS Colouring per gestire connessioni concorrenti senza degrado del throughput.
La conformità a GDPR, CCPA e PCI DSS (dove i dati di pagamento intersecano l'infrastruttura di rete) è non negoziabile. L'hashing degli indirizzi MAC, l'acquisizione esplicita del consenso tramite il captive portal, la minimizzazione dei dati e le politiche di conservazione definite sono requisiti di base per qualsiasi implementazione che gestisce dati personali.
Guida all'Implementazione
L'implementazione di successo di una soluzione WiFi analytics richiede un approccio strutturato alla progettazione della rete, alla selezione dell'hardware e alla configurazione del software.
Fase 1 — Valutazione della Rete e Site Survey. Condurre un'indagine RF completa del sito per valutare la copertura esistente, identificare le fonti di interferenza e determinare il posizionamento ottimale degli AP. Per la precisione dell'analisi della localizzazione, sono necessari almeno tre AP che rilevino contemporaneamente un dato dispositivo. In pratica, ciò significa una spaziatura degli AP di circa 15–20 metri in ambienti aperti-ambienti di pianificazione, con un posizionamento più denso in zone ad alto valore come le aree di cassa al dettaglio o le sale d'attesa degli ospedali.
Fase 2 — Progettazione del Captive Portal e Strategia di Autenticazione. Progettare un Captive Portal che minimizzi l'attrito massimizzando l'acquisizione dei dati. Implementare la profilazione progressiva — raccogliere un set minimo di dati alla prima connessione (indirizzo email e consenso) e arricchire il profilo nelle visite successive. Supportare molteplici metodi di autenticazione: social login (Google, Facebook), registrazione via email e OpenRoaming per utenti in roaming senza interruzioni. Assicurarsi che il portale sia ottimizzato per dispositivi mobili e si carichi entro tre secondi su una connessione 4G.
Fase 3 — Integrazione della Piattaforma di Analytics. Integrare la piattaforma di analytics con gli strumenti di business intelligence esistenti, i sistemi CRM e le piattaforme di marketing automation. La piattaforma WiFi Analytics di Purple offre integrazioni predefinite con le principali piattaforme CRM e di marketing, consentendo ai team interfunzionali di agire su insight spaziali senza richiedere sviluppi personalizzati. Definire i propri indicatori chiave di performance prima del deployment — conteggi di affluenza, tempi di permanenza, tassi di ritorno delle visite, mappe di calore a livello di zona — e configurare i dashboard di conseguenza.
Fase 4 — Conformità e Governance dei Dati. Implementare una Valutazione d'Impatto sulla Protezione dei Dati (DPIA) prima del lancio. Assicurarsi che le informative sulla privacy siano accurate, i meccanismi di consenso espliciti e granulari, e le politiche di conservazione dei dati siano applicate a livello di piattaforma. Nominare un responsabile dei dati incaricato del monitoraggio continuo della conformità.
Migliori Pratiche
Per massimizzare il valore di un investimento in WiFi analytics, attenersi alle seguenti raccomandazioni standard del settore.
Ottimizzare la densità degli AP specificamente per l'analisi della posizione, non solo per la copertura. Una rete progettata per l'accesso internet di base avrà tipicamente una sovrapposizione di AP insufficiente per una trilaterazione affidabile. Condurre un'indagine separata specifica per l'analisi della posizione e regolare il posizionamento degli AP o aggiungere AP supplementari in zone ad alto valore.
Implementare la mitigazione della randomizzazione MAC attraverso un'accattivante progettazione del Captive Portal. Il tasso di connessione — la proporzione di dispositivi rilevati che si autenticano — è la metrica più importante per la qualità dei dati di analytics. Un portale ben progettato con una chiara proposta di valore (WiFi gratuito, punti fedeltà, contenuti esclusivi) raggiunge costantemente tassi di connessione del 40-60% negli ambienti retail e hospitality.
Calibrare regolarmente gli algoritmi di localizzazione. I cambiamenti ambientali — nuove strutture fisiche, esposizioni stagionali di prodotti, densità di folla variabili — influenzano la propagazione RF e possono degradare la precisione della localizzazione nel tempo. Programmare revisioni di calibrazione trimestrali e ricalibrare dopo qualsiasi modifica fisica significativa alla sede.
Integrare i dati di WiFi analytics con altre fonti di dati operativi. Gli insight diventano significativamente più potenti quando correlati con i dati del punto vendita, i programmi del personale e le tempistiche delle campagne di marketing. Questa integrazione interfunzionale è dove il caso ROI diventa convincente per gli stakeholder senior.
Per le organizzazioni che implementano in ambienti automobilistici o di trasporto, la Wi-Fi in Auto: The Complete 2026 Enterprise Guide e Internet of Things Architecture: A Complete Guide forniscono un contesto architettonico rilevante per estendere l'analisi WiFi oltre le impostazioni tradizionali delle sedi.
Risoluzione dei Problemi e Mitigazione del Rischio
Le implementazioni aziendali incontrano comunemente sfide in tre aree: accuratezza dei dati, adozione da parte degli utenti e conformità.
Dati di localizzazione inaccurati sono tipicamente causati da densità insufficiente di AP, significative interferenze RF da reti adiacenti o ostruzioni fisiche, o mancata considerazione della randomizzazione MAC. Diagnosticare confrontando i conteggi di affluenza previsti con i conteggi di osservazione manuale durante un periodo di test controllato. Se la varianza supera il 20%, condurre una nuova indagine del sito e rivedere il posizionamento degli AP.
Bassi tassi di autenticazione indicano un'esperienza del Captive Portal troppo complessa, troppo lenta o insufficientemente accattivante. Verificare il tempo di caricamento del portale, il numero di passaggi per l'autenticazione e la chiarezza della proposta di valore. Eseguire A/B test su diversi design e offerte del portale per identificare la configurazione con il più alto tasso di conversione.
Violazioni della privacy dei dati rappresentano il rischio più significativo, con multe GDPR che raggiungono fino al 4% del fatturato annuo globale. Mitigare implementando un rigoroso programma di conformità fin dall'inizio: acquisizione esplicita del consenso, informative sulla privacy accurate, minimizzazione dei dati, anonimizzazione dei dati di analisi della presenza e audit di conformità regolari. Assicurarsi che il fornitore della piattaforma di analytics fornisca un Accordo sul Trattamento dei Dati (DPA) e sia certificato ISO 27001 o equivalente.
ROI e Impatto sul Business
Il business case per l'analisi WiFi è più solido quando inquadrato attorno a specifici risultati operativi piuttosto che alla raccolta generica di dati. I seguenti benchmark si basano su implementazioni aziendali tipiche tra la base clienti di Purple.
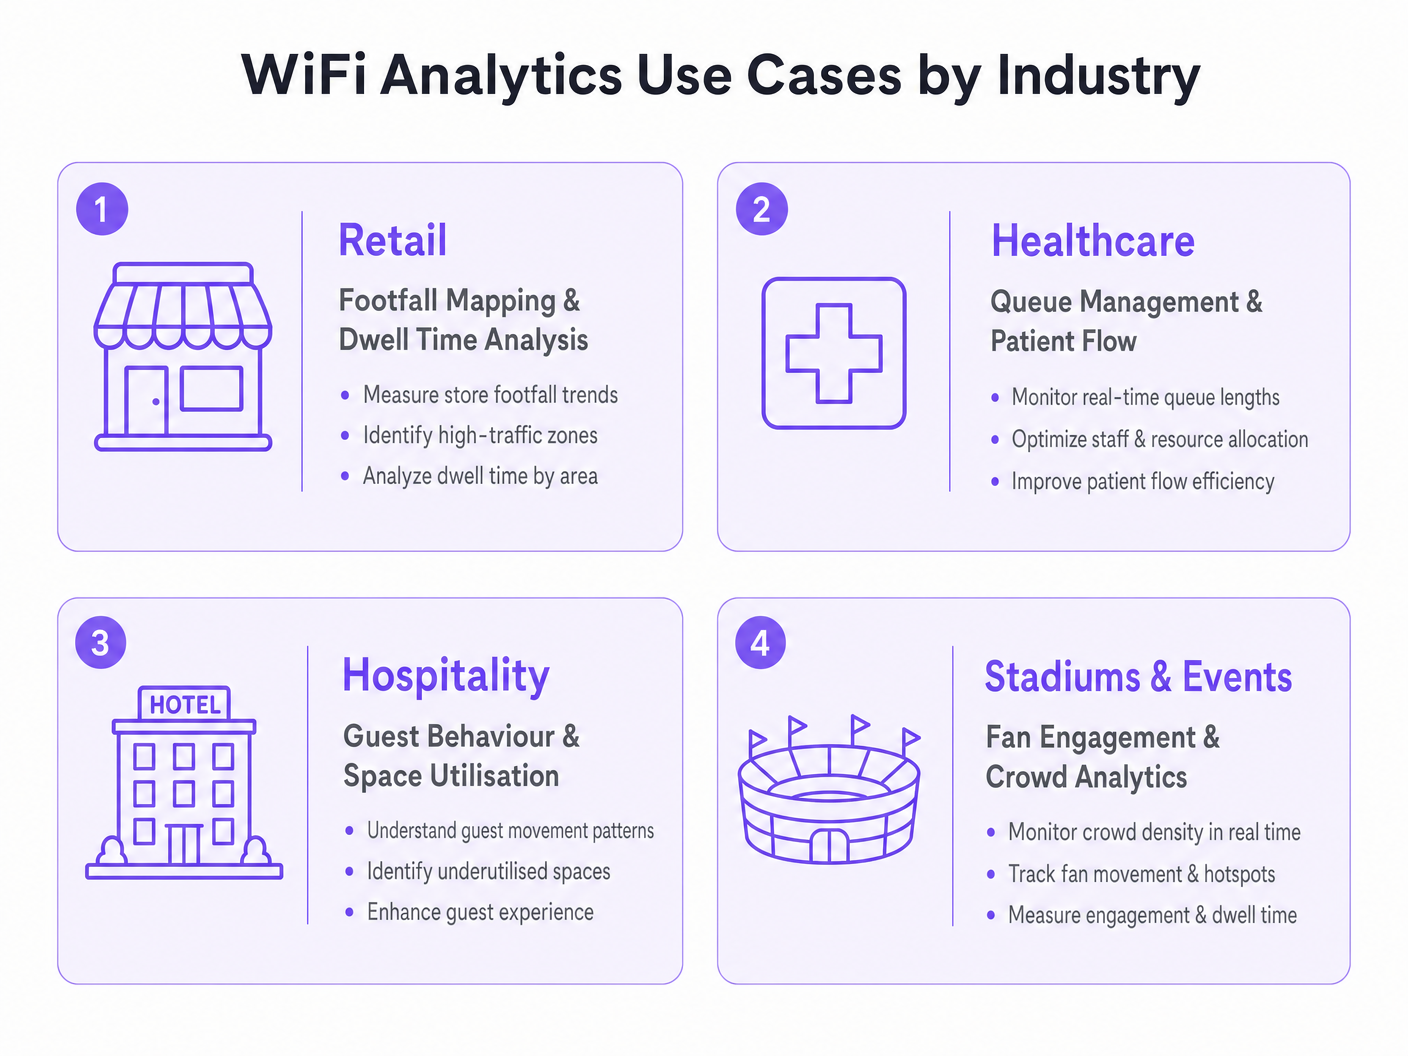
| Verticale | Caso d'Uso Primario | Risultato Tipico |
|---|---|---|
| Vendita al Dettaglio | Mappatura dell'affluenza e ottimizzazione delle zone | Aumento dell'8–15% del valore medio delle transazioni |
| Sanità | Gestione delle code e flusso dei pazienti | Riduzione del 20–30% dei tempi medi di attesa |
| Ospitalità | Comportamento degli ospiti e utilizzo dello spazio | Miglioramento del 12–18% dei ricavi F&B per ospite |
| Trasporti | Flusso di passeggeri e ottimizzazione delle concessioni | Aumento del 10–20% dei ricavi delle concessioni al dettaglio |
Misurare il successo rispetto a una baseline definita stabilita durante l'indagine del sito pre-deployment. Monitorare le metriche chiave — affluenza, tempo di permanenza, tasso di ritorno delle visite, tasso di connessione autenticata — con cadenza settimanale per il primo trimestre post-deployment, e poi mensilmente. Correlare i dati di analytics con le metriche di performance finanziaria per costruire la narrativa del ROI per gli stakeholder senior e giustificare ulteriori investimentimento nella piattaforma.
Il periodo di recupero dell'investimento per un'implementazione ben eseguita di analisi WiFi varia tipicamente da 12 a 18 mesi, con un valore annuale continuo fornito attraverso l'ottimizzazione operativa costante e dati di prima parte arricchiti per programmi di marketing e fedeltà.
Definizioni chiave
RSSI (Received Signal Strength Indicator)
A measurement of the power level of a received radio signal, expressed in decibels relative to one milliwatt (dBm). In WiFi analytics, RSSI values from multiple access points are used to triangulate the approximate location of a client device.
IT teams encounter RSSI when configuring location analytics engines and when troubleshooting inaccurate positioning data. A higher RSSI (closer to 0 dBm) indicates a stronger signal and more reliable location data.
Probe Request
A management frame broadcast by a WiFi-enabled device to discover available networks. Probe requests are transmitted even when the device is not connected to any network, making them the basis for passive presence analytics.
The foundation of anonymous footfall counting. IT teams should understand that modern devices randomise the MAC address in probe requests, which affects the accuracy of unique visitor counts in presence analytics deployments.
MAC Address Randomisation
A privacy feature implemented in modern mobile operating systems (iOS 14+, Android 10+) that causes devices to use randomised MAC addresses in probe requests and, in some configurations, when connecting to networks. This prevents persistent tracking of devices across time and locations.
The primary technical challenge for WiFi analytics deployments relying on passive presence data. Mitigation requires incentivising active authentication through the captive portal, where the authenticated session provides a stable identifier.
Captive Portal
A web page presented to users when they connect to a public or guest WiFi network, requiring authentication or acceptance of terms before granting internet access. In WiFi analytics deployments, the captive portal is the primary mechanism for collecting authenticated user data and consent.
The design and performance of the captive portal directly determines the authentication rate, which is the key driver of analytics data quality. IT teams should treat captive portal optimisation as a continuous improvement activity.
Trilateration
A geometric technique for determining the position of a point by measuring its distance from three or more known reference points. In WiFi analytics, trilateration uses RSSI values from multiple access points to estimate device location on a floor plan.
The core algorithm behind WiFi-based indoor positioning. IT teams should understand that trilateration accuracy degrades with fewer than three reference APs, with significant RF interference, or in environments with complex physical layouts.
Dwell Time
The duration a device (and by proxy, a person) remains within a defined zone or venue. Dwell time is a key metric in WiFi analytics, used to measure customer engagement with specific areas of a retail store, waiting times in healthcare settings, or fan engagement in stadium concourse areas.
One of the most commercially actionable metrics in WiFi analytics. High dwell time in a retail zone correlates with purchase intent; low dwell time in a hospitality venue may indicate a poor customer experience. Used alongside footfall data to calculate zone efficiency.
Presence Analytics
The analysis of WiFi probe request data to determine the number of devices (and by proxy, people) present in a venue or zone, without requiring active network connection. Provides passive footfall counting and dwell time measurement.
The entry-level capability of most WiFi analytics platforms. Useful for broad traffic trend analysis but subject to distortion from MAC randomisation. IT teams should use presence analytics for directional insights and authenticated analytics for precise, demographically segmented data.
OpenRoaming
A Wireless Broadband Alliance (WBA) standard that enables seamless, automatic WiFi authentication across participating networks using identity credentials from trusted providers (mobile operators, social identity providers). Eliminates the need for manual captive portal interaction for participating users.
Increasingly relevant for enterprise deployments seeking to maximise authenticated connection rates without increasing portal friction. Purple supports OpenRoaming as an authentication method, enabling venues to capture analytics data from roaming users who would otherwise bypass the captive portal.
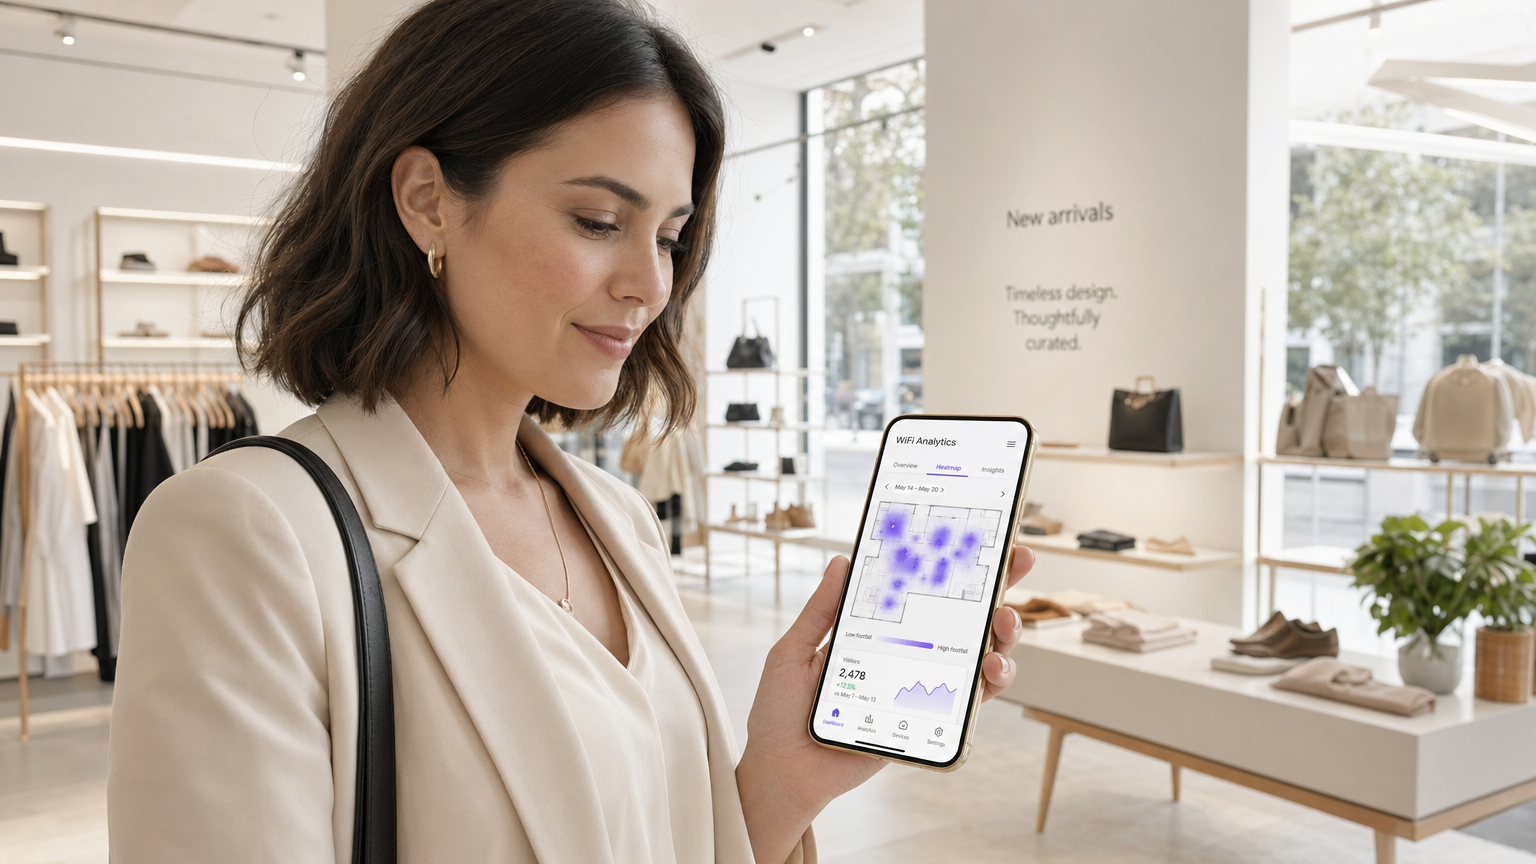
Heat Map
A data visualisation technique that uses colour gradients to represent the density or intensity of a variable across a geographic area. In WiFi analytics, heat maps display footfall density or dwell time intensity across a venue floor plan, enabling rapid identification of high-traffic and low-traffic zones.
The most commonly used visualisation in WiFi analytics dashboards. IT teams and operations directors use heat maps to communicate spatial insights to non-technical stakeholders and to inform decisions about store layout, staffing allocation, and facility management.
Esempi pratici
A UK fashion retailer with 12 stores notices that conversion rates are declining despite stable footfall. Store managers report that customers seem to browse the front of the store but rarely reach the back sections where higher-margin products are displayed. How should the IT and operations teams deploy WiFi analytics to diagnose and address this problem?
Deploy Purple's WiFi Analytics platform across all 12 stores, ensuring sufficient AP density (minimum 3 APs per zone) to support zone-level location tracking. Configure floor plan maps for each store within the analytics platform, defining zones that correspond to product categories and store sections. Run a 4-week baseline data collection period to establish footfall heat maps, dwell times by zone, and customer journey paths. Analyse the data to identify the specific point in the store layout where customer flow drops off. Cross-reference with point-of-sale data to identify which zones correlate with higher transaction values. Use the insights to inform a store layout redesign — repositioning high-margin categories into high-traffic zones identified by the heat maps. Implement a captive portal offering a loyalty discount to incentivise authentication, enabling demographic segmentation of the analytics data. Re-measure after the layout change to quantify the uplift.
An NHS trust is experiencing patient satisfaction issues related to waiting times in its outpatient departments. The operations director wants to use WiFi analytics to gain real-time visibility into patient flow and queue lengths. What are the technical and compliance considerations for this deployment?
Deploy WiFi analytics across the outpatient department, mapping waiting areas, consultation rooms, and corridors as distinct zones. Configure real-time alerting within the analytics platform to trigger notifications to the operations team when queue lengths in specific waiting areas exceed defined thresholds (e.g., more than 15 devices detected in a waiting zone for more than 30 minutes). Integrate the analytics platform with the existing patient management system via API to correlate WiFi presence data with appointment schedules. For compliance, conduct a DPIA before deployment, as patient location data in a healthcare setting is particularly sensitive. Implement strict data anonymisation — ensure that WiFi analytics data cannot be linked back to individual patient records. Use presence analytics (unassociated probe requests) for queue monitoring rather than authenticated analytics, minimising the personal data collected. Provide clear signage in waiting areas informing patients that WiFi analytics are in use for service improvement purposes.
Domande di esercitazione
Q1. A 500-bed hospital trust wants to deploy WiFi analytics to monitor patient flow through its A&E department. The CISO raises concerns about GDPR compliance, specifically whether location tracking of patients constitutes processing of sensitive personal data. How do you structure the deployment to achieve the operational objective while satisfying the compliance requirement?
Suggerimento: Consider whether the operational objective (queue monitoring) requires authenticated personal data, or whether anonymous presence analytics would be sufficient. Think about the distinction between presence analytics and authenticated analytics in the context of GDPR's data minimisation principle.
Visualizza risposta modello
Structure the deployment using presence analytics only for queue monitoring — unassociated probe request data provides sufficient signal for counting devices in waiting zones and measuring dwell times without requiring authentication or the collection of personal data. Implement strict data anonymisation: hash all MAC addresses before storage, apply a rolling anonymisation window of no more than 24 hours, and ensure the analytics platform cannot link WiFi data to patient records. Provide clear signage in the A&E department informing visitors that anonymous WiFi analytics are in use for service improvement. Conduct a DPIA documenting the data minimisation approach and the technical controls in place. This approach achieves the operational objective — real-time queue visibility and dwell time monitoring — while processing no personal data, thereby avoiding the GDPR compliance risk entirely.
Q2. A retail chain deploys WiFi analytics across 20 stores and finds that the footfall counts from the analytics platform are consistently 40% higher than manual door counter readings. What are the most likely causes and how do you diagnose and resolve the discrepancy?
Suggerimento: Think about the sources of overcounting in presence analytics. Consider the impact of MAC randomisation, the behaviour of devices in adjacent areas (car parks, neighbouring stores), and the configuration of the detection zone boundaries.
Visualizza risposta modello
The most likely causes of overcounting are: (1) MAC randomisation causing individual devices to be counted multiple times as their MAC address changes; (2) probe requests from devices outside the store perimeter being detected by APs near windows or entrances — devices in the car park or on the street are being included in the count; (3) staff devices being included in the footfall count. Diagnose by comparing the analytics data against manual counts at specific time windows and correlating with known variables (e.g., is the discrepancy consistent across all stores or concentrated in stores with large car parks?). Resolution: configure detection zone boundaries to exclude the perimeter area, implement a minimum dwell time threshold (e.g., only count devices detected for more than 2 minutes) to filter out pass-by devices, exclude known staff MAC addresses or implement a staff device exclusion list, and use authenticated session data as a cross-validation source. Accept that presence analytics will always produce higher counts than door counters due to multi-device households and use the data for trend analysis rather than absolute counts.
Q3. A stadium operator wants to use WiFi analytics to improve the fan experience during match days, specifically to reduce queuing at concession stands and to enable targeted push notifications to fans in specific zones. The IT team has a Wi-Fi 6 network with 200 APs deployed across the venue. What additional configuration and integrations are required to deliver both use cases?
Suggerimento: Consider the different data requirements for the two use cases: queue monitoring is an operational use case that can use presence analytics, while targeted push notifications require authenticated user profiles with location data and a notification delivery mechanism.
Visualizza risposta modello
For queue monitoring at concession stands: configure zone-level presence analytics for each concession area, set up real-time alerting when device counts in a zone exceed a defined threshold, and integrate the alerts with the stadium operations centre dashboard. This use case can be delivered using presence analytics alone and does not require user authentication. For targeted push notifications: deploy a captive portal on the stadium WiFi with a compelling authentication offer (e.g., match day loyalty points, exclusive content). Integrate the WiFi analytics platform with the stadium's CRM and mobile app via API. Configure zone-level location tracking to identify which fans are in which areas of the stadium. Use the analytics platform's segmentation capability to create audience segments based on location (e.g., fans in the East Stand concourse) and trigger push notifications via the mobile app integration. Ensure the captive portal consent capture explicitly covers location-based marketing communications, and provide fans with a clear opt-out mechanism. Test the notification latency — from zone detection to notification delivery — to ensure it is under 60 seconds for time-sensitive offers.
Continua a leggere questa serie
Privacy by Design: Anonimizzazione dei dati WiFi per la conformità al GDPR
Questa guida autorevole illustra l'architettura tecnica e le strategie di implementazione per l'anonimizzazione dei dati WiFi al fine di garantire la conformità al GDPR. Fornisce a responsabili IT e architetti di rete framework attuabili per bilanciare analisi robuste delle sedi con rigorosi requisiti di privacy dei dati.
Heatmapping vs. Presence Analytics: Differenze Tecniche
Questa guida tecnica autorevole illustra le differenze architettoniche e operative critiche tra il WiFi heatmapping e la presence analytics per gli operatori di sedi aziendali. Fornisce a responsabili IT, architetti di rete e direttori delle operazioni framework di implementazione attuabili, scenari di implementazione reali e best practice neutrali rispetto ai fornitori per massimizzare il ROI dalla loro infrastruttura wireless esistente.
Come Calcolare il Tempo di Permanenza Utilizzando i WiFi Location Analytics
Questa guida fornisce un riferimento tecnico completo per il calcolo del tempo di permanenza WiFi utilizzando i WiFi location analytics, coprendo l'intera architettura dalla cattura delle richieste di probe 802.11 attraverso la trilaterazione basata su RSSI all'analisi delle zone geofenced. È progettata per IT manager, architetti di rete e direttori delle operazioni di sede che necessitano di implementare un'intelligence di localizzazione accurata e scalabile in ambienti di vendita al dettaglio, ospitalità, sanità e settore pubblico. I lettori otterranno indicazioni pratiche sull'implementazione, casi di studio reali e un quadro chiaro per tradurre i dati spaziali grezzi in risultati di business misurabili.