Come i Centri Commerciali Utilizzano l'Analisi WiFi per Attrarre e Fidelizzare i Rivenditori
Questa guida tecnica di riferimento autorevole spiega come i team IT dei centri commerciali e i gestori immobiliari implementano l'analisi WiFi per acquisire dati sul flusso di visitatori, misurare il tempo di permanenza per zona e costruire la base di prove empiriche necessaria per negoziare contratti di locazione, fidelizzare i rivenditori premium e attrarre nuovi inquilini. Copre l'intero stack tecnico, dall'implementazione degli AP e l'acquisizione dei dati a livello MAC fino alle dashboard di analisi conformi al GDPR, con esempi pratici concreti e framework decisionali per i professionisti IT pronti a implementare questo trimestre.
Ascolta questa guida
Visualizza trascrizione del podcast
Sintesi Esecutiva
Per i moderni centri commerciali, la rete wireless non è più solo un servizio per gli ospiti — è il sistema di telemetria primario per la sede fisica. Implementando una robusta Guest WiFi infrastruttura abbinata a una piattaforma WiFi Analytics di livello enterprise, gli operatori della sede trasformano i segnali wireless passivi in intelligenza commerciale azionabile.
Questa guida descrive in dettaglio l'architettura tecnica, le strategie di implementazione e le metodologie di utilizzo dei dati necessarie per acquisire metriche accurate sul flusso di visitatori e sul tempo di permanenza. Per i responsabili IT, gli architetti di rete e i CTO, il mandato è chiaro: costruire una rete resiliente e ad alta densità che non solo supporti un'elevata produttività degli utenti, ma fornisca anche l'accuratezza dei dati spaziali richiesta dai team di leasing e commerciali per dimostrare il ROI, giustificare i valori di locazione e attrarre inquilini retail di alto livello. Gli stessi principi si applicano negli ambienti hospitality , transport e healthcare dove l'intelligenza spaziale guida le decisioni operative e commerciali.
Approfondimento Tecnico
Come Funziona la Raccolta Dati WiFi
La base dell'analisi WiFi dei centri commerciali risiede nella capacità di rilevare e tracciare i dispositivi client all'interno della sede. Ciò si ottiene tramite due meccanismi primari che operano in parallelo.
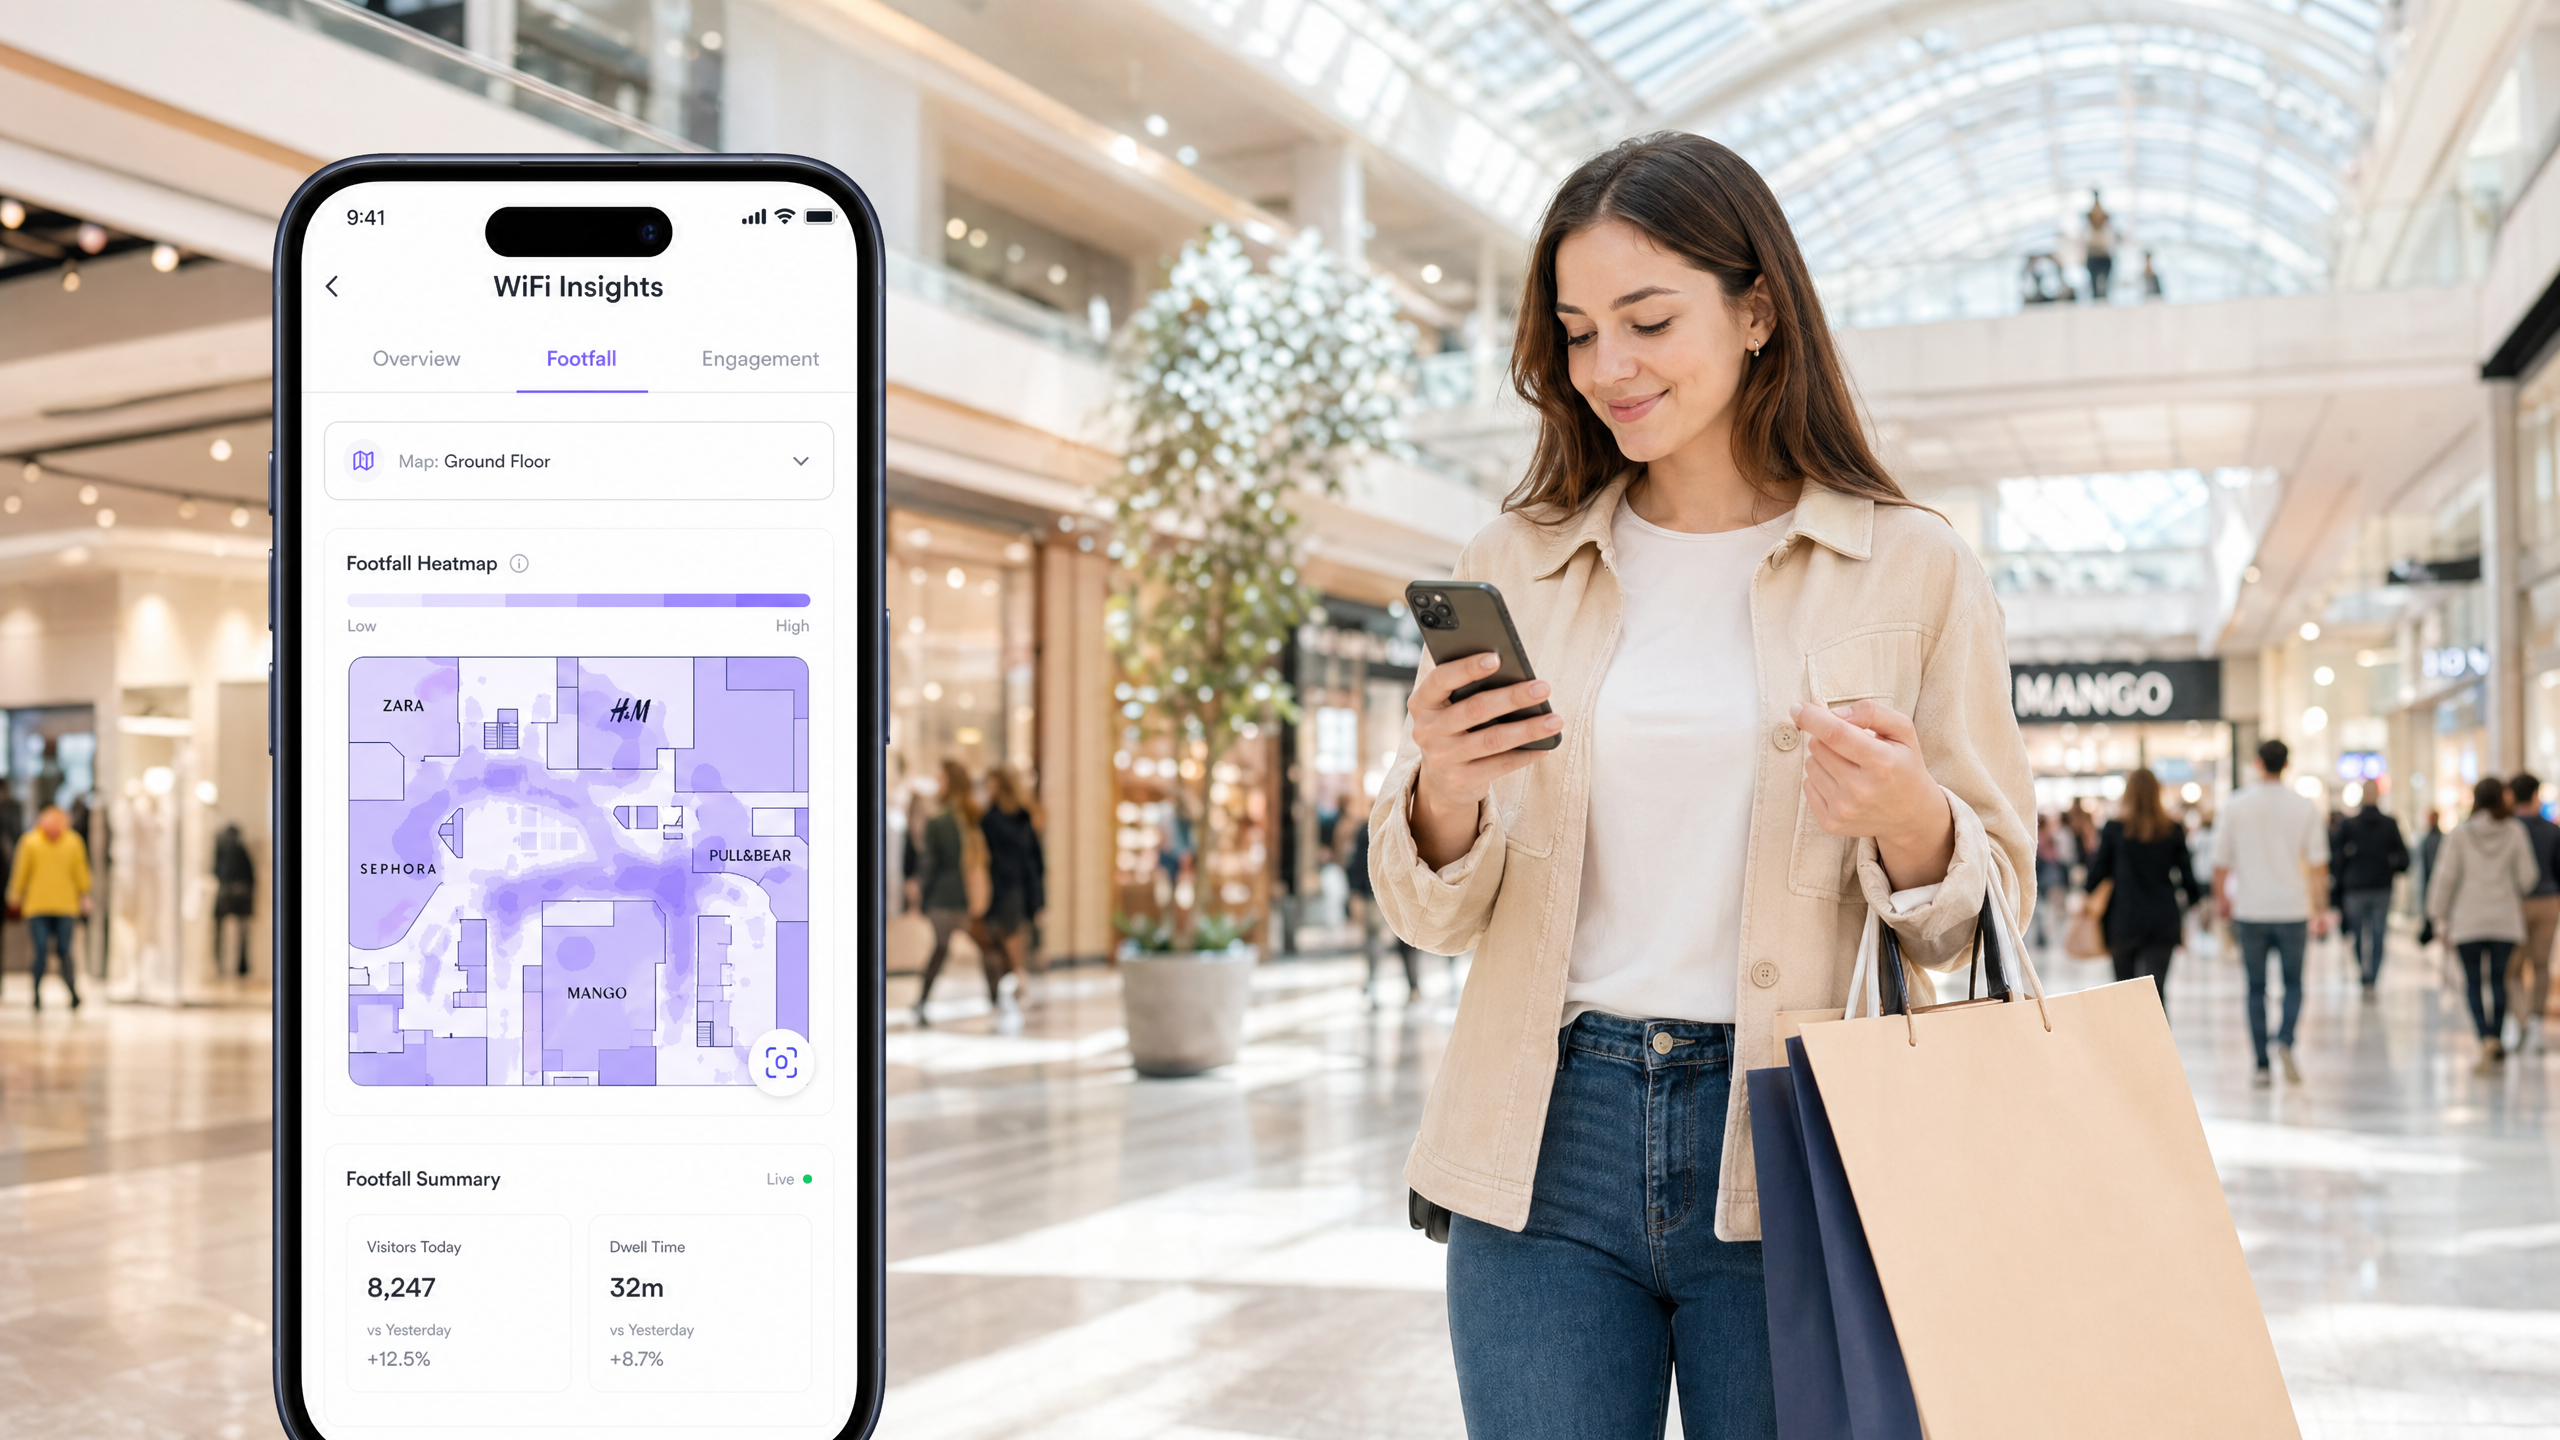
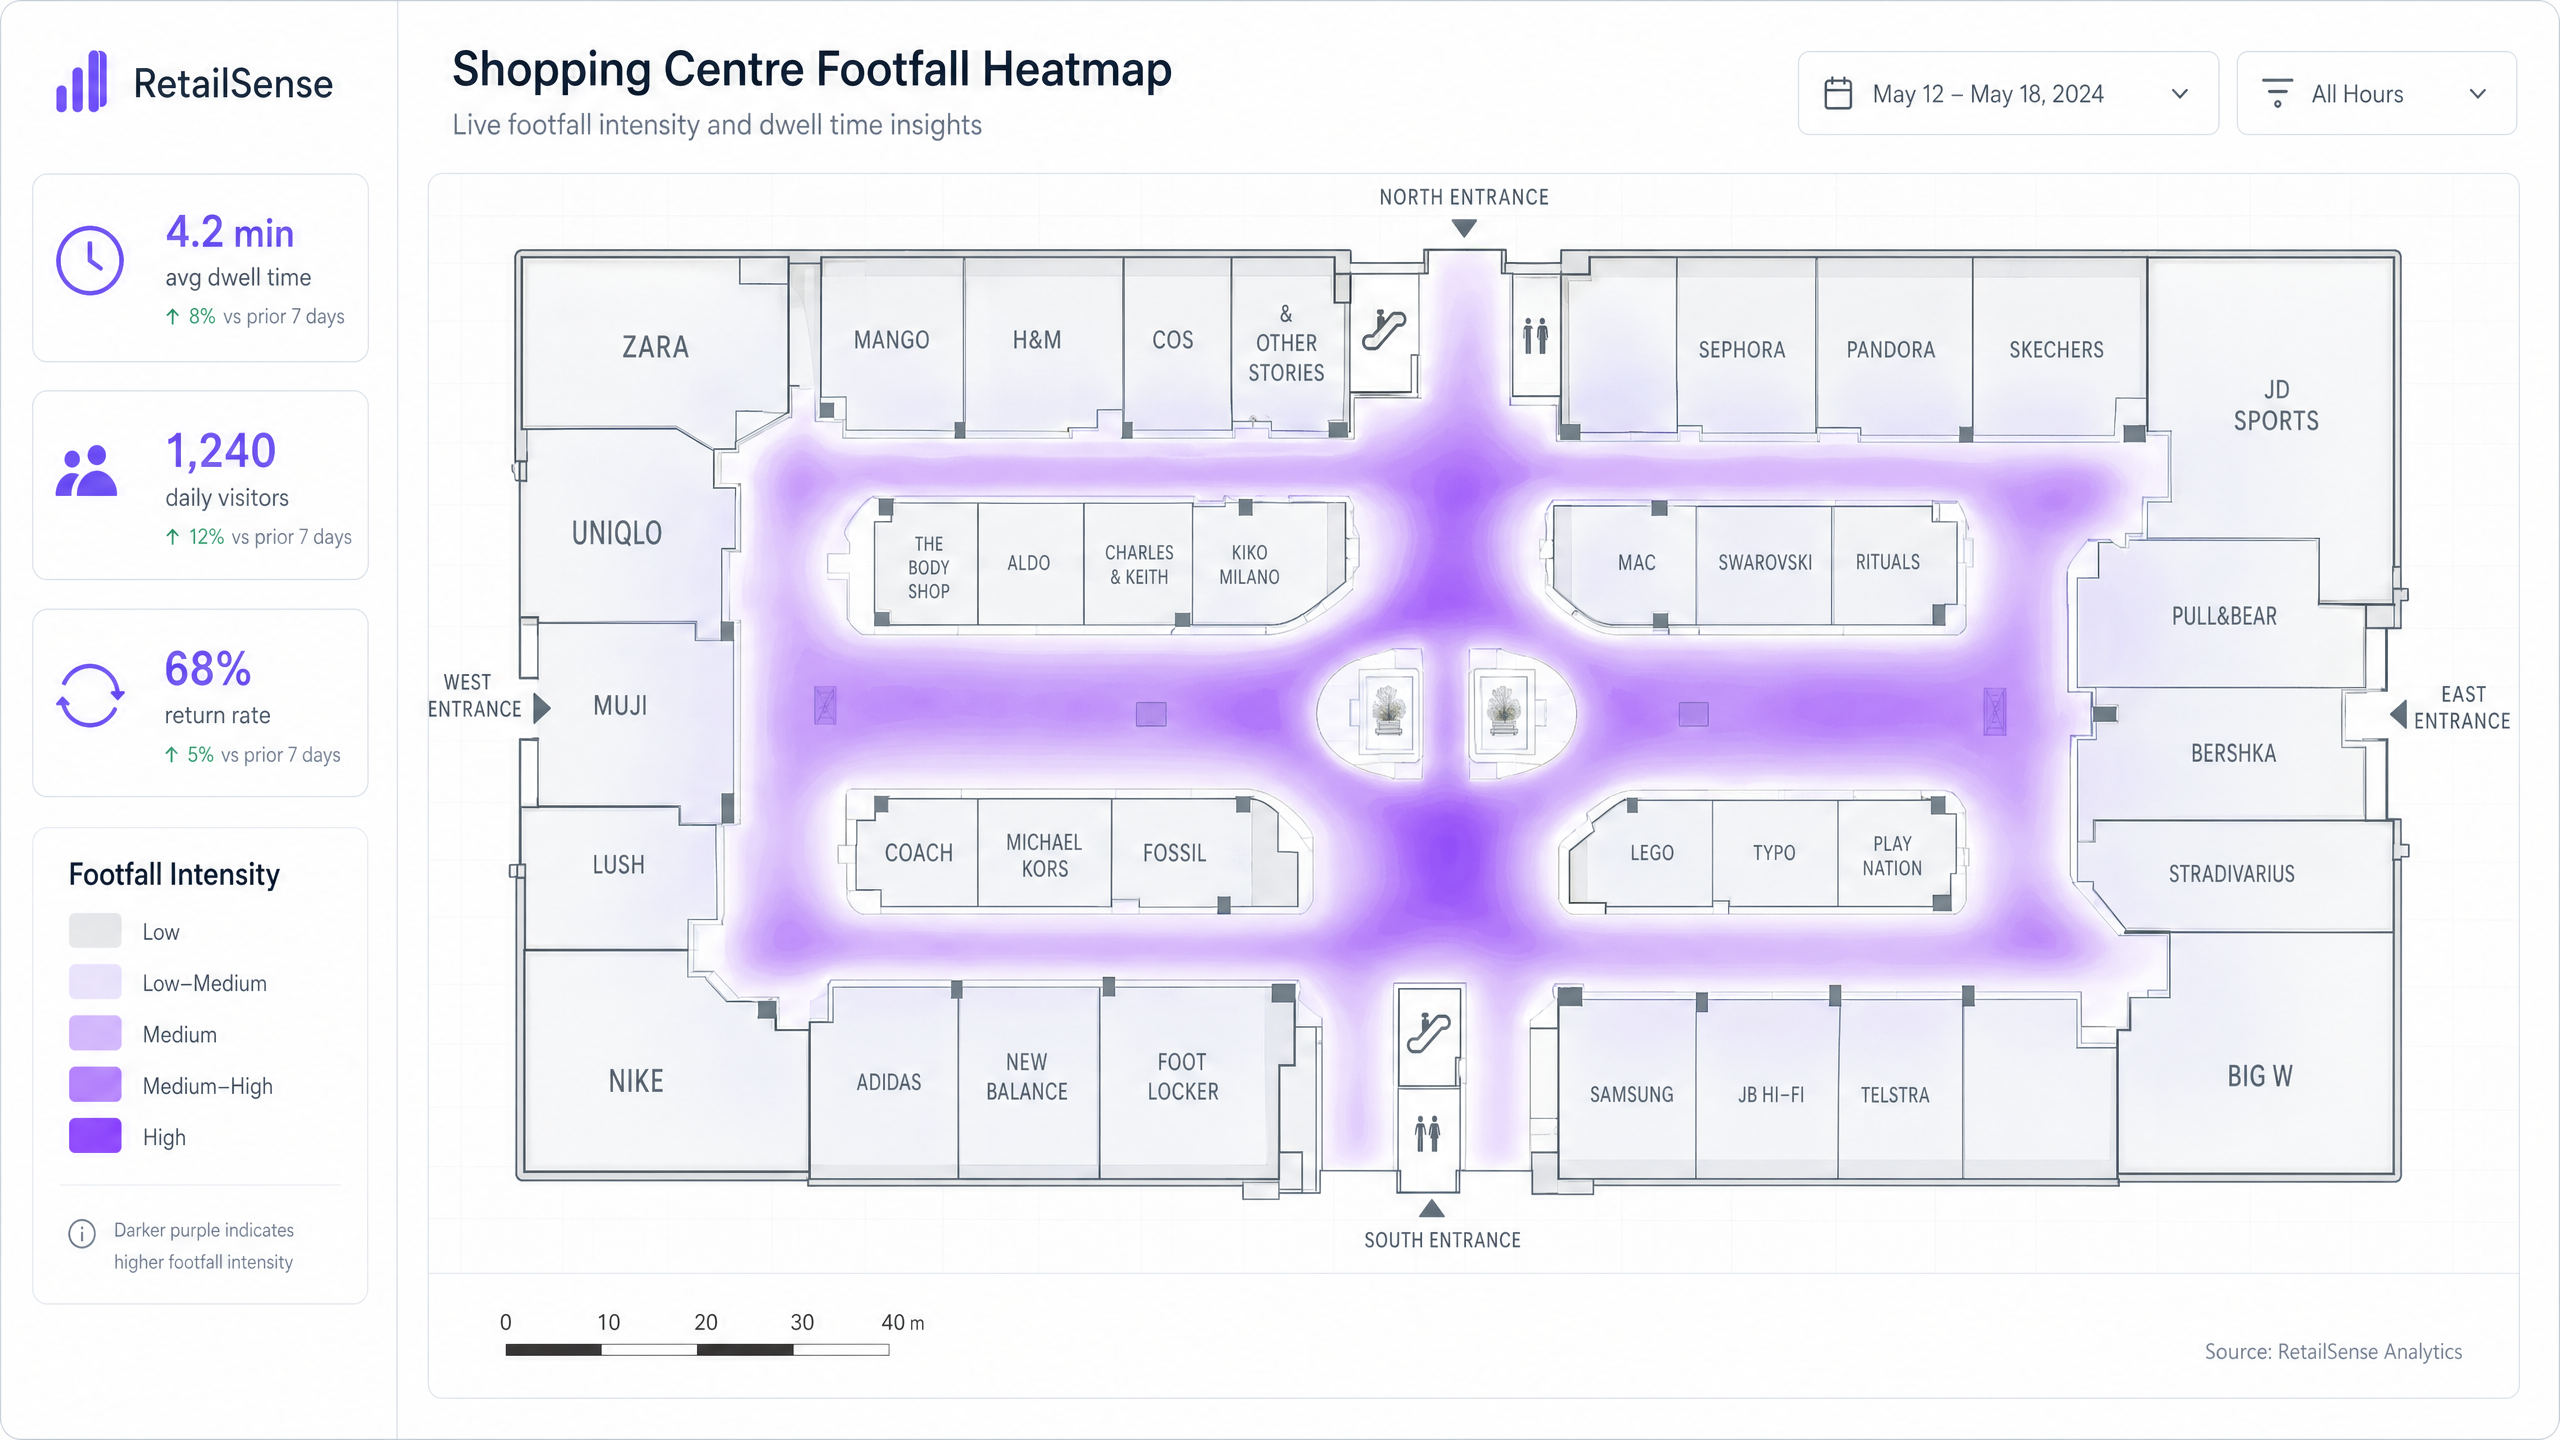
Analisi di Presenza (Non Autenticata): Gli Access points (APs) monitorano continuamente le richieste di sonda IEEE 802.11 emesse dagli smartphone alla ricerca di reti conosciute. Acquisendo il MAC address — che viene immediatamente sottoposto a hashing utilizzando una funzione crittografica unidirezionale per mantenere la conformità al GDPR — e misurando il Received Signal Strength Indicator (RSSI) da più APs contemporaneamente, il sistema stima la prossimità e il movimento del dispositivo. Questo fornisce una metrica di base per il flusso totale di visitatori, inclusi quelli che non si connettono mai alla rete. Questo è il conteggio dei "passanti" che i gestori immobiliari utilizzano per dimostrare il valore commerciale dei corridoi ad alto traffico.
Sessioni Autenticate: Quando un utente si connette attivamente tramite il captive portal, la sede acquisisce dati di prima parte — demografia, indirizzo email e hook di integrazione CRM — con consenso esplicito. Ciò sposta il modello di dati dal tracciamento anonimo dei dispositivi alla profilazione arricchita dei clienti. L'integrazione di OpenRoaming (Hotspot 2.0 / Passpoint), dove Purple agisce come fornitore di identità gratuito sotto la licenza Connect, facilita un onboarding senza interruzioni e sicuro senza una tradizionale splash page. Ciò aumenta drasticamente il volume delle sessioni autenticate, fornendo un set di dati più ricco e statisticamente robusto per l'analisi commerciale.
Triangolazione Spaziale e Accuratezza della Zona
Per fornire dati azionabili per specifiche zone retail — piuttosto che un semplice aggregato a livello di sede — la rete deve localizzare accuratamente i dispositivi all'interno di un'area definita. Ciò richiede la trilaterazione: il processo di utilizzo delle letture RSSI da almeno tre access point contemporaneamente per calcolare la posizione di un dispositivo sulla planimetria. L'accuratezza di questo processo è direttamente proporzionale alla densità degli AP.
Un'implementazione standard con modello di copertura (un AP per 1.000–1.500 piedi quadrati) è insufficiente per l'analisi della posizione. Un'implementazione ottimizzata per la posizione richiede tipicamente un AP per 500–700 piedi quadrati nelle zone di tracciamento chiave, con un'attenta attenzione alle impostazioni di potenza di trasmissione per garantire che le dimensioni delle celle siano sufficientemente piccole da fornire una risoluzione spaziale significativa.
| Modello di Implementazione | AP Density | Caso d'Uso Primario | Location Accuracy |
|---|---|---|---|
| Copertura | 1 per 1.500 piedi quadrati | Connettività di base | Nessuna |
| Capacità | 1 per 800 piedi quadrati | Eventi ad alta produttività | Bassa |
| Analisi della Posizione | 1 per 500 piedi quadrati | Tracciamento flusso di visitatori e tempo di permanenza | Alta (±3–5m) |
Agnosticismo dell'Infrastruttura e Architettura di Integrazione
Le moderne piattaforme di analisi, inclusa Purple, operano come un overlay sull'infrastruttura wireless aziendale esistente. Si integrano con i Wireless LAN Controllers (WLCs) esistenti di Cisco, Aruba, Meraki e Ruckus tramite protocolli standard. Il WLC inoltra i dati di presenza — tipicamente tramite syslog, SNMP traps o API specifiche del fornitore — al motore di analisi cloud. Ciò minimizza la necessità di una sostituzione immediata dell'hardware, consentendo alle sedi di sfruttare il loro investimento di capitale esistente aggiungendo lo strato di analisi in modo incrementale.
Per le sedi che considerano un aggiornamento della leased line per supportare l'aumento del throughput dei dati da un'implementazione di analisi ad alta densità, è fortemente raccomandata una connessione simmetrica dedicata per garantire una latenza costante per gli aggiornamenti della dashboard in tempo reale.
Guida all'Implementazione
L'implementazione di una rete wireless consapevole della posizione richiede una pianificazione meticolosa attraverso quattro fasi distinte.
Fase 1 — Pianificazione RF e Sopralluogo: Utilizzare strumenti di rilevamento predittivo come Ekahau Pro o AirMagnet per modellare l'ambiente RF prima dell'installazione di qualsiasi hardware. Tenere conto dell'attenuazione dovuta ai materiali da costruzione — tetti di atri in vetro, arredi metallici per negozi e colonne strutturali in cemento introducono tutti interferenze multipath che distorcono i calcoli di posizione basati sull'RSSI. Definire l'accuratezza di posizione richiesta per ogni zona e procedere a ritroso per determinare la griglia di posizionamento degli AP.
Fase 2 — Implementazione e Configurazione dell'Hardware: Installare gli AP secondo lae sondaggio predittivo, quindi condurre un sondaggio attivo sul sito per convalidare le letture RSSI reali rispetto al modello. Configurare la gestione delle risorse radio (RRM) ma applicare limiti rigorosi alla potenza di trasmissione — tipicamente 14–17 dBm — per mantenere dimensioni ridotte delle celle. Assicurarsi che la guest SSID sia isolata dalle reti aziendali e POS tramite segmentazione VLAN, in conformità con i requisiti PCI DSS.
Fase 3 — Integrazione della piattaforma di Analytics: Collegare il WLC alla piattaforma di analytics Purple. Definire zone georeferenziate all'interno della dashboard che corrispondano precisamente alle singole unità commerciali, aree comuni, corridoi d'ingresso e aree ristorazione. Calibrare la planimetria all'interno della piattaforma utilizzando punti di riferimento noti.
Fase 4 — Configurazione del Captive Portal e del Consenso: Progettare un flusso di onboarding semplificato. Ridurre al minimo l'attrito — ogni passaggio aggiuntivo nel processo di autenticazione riduce il tasso di adesione di circa il 15-20%. Integrare piattaforme CRM e di marketing automation tramite API. Assicurarsi che il linguaggio del consenso sia esplicito, granulare e conforme ai requisiti dell'Articolo 7 del GDPR.
Migliori Pratiche
Considerare la Randomizzazione MAC: I dispositivi iOS 14+ e Android 10+ randomizzano i loro indirizzi MAC per impostazione predefinita quando cercano reti. Una piattaforma di analytics che non tiene conto di ciò riporterà dati di affluenza gonfiati — a volte di un fattore da tre a cinque volte il numero effettivo di visitatori. Assicurarsi che la piattaforma utilizzi i dati di sessione autenticati come metrica principale e applichi algoritmi di deduplicazione al dataset delle richieste di sonda.
Dare Priorità alla Sicurezza della Rete: Implementare una robusta segmentazione della rete. Il traffico degli ospiti deve essere isolato dall'infrastruttura aziendale. Fare riferimento a Proteggi la tua rete con DNS e sicurezza robusti per una guida completa al filtraggio DNS e alle migliori pratiche di sicurezza della rete applicabili agli ambienti multi-tenant.
Applicare la Governance dei Dati: Attenersi rigorosamente al GDPR o alle normative locali sulla privacy dei dati applicabili. Utilizzare l'hashing MAC per il tracciamento non autenticato, richiedere il consenso esplicito opt-in durante l'autenticazione del captive portal e implementare una politica documentata di conservazione dei dati. Assicurarsi che siano in atto accordi di trattamento dei dati con tutti i fornitori di analytics di terze parti.
Sfruttare OpenRoaming per la Scalabilità: Adottare Passpoint/Hotspot 2.0 per fornire connettività sicura e senza interruzioni che rispecchi l'esperienza di roaming cellulare. Questo elimina l'attrito del captive portal per gli utenti di ritorno, aumentando i tassi di acquisizione dei dati autenticati e migliorando la fiducia statistica delle tue analytics.
Risoluzione dei Problemi e Mitigazione dei Rischi
Dati di Posizione Inaccurati: La causa più comune è una densità insufficiente di AP o una potenza di trasmissione eccessiva che crea celle di grandi dimensioni. Un dispositivo che si connette a un AP a 80 metri di distanza apparirà nella zona sbagliata. Condurre un sondaggio attivo sul sito, rivedere le mappe di calore RSSI e ridurre la potenza di trasmissione per restringere i confini delle celle. Verificare che almeno tre AP rilevino i client in ogni zona tracciata.
Bassi Tassi di Autenticazione (Sotto il 30%): Un processo di captive portal complesso o lento è la causa principale. Verificare il flusso di onboarding su un dispositivo mobile con una connessione 4G (non il WiFi della sede). Ridurre il numero di campi del modulo, offrire opzioni di social login e assicurarsi che la pagina del portale si carichi in meno di due secondi. Considerare l'implementazione di OpenRoaming per i visitatori di ritorno per eliminare completamente il portale.
Silos di Dati: Raccolta di dati di analytics a cui il team commerciale non può accedere o interpretare. Risolvere questo problema configurando integrazioni API automatizzate che inviano report settimanali sull'affluenza e sul tempo di permanenza direttamente nel CRM di gestione della proprietà o nello strumento di BI. Pianificare una revisione mensile dei dati con il team di leasing per garantire che le metriche acquisite siano allineate con le domande a cui devono rispondere nelle negoziazioni con gli inquilini.
Lacune nella Conformità GDPR: Verificare regolarmente i registri di consenso archiviati rispetto ai profili utente autenticati. Assicurarsi che le richieste di opt-out siano elaborate entro la finestra GDPR di 30 giorni e che i dati siano eliminati da tutti i sistemi a valle, incluse le integrazioni CRM di terze parti.
ROI e Impatto Commerciale
Per il team commerciale, il ROI di una soluzione di analytics WiFi correttamente implementata è sostanziale e misurabile attraverso tre principali flussi di valore.
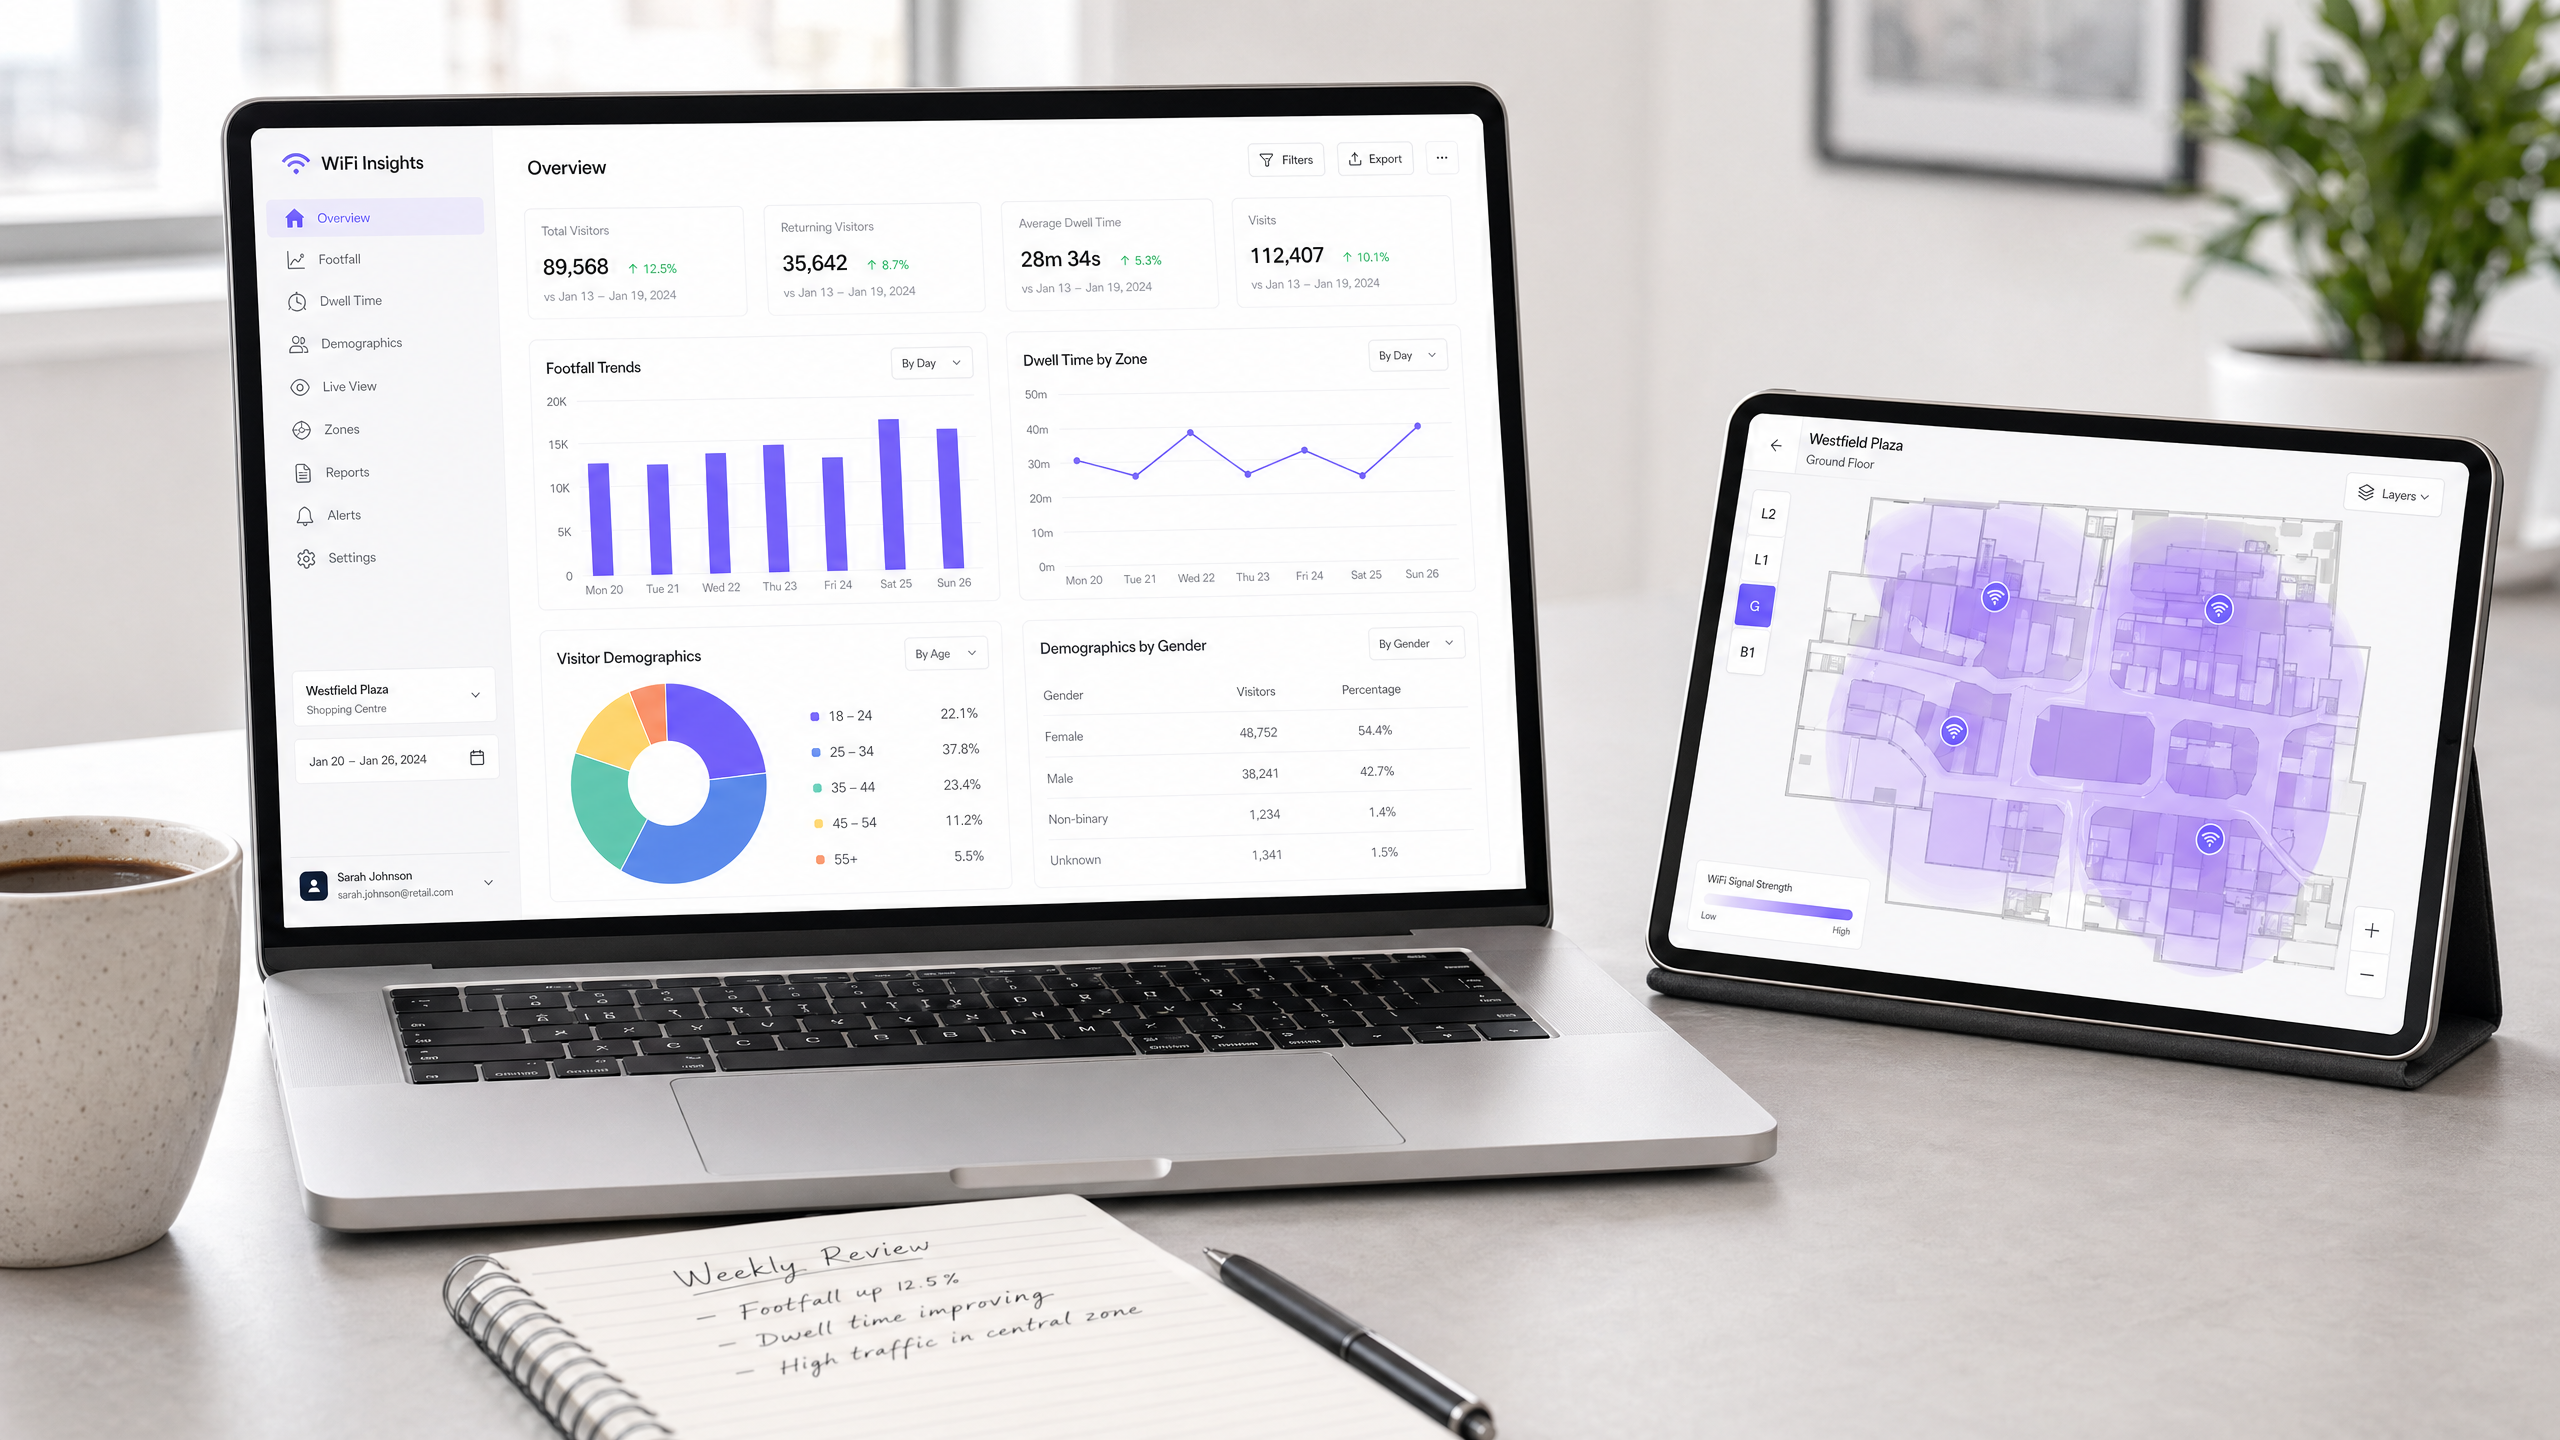
Negoziazione dei Contratti di Locazione: I gestori di proprietà passano da argomentazioni soggettive a negoziazioni basate sui dati. Presentando conteggi autenticati dei visitatori, distribuzioni del tempo di permanenza e suddivisioni demografiche per specifiche zone commerciali, la sede può dimostrare il valore commerciale di ogni unità con lo stesso rigore di una piattaforma di pubblicità digitale. Questi dati supportano sia prezzi premium per unità ad alto traffico sia revisioni degli affitti basate su prove.
Fidelizzazione degli Inquilini: I rivenditori ricevono insight localizzati — quante persone sono passate davanti al loro negozio rispetto a quante sono entrate, e quanto tempo sono rimaste quelle che sono entrate. Questi dati aiutano i rivenditori a ottimizzare le vetrine, gli orari del personale e i tempi delle promozioni. Un rivenditore che può vedere che l'affluenza davanti alla propria unità è aumentata del 18% dopo una campagna di marketing ha un motivo convincente per rinnovare il contratto di locazione e investire ulteriormente nella sede.
Efficienza Operativa: Le flow analytics consentono al team operativo di ottimizzare i programmi di pulizia, i percorsi di pattugliamento della sicurezza e l'utilizzo dell'HVAC basandosi su modelli di occupazione in tempo reale e storici. Le sedi tipicamente riportano una riduzione del 10-15% dei costi operativi entro il primo anno di implementazione attraverso l'allocazione delle risorse basata sui dati.
Approcci simili basati sui dati si stanno dimostrando altamente efficaci in altre categorie di sedi ad alta affluenza. La Guida alla connettività WiFi per Zoo e Parchi Tematici: Sedi ad alta affluenza copre sfide analoghe di analytics spaziali negli ambienti di svago, e gli stessi principi architettonici si applicano a tutte le grandi sedi fisiche.
Definizioni chiave
RSSI (Received Signal Strength Indicator)
A measurement of the power level present in a received radio signal, expressed in dBm (negative values, where -30 dBm is excellent and -90 dBm is very weak).
The primary input to the location analytics engine. Multiple APs report their RSSI reading for the same client device, and the engine uses these values to triangulate the device's position on the floor plan.
Trilateration
A method of determining the position of a point by measuring its distance from three or more known reference points, using the geometry of intersecting circles.
Requires a minimum of three access points to simultaneously detect a client device to calculate its position. This is why AP density is the critical variable for location analytics accuracy.
MAC Randomisation
A privacy feature in modern mobile operating systems (iOS 14+, Android 10+) that causes a device to broadcast a randomly generated MAC address when probing for WiFi networks, rather than its true hardware address.
The primary technical challenge for presence-based analytics. Platforms must use authenticated session data as the primary metric and apply deduplication algorithms to avoid massively inflating visitor counts.
OpenRoaming (Hotspot 2.0 / Passpoint)
A WiFi roaming federation standard that allows a device to automatically and securely connect to a participating network using a pre-installed profile, without requiring a captive portal interaction.
Purple acts as a free identity provider for OpenRoaming under the Connect licence. Deploying OpenRoaming significantly increases authenticated session volumes by removing the captive portal friction for returning users.
Dwell Time
The duration for which a detected device remains within a specifically defined geofenced zone, measured from first detection to last detection within that zone.
A critical commercial metric for retailers. High dwell time indicates engagement with a storefront or retail environment. Low dwell time in a zone with high footfall suggests a conversion problem rather than a traffic problem.
Probe Request
An IEEE 802.11 management frame broadcast by a client device to discover available wireless networks in its vicinity.
The mechanism used to capture unauthenticated presence data for total footfall counts, including visitors who never connect to the network. Subject to MAC randomisation on modern devices.
Captive Portal
A web page that a user of a public-access network is required to interact with before being granted full network access, typically used to present terms of service and collect consent for data processing.
The primary mechanism for capturing first-party demographic data and explicit GDPR-compliant marketing consent. The design and length of the portal flow directly determines the attach rate.
Attach Rate
The percentage of total detected devices (presence analytics) that successfully complete the captive portal authentication process and become authenticated sessions.
The key performance indicator for the quality of your analytics data. A low attach rate means the majority of your footfall data is anonymous and lacks demographic enrichment, limiting its commercial value.
Geofencing
The use of GPS or RSSI-based location data to define a virtual geographic boundary, triggering actions or data capture when a device enters or exits the defined area.
Used within the analytics platform to define specific retail zones, corridors, and entrances, enabling zone-level footfall and dwell time metrics rather than venue-wide aggregates.
Esempi pratici
A 150-unit regional shopping centre has a persistently high vacancy rate in its West Wing. The commercial team suspects footfall is lower than in the East Wing but has no data to confirm this. The existing WiFi network provides basic coverage using Cisco Meraki APs but has no analytics integration. The operations director needs data within 60 days to support a rent restructuring proposal.
Step 1: Conduct an active site survey of the West Wing to assess current AP density and RSSI coverage. Identify zones where fewer than three APs can detect a client device simultaneously. Step 2: Add supplementary APs in the West Wing corridors to achieve trilateration coverage. Reduce transmit power on all APs to 15 dBm to tighten cell sizes. Step 3: Enable the Cisco Meraki location analytics API and connect it to the Purple WiFi Analytics platform. Step 4: Define geofenced zones for each vacant unit, the main West Wing corridor, and the equivalent East Wing zones for comparison. Step 5: Collect 30 days of baseline data. Export a comparative report showing unique device counts, dwell time averages, and peak hour distributions for both wings. Step 6: Present the data to prospective tenants, demonstrating the actual footfall differential and the commercial opportunity for the right retail concept.
A premium fashion retailer is disputing their lease renewal at a major city-centre shopping centre. They claim that footfall past their unit has declined significantly since a new secondary entrance was opened on the opposite side of the mall 18 months ago, and they are demanding a 25% rent reduction. The property manager needs to verify or refute this claim using objective data.
Step 1: Access the WiFi analytics platform's historical data archive. Navigate to the zone corresponding to the retailer's storefront. Step 2: Pull the monthly unique device count and dwell time data for the 12 months prior to the new entrance opening and the 12 months following. Step 3: Analyse the pathing data to determine whether the primary traffic flow through the mall shifted after the new entrance opened. Identify which zones gained and which lost footfall. Step 4: Cross-reference the retailer's zone data against the overall mall footfall trend to determine whether any decline is specific to their location or part of a broader pattern. Step 5: Export a formal data report with timestamped, anonymised metrics. Present this as the objective evidence base for the lease negotiation.
Domande di esercitazione
Q1. A venue operator wants to track visitor movement through a 200-unit shopping centre but has budget constraints that limit AP deployment to the main corridors only, with APs spaced 50 metres apart in a linear arrangement. The IT director claims this will be sufficient for zone-level analytics. Evaluate this claim and identify the primary technical limitation.
Suggerimento: Consider the minimum number of access points required for spatial triangulation and the relationship between cell size and location accuracy.
Visualizza risposta modello
The IT director's claim is incorrect. Accurate zone-level location tracking requires trilateration — a minimum of three access points simultaneously detecting the same client device. A linear corridor deployment with 50-metre spacing means that in most locations, a device will only be within range of one or two APs, making trilateration impossible. The result will be a binary 'in corridor / not in corridor' detection rather than zone-level accuracy. The correct approach is a grid-based deployment with APs at 15–20 metre spacing in key tracking zones, with transmit power reduced to 14–17 dBm to create small, accurate cells.
Q2. The marketing team reports that the WiFi analytics platform is showing 450,000 unique visitors for the month of March. The physical door counters at all entrances recorded a combined total of 95,000 entries for the same period. The discrepancy is causing the commercial team to question the reliability of all WiFi data. What is the most likely technical cause, and how would you resolve it?
Suggerimento: Consider how modern mobile operating systems handle WiFi network discovery and what this means for MAC-address-based counting.
Visualizza risposta modello
The most likely cause is MAC randomisation. iOS 14+ and Android 10+ devices broadcast randomised MAC addresses when probing for networks. If the analytics platform is counting each unique MAC address as a unique visitor, a single device that moves through the venue over several hours — generating new randomised MACs each time it probes — will be counted multiple times. The resolution is threefold: (1) switch the primary footfall metric to authenticated session counts rather than probe-based device counts; (2) ensure the platform applies a deduplication algorithm to filter randomised MACs; and (3) calibrate the platform's footfall multiplier against the physical door counter data to establish a validated conversion ratio.
Q3. A new anchor tenant — a large department store — is negotiating their lease and demands that the property manager provide monthly reports showing the number of unique visitors who entered the shopping centre specifically via the entrance adjacent to their unit, the average time those visitors spent in the wing containing their store, and the demographic breakdown of those visitors. The current WiFi network provides venue-wide footfall data only. What infrastructure and platform changes are required to meet this requirement?
Suggerimento: Think about the difference between venue-wide aggregate data and zone-specific, entrance-attributed data, and what the analytics platform configuration needs to support.
Visualizza risposta modello
Meeting this requirement involves three changes. First, the AP deployment in the wing adjacent to the anchor tenant must be upgraded to a location-analytics density (one AP per 500 sq ft) to support trilateration and accurate zone assignment. Second, within the analytics platform, specific geofenced zones must be defined for: (a) the entrance corridor adjacent to the anchor tenant, (b) the retail wing containing the anchor tenant, and (c) individual sub-zones within that wing. Third, the captive portal must be configured to capture demographic data (age range, gender, postcode) with explicit GDPR consent, and the platform must be configured to attribute authenticated sessions to the entry zone where the device was first detected. The resulting reports will show entrance-attributed unique visitors, wing dwell time, and demographic breakdowns — all exportable via API to the tenant's own reporting tools.
Continua a leggere questa serie
Privacy by Design: Anonimizzazione dei dati WiFi per la conformità al GDPR
Questa guida autorevole illustra l'architettura tecnica e le strategie di implementazione per l'anonimizzazione dei dati WiFi al fine di garantire la conformità al GDPR. Fornisce a responsabili IT e architetti di rete framework attuabili per bilanciare analisi robuste delle sedi con rigorosi requisiti di privacy dei dati.
Heatmapping vs. Presence Analytics: Differenze Tecniche
Questa guida tecnica autorevole illustra le differenze architettoniche e operative critiche tra il WiFi heatmapping e la presence analytics per gli operatori di sedi aziendali. Fornisce a responsabili IT, architetti di rete e direttori delle operazioni framework di implementazione attuabili, scenari di implementazione reali e best practice neutrali rispetto ai fornitori per massimizzare il ROI dalla loro infrastruttura wireless esistente.
Come Calcolare il Tempo di Permanenza Utilizzando i WiFi Location Analytics
Questa guida fornisce un riferimento tecnico completo per il calcolo del tempo di permanenza WiFi utilizzando i WiFi location analytics, coprendo l'intera architettura dalla cattura delle richieste di probe 802.11 attraverso la trilaterazione basata su RSSI all'analisi delle zone geofenced. È progettata per IT manager, architetti di rete e direttori delle operazioni di sede che necessitano di implementare un'intelligence di localizzazione accurata e scalabile in ambienti di vendita al dettaglio, ospitalità, sanità e settore pubblico. I lettori otterranno indicazioni pratiche sull'implementazione, casi di studio reali e un quadro chiaro per tradurre i dati spaziali grezzi in risultati di business misurabili.