Cos'è il WiFi Analytics? Una Guida Completa
Questa guida tecnica completa spiega come il WiFi analytics trasforma l'infrastruttura di rete standard in un motore di business intelligence, coprendo i meccanismi di acquisizione dei dati (affluenza, tempo di permanenza, tipo di dispositivo, visite ripetute), le considerazioni architettoniche e il ROI misurabile. È progettata per IT manager, architetti di rete e direttori delle operazioni di sede che necessitano di valutare e implementare il WiFi analytics in ambienti aziendali.
Ascolta questa guida
Visualizza trascrizione del podcast
📚 Part of our core series: Marketing & Analytics Platform →
Riepilogo Esecutivo
Per le moderne sedi aziendali, fornire Guest WiFi non è più semplicemente un centro di costo o un'utilità attesa — è uno strato infrastrutturale critico per la business intelligence. WiFi Analytics è il processo di acquisizione, elaborazione e visualizzazione dei dati generati dai dispositivi che si connettono o sondano una rete wireless. Per IT manager, architetti di rete e direttori delle operazioni di sede, l'implementazione di una soluzione di analytics robusta colma il divario tra la spesa IT e il valore aziendale misurabile.
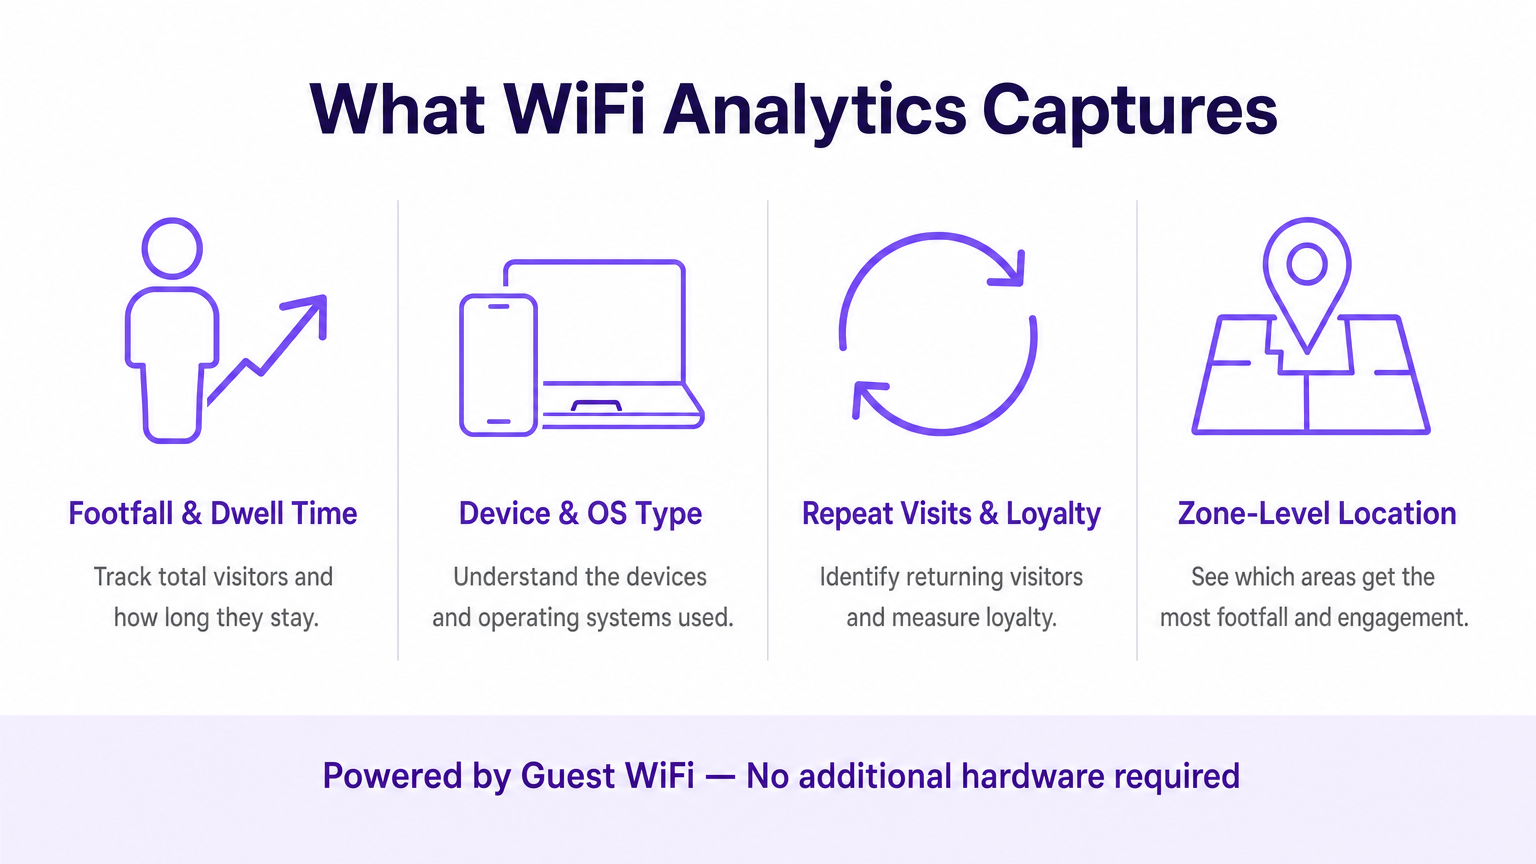
Questa guida descrive in dettaglio l'architettura tecnica della raccolta dati WiFi, le metriche specifiche acquisite — inclusi affluenza, tempo di permanenza, tipo di dispositivo e visite ripetute — e i punti di integrazione necessari per trasformare la telemetria di rete grezza in insight azionabili. Sfruttando l'infrastruttura esistente, sia che si tratti di implementazioni in Retail , Healthcare , Hospitality o Transport , le organizzazioni possono ottenere una profonda visibilità negli spazi fisici senza implementare costose reti di sensori overlay.
Approfondimento Tecnico: Come Funziona il WiFi Analytics
Al suo interno, il WiFi analytics si basa sul comportamento fondamentale dei dispositivi client 802.11. Anche prima che un utente si autentichi a una rete, il suo dispositivo trasmette richieste di sonda per scoprire gli access point (AP) disponibili. Questi frame di gestione, combinati con i dati generati durante le sessioni autenticate, formano i due flussi di dati primari che una piattaforma di WiFi analytics elabora.
I Meccanismi di Acquisizione dei Dati
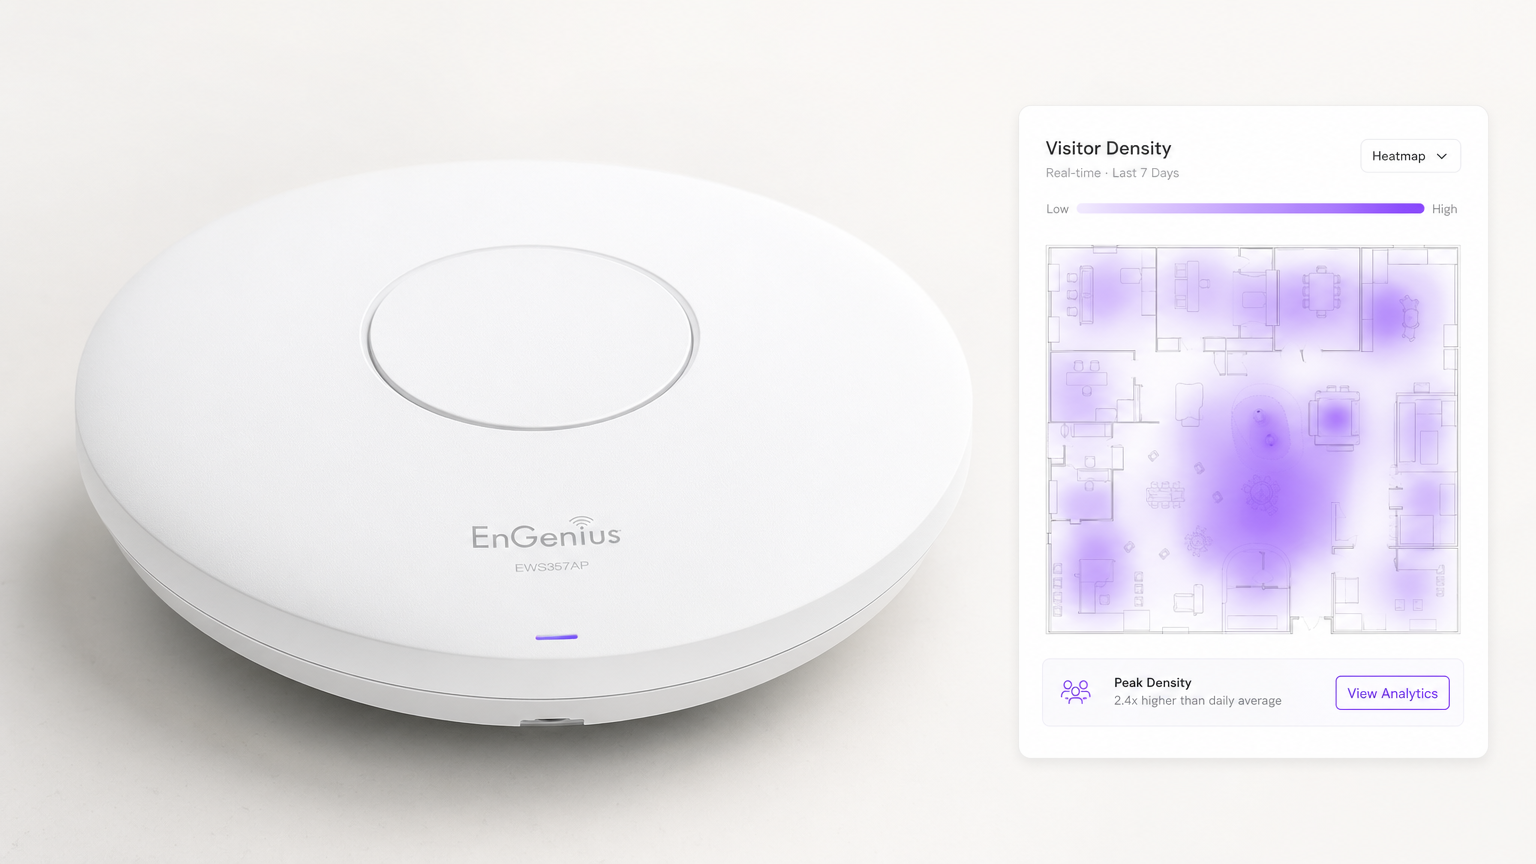
Presence Analytics (Non Autenticato): Quando uno smartphone ha il WiFi abilitato, invia periodicamente richieste di sonda contenenti il suo indirizzo MAC e la potenza del segnale (RSSI). Gli access point rilevano queste sonde. Triangolando l'RSSI attraverso più AP, il sistema calcola la posizione approssimativa del dispositivo all'interno di una sede. Ciò fornisce metriche di base sull'affluenza e sulla conversione — passanti rispetto a visitatori attivi — senza richiedere alcuna interazione da parte dell'utente.
Authenticated Analytics: Quando un utente si connette attivamente al captive portal, il motore di analytics acquisisce dati proprietari ricchi. Ciò include tipicamente informazioni demografiche, dettagli di contatto e identificatori CRM, colmando il divario tra un indirizzo MAC anonimo e un profilo cliente noto e persistente. Questo è lo strato di dati che abilita il marketing personalizzato e i programmi fedeltà.
Location Services (RTLS): Le implementazioni avanzate utilizzano tecniche come Time Difference of Arrival (TDOA) o Fine Timing Measurement (802.11mc/802.11az) per fornire un posizionamento indoor altamente accurato, spesso aumentato da beacon Bluetooth Low Energy (BLE). Per una ripartizione dettagliata di queste tecnologie di posizionamento, consulta la nostra Guida ai Sistemi di Posizionamento Indoor: UWB, BLE, & WiFi .
Architettura e Integrazione
L'architettura tipicamente coinvolge hardware edge — controller LAN wireless e AP — che inoltrano dati di telemetria via API o syslog a un motore di analytics basato su cloud. La piattaforma acquisisce questo flusso di dati ad alta velocità, lo normalizza e applica algoritmi di mappatura spaziale su planimetrie caricate per produrre analytics a livello di zona.
Fondamentalmente, il sistema deve integrarsi perfettamente con lo stack del fornitore di rete esistente. Sia che tu stia valutando Purple vs Cisco Spaces (DNA Spaces): Quando Scegliere Ciascuno o implementando su Aruba, Ruckus o Meraki, la piattaforma di analytics agisce come un overlay — estraendo valore senza richiedere la sostituzione dell'hardware. Questa è una distinzione fondamentale rispetto alle soluzioni proprietarie basate su sensori.
La pipeline di dati segue questo flusso: gli AP catturano le richieste di sonda e gli eventi di connessione → il controller WLAN aggrega e inoltra la telemetria → il motore di analytics normalizza e mappa i dati → la dashboard mostra gli insight ai team operativi e di marketing → i webhook API inviano i profili utente autenticati a CRM e piattaforme di marketing automation.
Standard e Considerazioni sulla Conformità
Le implementazioni devono tenere conto di diversi standard normativi e tecnici:
| Standard | Rilevanza |
|---|---|
| IEEE 802.11ax (Wi-Fi 6/6E) | Fornisce le funzionalità OFDMA e BSS Colouring che migliorano la densità degli AP e la precisione della posizione |
| IEEE 802.11mc / 802.11az | Fine Timing Measurement (FTM) abilita una precisione di misurazione sub-metrica per le implementazioni RTLS |
| WPA3-Enterprise | Obbligatorio per le implementazioni che gestiscono dati sensibili; fornisce la modalità di sicurezza a 192 bit |
| GDPR / UK GDPR | Richiede il consenso esplicito e verificabile prima di acquisire dati personali tramite captive portal |
| PCI DSS | Il traffico Guest WiFi deve essere isolato dalle reti di carte di pagamento tramite VLAN dedicate |
| CCPA | Si applica alle implementazioni che servono residenti in California; richiede meccanismi di opt-out |
Guida all'Implementazione
L'implementazione di una soluzione di WiFi analytics richiede un'attenta coordinazione tra l'ingegneria di rete e gli stakeholder aziendali. I seguenti passaggi rappresentano un framework di implementazione indipendente dal fornitore.
Passaggio 1 — Valutazione della Prontezza della Rete: Valutare la densità e il posizionamento attuali degli AP rispetto ai requisiti di location analytics. Il design di copertura standard (AP centrati nelle stanze) è insufficiente per una triangolazione accurata. Il posizionamento degli AP perimetrali è essenziale. Condurre un'indagine attiva del sito utilizzando strumenti come Ekahau o iBwave peridentificare le zone morte RF e le fonti di interferenza.
Fase 2 — Mappatura della planimetria: Caricare planimetrie accurate e in scala sulla piattaforma di analisi. Definire le zone che si allineano con gli obiettivi aziendali — ad esempio, 'Area Cassa', 'Zona Promozionale di Fine Corsia' o 'Lobby'. La scalatura imprecisa della planimetria è una delle cause più comuni di scarsa qualità dei dati di localizzazione.
Fase 3 — Configurazione del Captive Portal: Progettare il flusso di autenticazione per bilanciare l'esperienza utente con l'acquisizione dei dati. Implementare opzioni di social login (Google, Apple ID) per ridurre l'attrito. Assicurarsi che il portale sia completamente responsive su tutti i tipi di dispositivo. Purple può agire come provider di identità per OpenRoaming con la licenza Connect, consentendo un onboarding senza interruzioni per gli utenti di ritorno senza interazioni ripetute con il portale.
Fase 4 — Framework di Consenso e Privacy: Implementare l'acquisizione del consenso conforme al GDPR. Il consenso deve essere granulare (opt-in separati per analisi, marketing e condivisione con terze parti), esplicito (nessuna casella pre-selezionata) e verificabile (registrazioni con timestamp archiviate per profilo utente).
Fase 5 — Integrazione dei Dati: Configurare webhook e integrazioni API REST per inviare i dati degli utenti autenticati a piattaforme CRM (Salesforce, HubSpot) e strumenti di automazione del marketing (Marketo, Klaviyo). Questo passaggio è quello in cui l'implementazione IT abilita direttamente il ROI del marketing ed è spesso deprioritizzato — non permettete che lo sia.
Fase 6 — Avvisi e Reportistica: Configurare avvisi operativi (ad es. soglie di tempo di permanenza che attivano notifiche al personale) e report automatizzati per gli stakeholder non tecnici. I dati che rimangono in una dashboard IT non generano alcun valore aziendale.
Migliori Pratiche
Mitigazione della Randomizzazione MAC: I sistemi operativi moderni (iOS 14+, Android 10+) utilizzano indirizzi MAC randomizzati per rete. Le piattaforme di analisi devono basarsi su sessioni autenticate e algoritmi di 'behavioural stitching' piuttosto che su indirizzi hardware persistenti per il tracciamento dei visitatori di ritorno. Dare priorità ai tassi di autenticazione del Captive Portal come KPI.
Densità degli AP per la Precisione della Localizzazione: Per la triangolazione di base è richiesto un minimo di tre AP con copertura sovrapposta. Per una precisione inferiore a 3 metri, distribuire gli AP a intervalli di 8-10 metri nelle zone di alto valore. Per RTLS sub-metro, integrare con beacon BLE o implementare hardware compatibile con 802.11az.
Segmentazione della Rete: Isolare il traffico Guest WiFi dalle reti aziendali e di pagamento utilizzando VLAN dedicate, ACL del firewall e filtraggio DNS. Questo è non negoziabile per la conformità PCI DSS e riduce significativamente la superficie di attacco.
Data Governance: Stabilire una chiara politica di conservazione dei dati. La maggior parte dei casi d'uso analitici sono ben serviti da 13 mesi di dati (consentendo il confronto anno su anno). Periodi di conservazione più lunghi aumentano il rischio di conformità e i costi di archiviazione senza un beneficio analitico proporzionale.
Risoluzione dei Problemi e Mitigazione del Rischio
Dati di Localizzazione Imprecisi: Le cause più comuni sono la densità insufficiente degli AP, la scalatura errata della planimetria o l'interferenza RF da reti adiacenti. Convalidare il posizionamento degli AP rispetto al sopralluogo del sito, verificare la scala della planimetria nella piattaforma di analisi e utilizzare gli strumenti di analisi dello spettro nel controller WLAN per identificare le fonti di interferenza.
Bassi Tassi di Autenticazione: Se i visitatori non completano il Captive Portal, verificare il percorso dell'utente. Misurare l'abbandono ad ogni passaggio. Le cause comuni includono tempi di caricamento lenti del portale (ottimizzare per dispositivi mobili su connessioni di fallback 3G/4G), campi dati eccessivi e proposte di valore poco chiare. Effettuare A/B test sul design del portale.
Silos di Dati: La modalità di fallimento più dannosa dal punto di vista commerciale. Creare proattivamente report automatizzati per i team operativi e di marketing. Istituire un gruppo di lavoro interfunzionale 'WiFi Data' con rappresentanti di IT, marketing e operazioni per esaminare le intuizioni mensilmente.
Vendor Lock-In: Evitare piattaforme di analisi che richiedono hardware proprietario. Assicurarsi che la piattaforma supporti il fornitore AP esistente tramite API standard e possa esportare dati in formati aperti (CSV, JSON) per prevenire la dipendenza dall'ecosistema di un singolo fornitore.
ROI e Impatto sul Business
La misura ultima di un'implementazione di analisi WiFi è il suo contributo ai risultati aziendali. Il seguente framework mappa le capacità di analisi a KPI misurabili.
| Capacità di Analisi | KPI di Business | Miglioramento Tipico |
|---|---|---|
| Conteggio presenze | Tracciamento volume visitatori | Sostituisce il conteggio manuale; precisione >99% |
| Tempo di permanenza per zona | Gestione code, allocazione personale | Riduzione del 15–25% dei tempi di attesa di punta |
| Tasso di visite ripetute | Misurazione fedeltà clienti | Base per il ROI del programma fedeltà |
| Tasso di conversione spaziale | Conversione vetrina-porta | Informa l'investimento in display esterni |
| Profili autenticati | Arricchimento CRM, targeting campagne | Miglioramento di 3–5x nella rilevanza delle campagne email |
| Analisi del flusso di zona | Ottimizzazione del layout | Aumento misurabile della spesa secondaria |
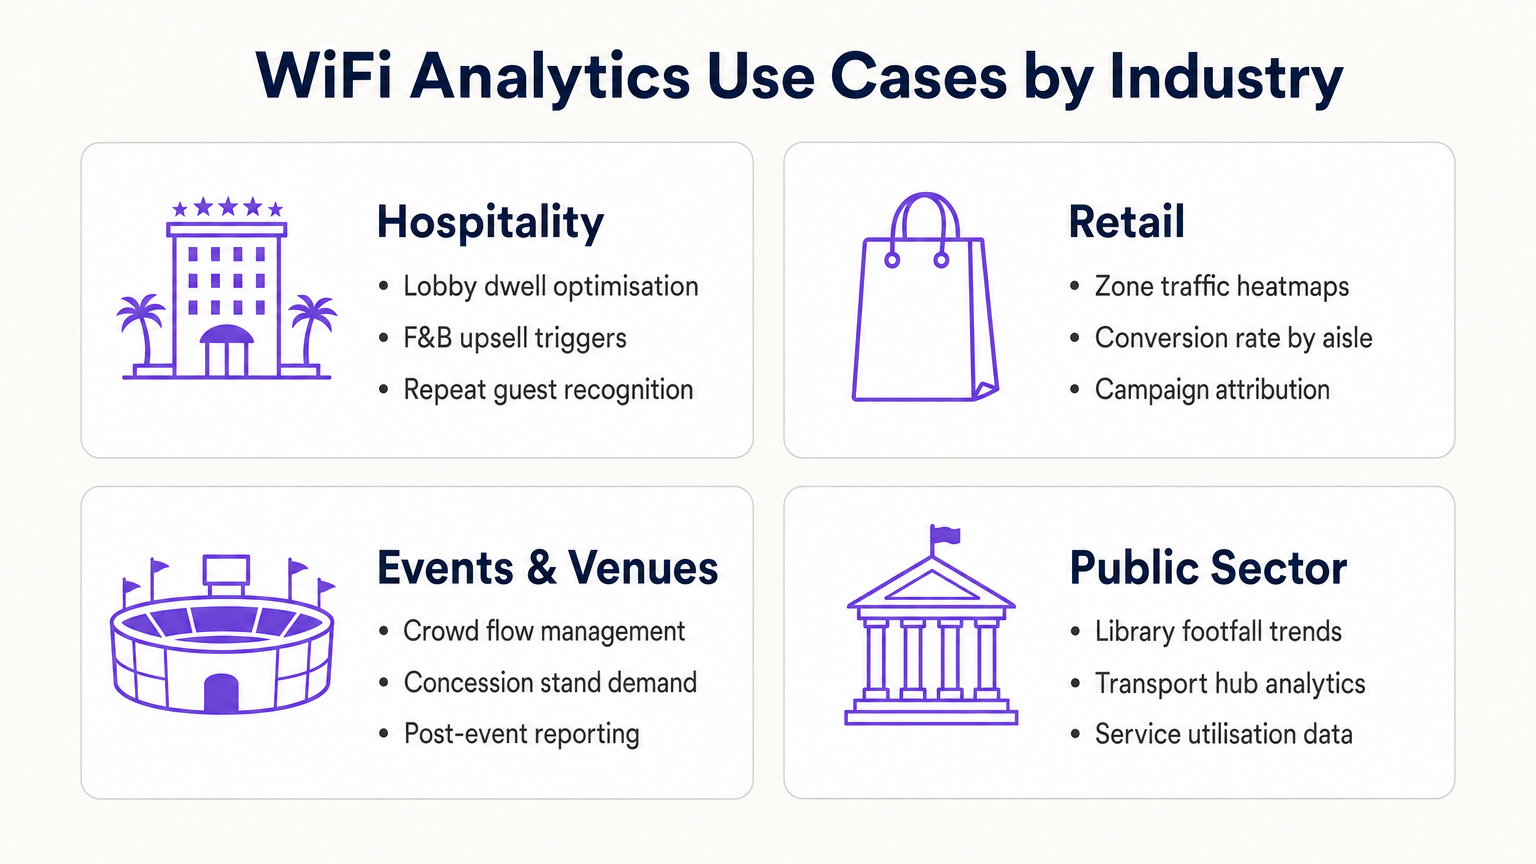
Per gli operatori del settore Hospitality , l'analisi WiFi consente il riconoscimento degli ospiti abituali, la gestione della congestione della lobby e l'attivazione di upsell F&B. Per le catene Retail , fornisce l'ottimizzazione del layout basata su heatmap e l'attribuzione delle campagne. Per gli hub di trasporto e le sedi del settore pubblico, fornisce dati sull'utilizzo dei servizi e la gestione del flusso di persone. Per uno sguardo dettagliato alle applicazioni per sedi connesse, consulta la nostra Architettura dell'Internet delle Cose: Una Guida Completa .
Trattando la rete WiFi come una risorsa dati strategica piuttosto che come una semplice utility, i leader IT passano da gestori di centri di costo a facilitatori di business — fornendo un ROI concreto attraverso una maggiore efficienza operativa, un migliore coinvolgimento dei clienti e un processo decisionale basato su prove.
Definizioni chiave
Probe Request
An 802.11 management frame broadcast by a client device to discover available wireless networks in its vicinity, containing the device's MAC address and supported data rates.
The foundational mechanism for unauthenticated presence analytics. Access points capture these frames to detect and locate devices before any user interaction occurs.
RSSI (Received Signal Strength Indicator)
A measurement of the power level of a received radio signal, expressed in dBm (typically ranging from 0 to -100 dBm).
Analytics platforms use RSSI readings from multiple APs simultaneously to triangulate a device's physical location. Lower (more negative) values indicate greater distance from the AP.
MAC Address Randomisation
A privacy feature in modern operating systems (iOS 14+, Android 10+) that assigns a randomised hardware address to a device on a per-network basis, replacing the device's permanent MAC address.
Significantly limits the reliability of unauthenticated presence analytics for repeat visitor tracking, making captive portal authentication essential for building persistent customer profiles.
Captive Portal
A web-based authentication interface that intercepts a user's HTTP/HTTPS traffic and redirects them to a login or registration page before granting network access.
The primary mechanism for capturing first-party customer data and securing GDPR-compliant consent. Portal design and friction level directly determine data capture rates.
Dwell Time
The duration a specific authenticated or detected device remains within a defined physical zone, measured from first detection to last detection within that zone.
A critical operational metric used to identify queue congestion, measure engagement with promotional displays, and trigger time-based marketing automations.
Footfall
The total count of unique devices detected within a defined venue or zone over a specified time period.
Provides the baseline traffic metric analogous to website sessions. Used to measure overall venue performance, compare locations, and calculate spatial conversion rates.
Spatial Conversion Rate
The percentage of devices detected in an outer zone (e.g., a street or main walkway) that subsequently enter an inner zone (e.g., a store or aisle).
Used by retail operators to evaluate the effectiveness of exterior displays and entrance signage. A low conversion rate despite high footfall indicates an attraction problem at the threshold.
OpenRoaming
A Wireless Broadband Alliance (WBA) federation standard that enables seamless, secure Wi-Fi onboarding across participating networks without requiring repeated captive portal interactions.
Purple can act as an identity provider for OpenRoaming under the Connect licence, enabling venues to offer seamless connectivity while retaining the ability to capture analytics data from returning users.
RTLS (Real-Time Location System)
A system that uses radio frequency technologies (WiFi, BLE, UWB, or RFID) to determine and track the real-time location of objects or people within a defined space.
Relevant when sub-3-metre location accuracy is required — for example, asset tracking in healthcare or turn-by-turn indoor navigation in large venues. Standard WiFi RSSI triangulation is typically insufficient for these use cases.
TDOA (Time Difference of Arrival)
A location technique that calculates position by measuring the difference in the time a signal arrives at multiple reference points (APs or anchors).
Provides significantly higher location accuracy than RSSI-based triangulation, but requires hardware support and precise clock synchronisation across APs.
Esempi pratici
A 400-room resort hotel wants to reduce congestion at check-in desks during peak hours (15:00–17:00) and increase revenue at the lobby bar. The IT team has a Cisco Meraki deployment with 24 APs across the ground floor.
- Map the lobby floor plan in the analytics platform with three distinct zones: 'Check-In Queue', 'Lobby Seating', and 'Bar Area'. Verify that at least three APs provide overlapping coverage in each zone for accurate triangulation.
- Configure a real-time operational alert: if the device count in the 'Check-In Queue' zone exceeds 20 simultaneously AND average dwell time exceeds 15 minutes, trigger an automated SMS to the Duty Manager via the platform's webhook integration.
- Configure a marketing trigger: if a device dwells in the 'Lobby Seating' zone for more than 10 minutes, push a personalised notification (via the captive portal session or email if authenticated) offering a 10% discount at the bar, valid for 30 minutes.
- Integrate the authenticated user profiles with the hotel PMS (Property Management System) to automatically recognise returning guests and suppress the captive portal for them, surfacing a personalised welcome message instead.
- Review weekly dwell time reports to identify whether the check-in queue alert is triggering at consistent times, enabling proactive staffing adjustments rather than reactive responses.
A 50-store retail chain has deployed WiFi analytics across all locations. The Head of Merchandising reports that a specific promotional aisle in their flagship Manchester store generates high footfall but below-average sales per square foot. They want to understand why before rolling out the same layout to 15 other stores.
- Define two zones in the analytics platform for the Manchester store: 'Main Walkway' (the primary traffic artery adjacent to the aisle) and 'Promotional Aisle' (the target zone).
- Pull a 30-day report comparing: (a) the spatial conversion rate — the percentage of devices in the Main Walkway that subsequently enter the Promotional Aisle — and (b) the average dwell time within the Promotional Aisle for devices that do enter.
- Scenario A — High conversion, low dwell time: Visitors are entering the aisle but leaving quickly. This indicates the product placement or signage within the aisle is confusing or unappealing once inside. Recommendation: redesign the aisle layout and test with a 14-day A/B comparison.
- Scenario B — Low conversion despite high walkway traffic: Visitors are not being drawn into the aisle from the walkway. This indicates the end-cap display or entrance signage is ineffective. Recommendation: redesign the entrance display and measure conversion rate change over the following 14 days.
- Correlate the WiFi analytics data with POS transaction data by time-of-day to identify whether dwell time correlates with purchase probability, establishing a venue-specific 'engagement threshold' for future campaign design.
Domande di esercitazione
Q1. A retail client reports that their 'Repeat Visitor' metric has dropped by 40% over the past eight months, despite sales remaining steady and no significant change in marketing activity. Their analytics deployment relies entirely on unauthenticated presence tracking. What is the most likely technical cause, and what is the recommended remediation?
Suggerimento: Consider the timeline of major mobile OS updates and their privacy features.
Visualizza risposta modello
The most likely cause is the progressive adoption of MAC address randomisation across the client's customer base. iOS 14 (released September 2020) and Android 10+ introduced per-network MAC randomisation, causing returning devices to appear as new, unique visitors to presence analytics engines. As the proportion of customers running these OS versions has increased, the repeat visitor metric has degraded. The remediation is to implement a captive portal authentication layer. When users authenticate with a persistent identifier (email address, social login), the analytics platform can build a customer profile tied to that identifier rather than the rotating MAC address. This restores repeat visitor tracking accuracy and simultaneously generates first-party marketing data.
Q2. You are the network architect for a new 80,000-seat stadium. The venue operations team wants WiFi analytics to manage crowd flow through concourse areas and identify concession stand congestion in real time. The IT budget allows for 400 APs. How should you prioritise AP placement to maximise analytics accuracy, and what accuracy level can you realistically expect?
Suggerimento: Think about the geometric requirements of triangulation and the difference between coverage and analytics design principles.
Visualizza risposta modello
Prioritise perimeter placement over central coverage. For each concourse zone, ensure APs are placed at the zone boundaries rather than the centre. This enables the analytics engine to accurately determine when a device crosses from one zone to another. Aim for a minimum of three APs with overlapping coverage in each defined zone, with AP spacing of 8–10 metres in high-priority areas (concession stands, entry/exit gates). With standard RSSI triangulation on 802.11ax hardware, expect 3–5 metre location accuracy in open concourse areas. For sub-3-metre accuracy at specific chokepoints (e.g., individual concession windows), supplement with BLE beacons or deploy 802.11az-capable APs at those locations.
Q3. A hospital IT director wants to use the existing WiFi network to track the location of 200 high-value mobile medical assets (infusion pumps, portable ECG monitors). They do not want to deploy any additional hardware. The analytics platform currently provides 5-metre RSSI triangulation accuracy. Is this deployment viable, and what are the key risks?
Suggerimento: Consider both the technical accuracy requirements and the behaviour of the devices being tracked.
Visualizza risposta modello
This deployment is not reliably viable for two reasons. First, medical equipment frequently enters low-power or sleep states, causing the device to stop broadcasting WiFi probe requests. When a device is not actively probing, it is invisible to the presence analytics engine. This creates gaps in tracking that are unacceptable for asset management. Second, 5-metre RSSI accuracy is insufficient to determine whether an asset is in Room 4A or Room 4B in a typical hospital ward layout. The recommended alternative is a dedicated RTLS solution using active RFID tags or BLE beacons attached to the assets, which actively broadcast at regular intervals regardless of the asset's power state, and which can achieve sub-2-metre accuracy. The existing WiFi infrastructure can serve as the receiver network for BLE beacons, avoiding the need for a completely separate sensor network.
Continua a leggere questa serie
Privacy by Design: Anonimizzazione dei dati WiFi per la conformità al GDPR
Questa guida autorevole illustra l'architettura tecnica e le strategie di implementazione per l'anonimizzazione dei dati WiFi al fine di garantire la conformità al GDPR. Fornisce a responsabili IT e architetti di rete framework attuabili per bilanciare analisi robuste delle sedi con rigorosi requisiti di privacy dei dati.
Heatmapping vs. Presence Analytics: Differenze Tecniche
Questa guida tecnica autorevole illustra le differenze architettoniche e operative critiche tra il WiFi heatmapping e la presence analytics per gli operatori di sedi aziendali. Fornisce a responsabili IT, architetti di rete e direttori delle operazioni framework di implementazione attuabili, scenari di implementazione reali e best practice neutrali rispetto ai fornitori per massimizzare il ROI dalla loro infrastruttura wireless esistente.
Come Calcolare il Tempo di Permanenza Utilizzando i WiFi Location Analytics
Questa guida fornisce un riferimento tecnico completo per il calcolo del tempo di permanenza WiFi utilizzando i WiFi location analytics, coprendo l'intera architettura dalla cattura delle richieste di probe 802.11 attraverso la trilaterazione basata su RSSI all'analisi delle zone geofenced. È progettata per IT manager, architetti di rete e direttori delle operazioni di sede che necessitano di implementare un'intelligence di localizzazione accurata e scalabile in ambienti di vendita al dettaglio, ospitalità, sanità e settore pubblico. I lettori otterranno indicazioni pratiche sull'implementazione, casi di studio reali e un quadro chiaro per tradurre i dati spaziali grezzi in risultati di business misurabili.