WiFi per i Passeggeri: Come gli Operatori di Trasporto Utilizzano i Dati WiFi per Comprendere i Percorsi
Questa guida tecnica spiega come gli operatori di trasporto sfruttano l'infrastruttura WiFi per i passeggeri per acquisire analisi operative. Copre l'architettura tecnica, le migliori pratiche di implementazione e le applicazioni reali per misurare l'affluenza, il tempo di permanenza e i modelli di viaggio.
Ascolta questa guida
Visualizza trascrizione del podcast

Riepilogo Esecutivo
Per gli operatori di trasporto—che gestiscano reti ferroviarie interurbane, flotte di autobus urbani o servizi di traghetto marittimi—il WiFi per i passeggeri è spesso visto strettamente come un costo operativo o un servizio per i passeggeri. Tuttavia, se integrata con un livello di analisi di livello enterprise, questa infrastruttura esistente si trasforma in un potente strumento di intelligence operativa. Acquisendo i metadati di connessione dei dispositivi, gli operatori possono mappare l'affluenza dei passeggeri, misurare i tempi di permanenza nelle zone delle stazioni e tracciare i modelli di viaggio senza fare affidamento esclusivamente sui dati di biglietteria.
Questa guida fornisce a responsabili IT, architetti di rete e direttori delle operazioni un framework pratico per l'implementazione e l'utilizzo dell'analisi WiFi per i passeggeri. Esploriamo l'architettura tecnica sottostante necessaria per acquisire i segnali dei dispositivi in modo sicuro, i casi d'uso operativi che offrono un ROI misurabile e i requisiti di conformità necessari per elaborare questi dati all'interno dei framework GDPR e di protezione dei dati.
Ascolta il briefing del nostro consulente senior su questo argomento:
Approfondimento Tecnico: Architettura e Flusso di Dati
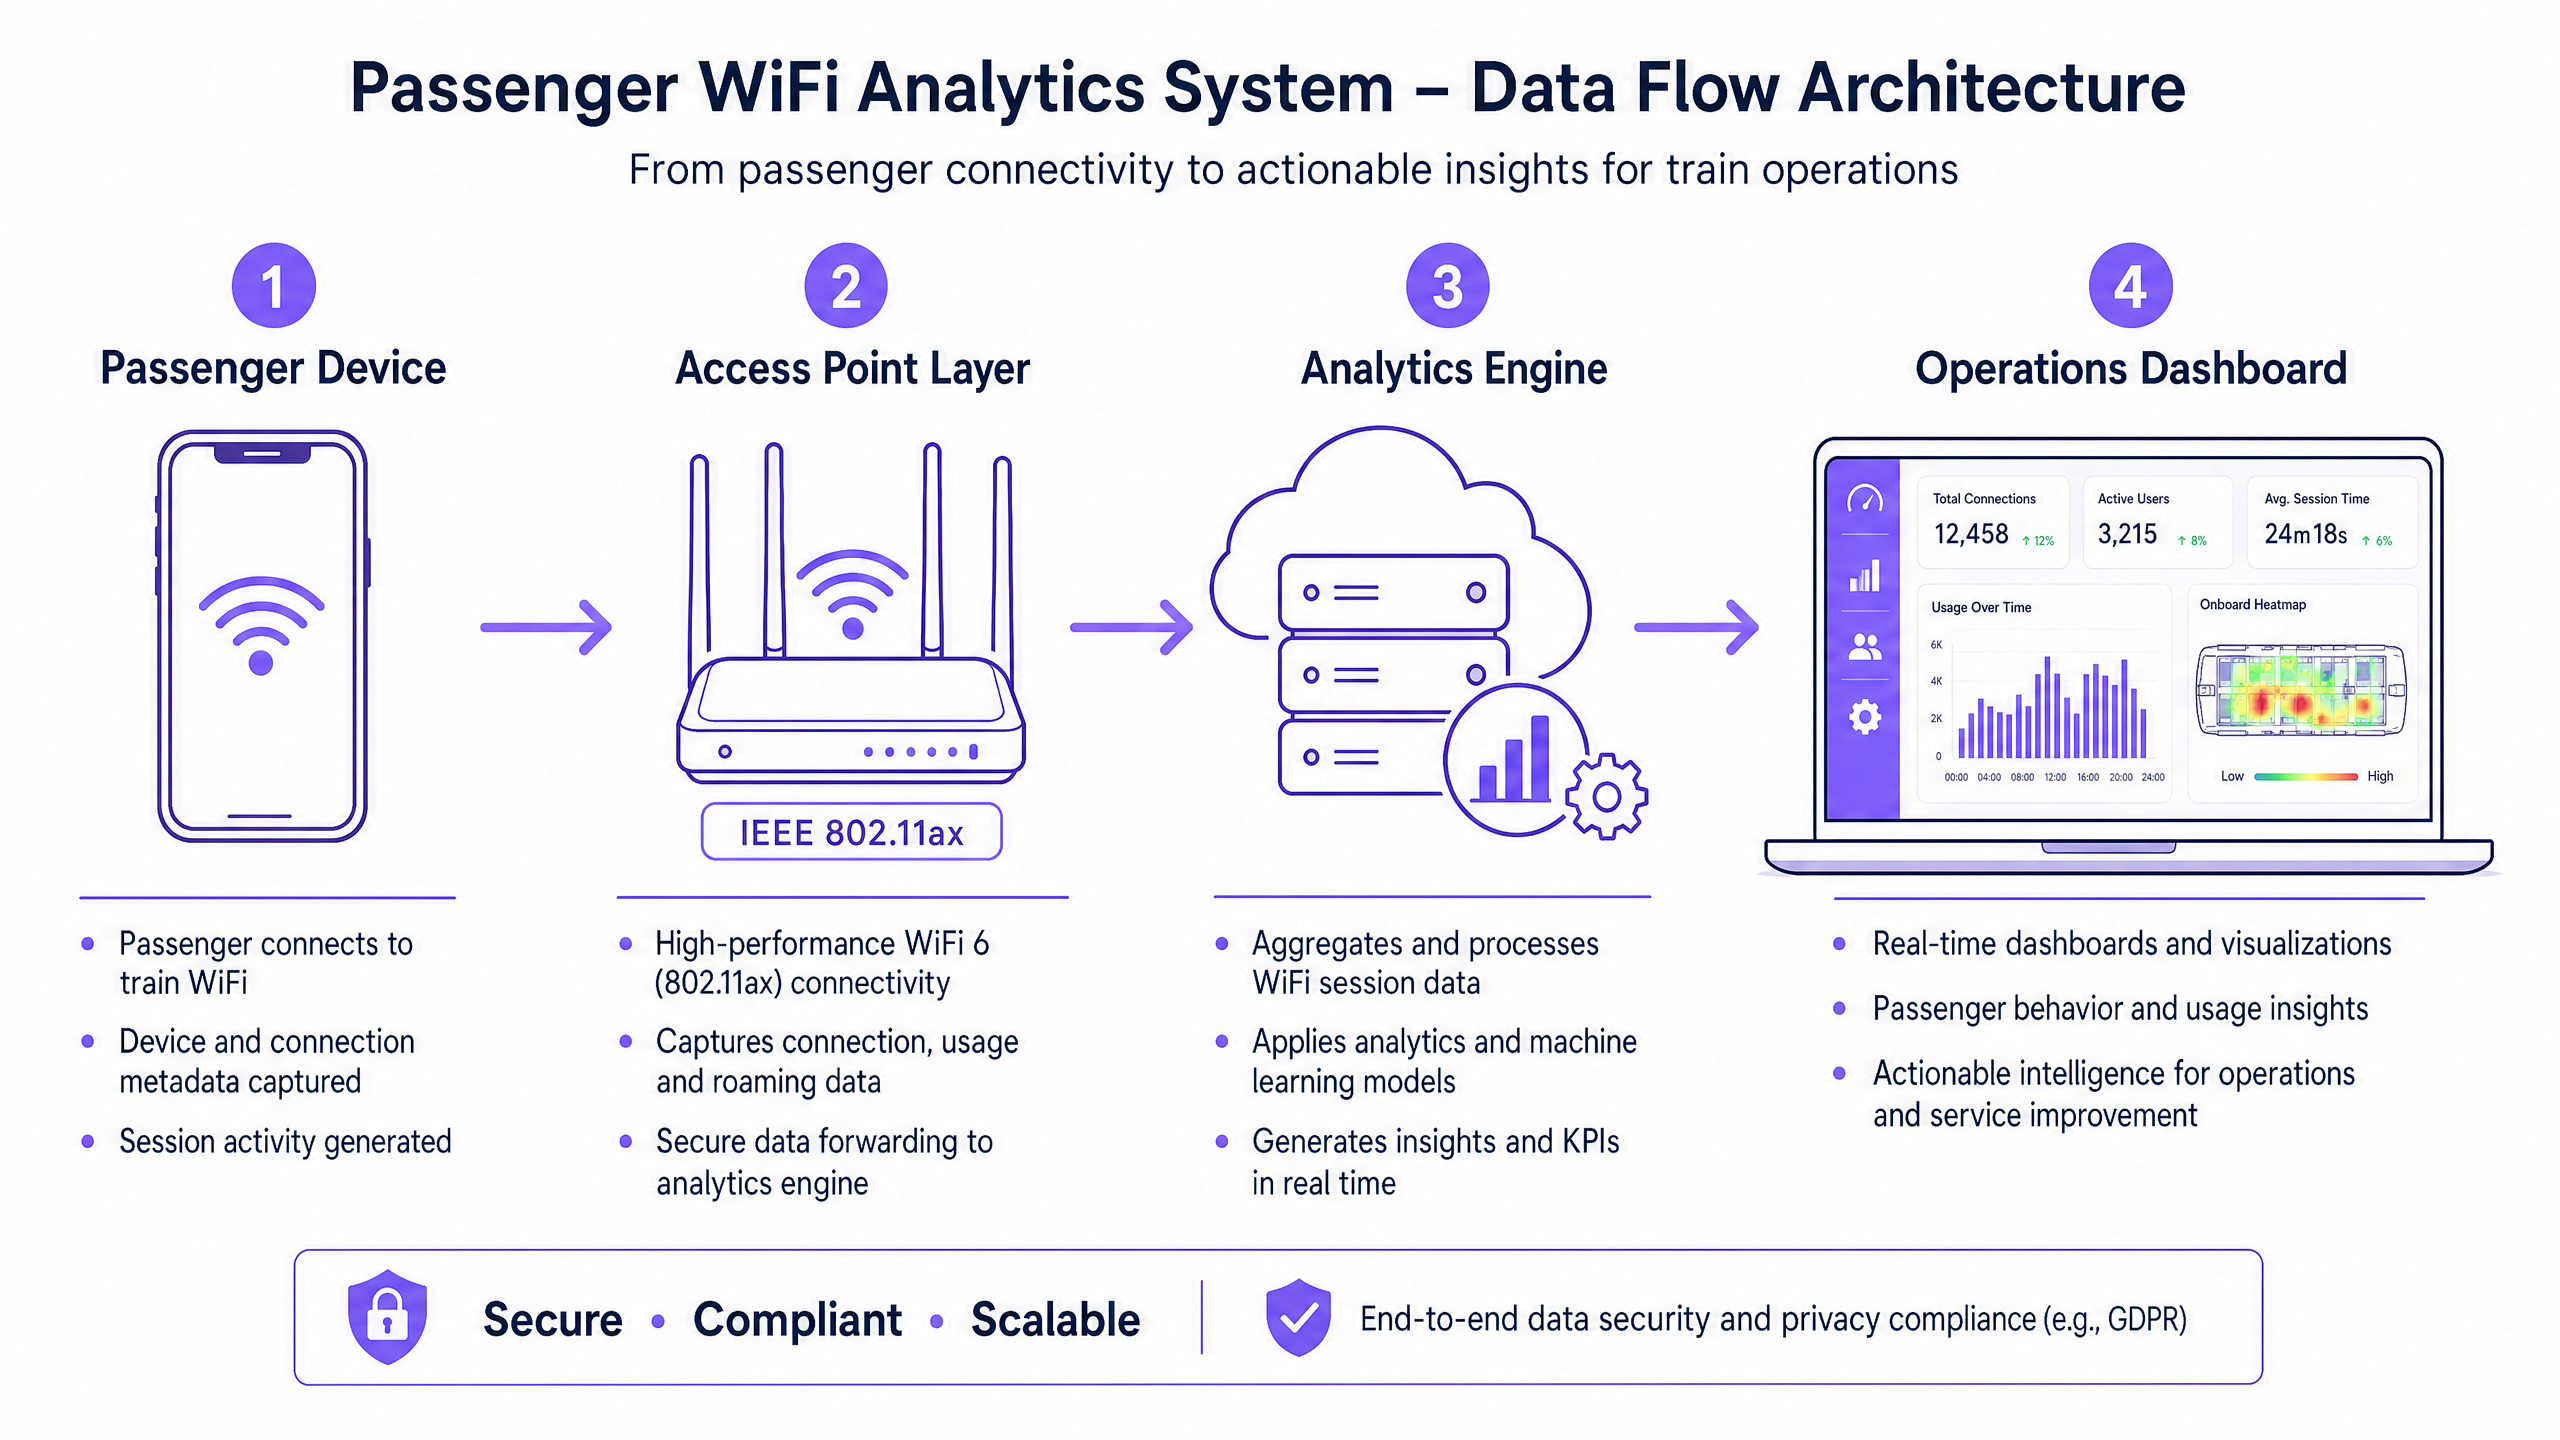
La base di qualsiasi capacità di analisi WiFi per i passeggeri è la capacità della rete di acquisire ed elaborare i metadati dei dispositivi in modo sicuro. L'architettura tipicamente consiste di quattro livelli principali:
- Livello Access Point (Edge): Hardware fisico distribuito tra stazioni e materiale rotabile. Le implementazioni moderne che sfruttano IEEE 802.11ax (WiFi 6) forniscono supporto client ad alta densità e acquisiscono metadati essenziali inclusi indirizzi MAC, potenza del segnale (RSSI) e timestamp di connessione.
- Livello di Raccolta Dati (Controller): Un controller centralizzato gestito in cloud aggrega i log di sessione grezzi e gli handoff di roaming dal livello access point.
- Motore di Analisi: Piattaforme come il livello WiFi Analytics di Purple elaborano i log grezzi, applicando modelli di machine learning per filtrare i dispositivi del personale e i segnali transitori, trasformando i dati grezzi in metriche significative (ad esempio, tempo di permanenza, affluenza).
- Dashboard Operativo: Il livello di visualizzazione dove i pianificatori di rete e i gestori delle stazioni consultano le informazioni tramite dashboard e mappe di calore in tempo reale.
Superare la Randomizzazione MAC
Una sfida tecnica critica nell'analisi WiFi moderna è la randomizzazione degli indirizzi MAC. Da iOS 14 e Android 10, i dispositivi randomizzano i loro indirizzi MAC per rete per migliorare la privacy. Sebbene ciò non influisca sulle metriche aggregate di affluenza o tempo di permanenza (poiché la sessione rimane coerente durante una singola visita), limita la capacità di tracciare i visitatori ricorrenti in modo anonimo nel tempo.
La soluzione architetturale è il Guest WiFi autenticato. Instradando gli utenti attraverso un Captive Portal che richiede autenticazione (ad esempio, email o login social), il sistema crea un profilo utente persistente e con consenso. Questo profilo ancora i dati della sessione a un utente noto, aggirando le limitazioni della randomizzazione MAC e mantenendo una rigorosa conformità con le normative sulla protezione dei dati.
Guida all'Implementazione: Dall'Infrastruttura alle Insight
L'implementazione dell'analisi WiFi per i passeggeri richiede un approccio strutturato per garantire l'accuratezza dei dati e la sicurezza della rete.
- Condurre Audit RF Completi: L'accuratezza dell'analisi dipende interamente dalla copertura di rete. Le zone morte nelle aree di transito delle stazioni o sulle piattaforme comportano sessioni interrotte e dati di viaggio frammentati. Condurre indagini RF approfondite sul sito per garantire una copertura contigua in tutte le zone passeggeri.
- Standardizzare l'Integrazione dei Dati: Le reti di trasporto spesso presentano hardware eterogeneo (ad esempio, Cisco Meraki nelle stazioni, diversi fornitori sul materiale rotabile). Implementare un livello API indipendente dal fornitore per normalizzare i log di sessione prima che raggiungano il motore di analisi.
- Implementare Controlli di Sicurezza Robusti: Le reti rivolte ai passeggeri sono superfici di attacco ad alto rischio. Applicare WPA3 dove la compatibilità client lo consente, implementare un rigoroso isolamento client (isolamento Layer 2) per prevenire movimenti laterali tra i dispositivi dei passeggeri e implementare il filtraggio DNS per bloccare i domini dannosi. Per maggiori informazioni sulla sicurezza di questi ambienti, consulta la nostra guida Proteggi la Tua Rete con DNS e Sicurezza Robusti .
- Definire l'Architettura Zonale: Segmentare le posizioni fisiche in zone logiche (ad esempio, atrio, area commerciale, piattaforma). Ciò consente un'analisi granulare del tempo di permanenza, permettendo agli operatori di distinguere tra un passeggero che naviga in una zona commerciale e uno che attende su una piattaforma durante un ritardo del servizio.
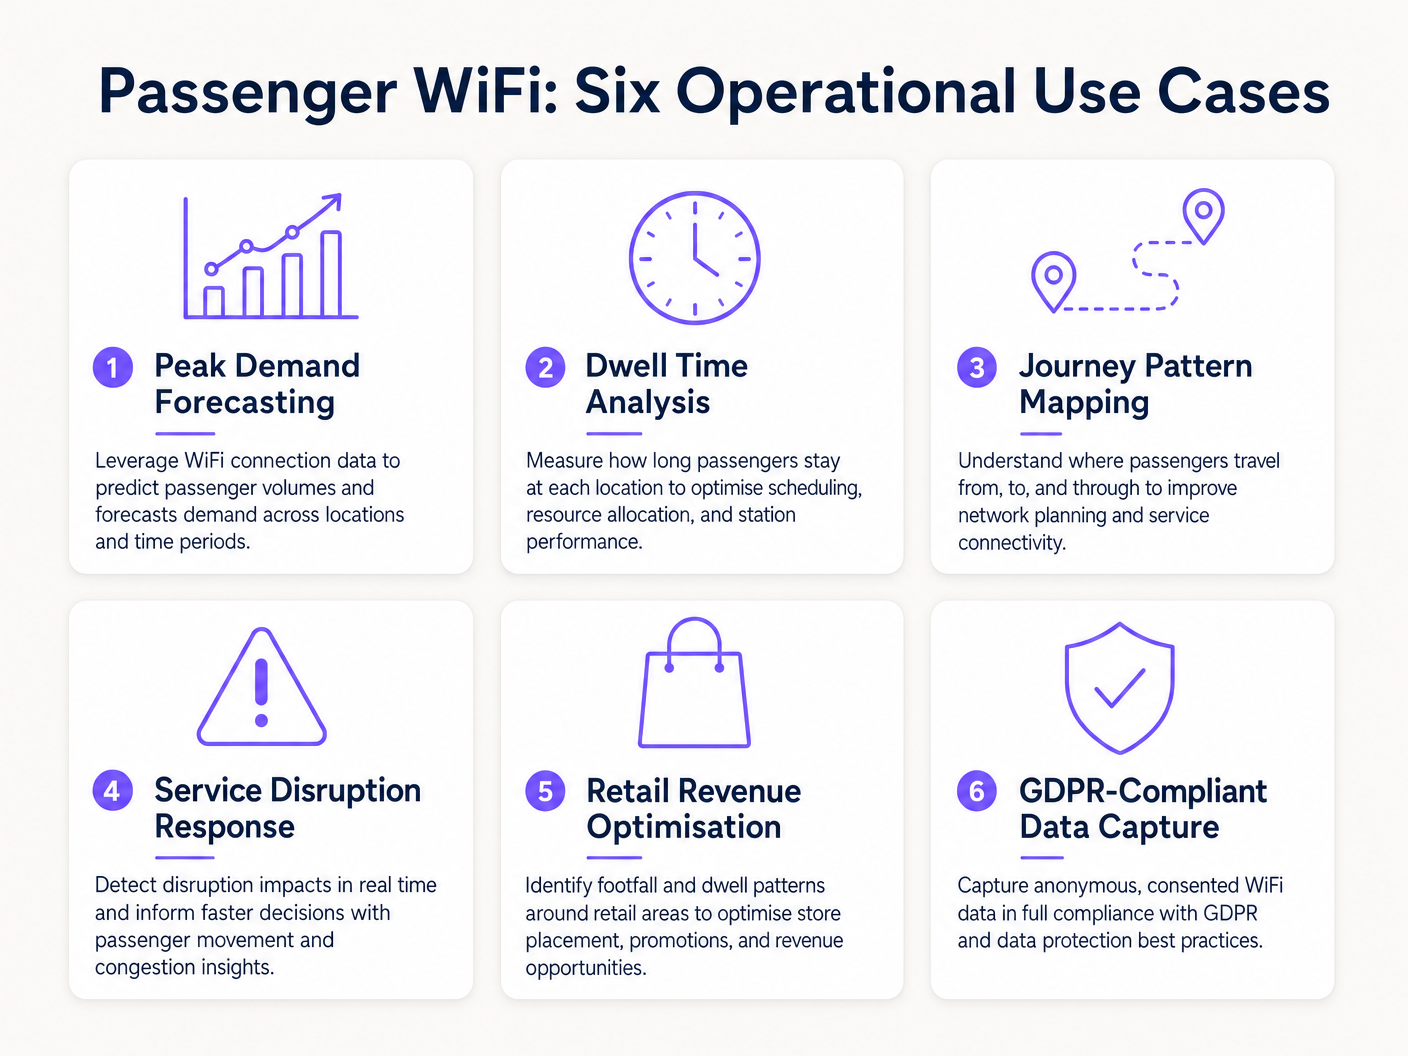
Migliori Pratiche e Casi d'Uso Operativi
Gli operatori di trasporto stanno sfruttando l'analisi WiFi per aumentare l'efficienza in più domini operativi. Similmente a come le strutture nei settori Retail e Hospitality utilizzano i dati sull'affluenza per ottimizzare il personale, gli operatori di trasporto utilizzano queste informazioni per gestire la domanda di punta.
Caso di Studio Reale: Rete Ferroviaria Intercity
Un importante operatore ferroviario intercity del Regno Unito ha implementato l'analisi WiFi in dodici stazioni terminali per affrontare la congestione delle piattaforme. Correlendo i picchi di connessione WiFi con gli orari di partenza dei treni, il team operativo ha identificato che specifiche piattaforme sperimentavano un affollamento pericoloso 40 minuti prima della partenzI dati hanno rivelato che i passeggeri arrivavano prima del previsto a causa di una segnaletica digitale poco chiara nell'atrio principale. Regolando la tempistica degli annunci sui tabelloni delle partenze, l'operatore ha fluidificato il flusso di passeggeri, riducendo la densità di picco sulle banchine del 22% e migliorando la sicurezza generale.
Caso di Studio Reale: Operazioni del Terminal dei Traghetti
Un operatore di traghetti regionale che gestisce un elevato volume di traffico estivo ha utilizzato l'analisi del tempo di permanenza (dwell time) del WiFi per ottimizzare la propria strategia di vendita al dettaglio nel terminal. La dashboard di analisi ha evidenziato che i passeggeri in attesa di traversate ritardate avevano un tempo di permanenza medio di 45 minuti nel terminal, ma solo il 12% entrava nella zona commerciale secondaria. Riposizionando la segnaletica digitale e attivando notifiche push automatiche tramite il captive portal che offrivano uno sconto sul caffè durante i ritardi, l'operatore ha aumentato la conversione al dettaglio del 18% durante gli eventi di interruzione.
Risoluzione dei Problemi e Mitigazione del Rischio
Quando si implementano le analisi WiFi per i passeggeri, i team IT devono mitigare diverse modalità di fallimento comuni:
- Diluizione dei Dati dai Dispositivi del Personale: La mancata esclusione dei dispositivi del personale (ad es. squadre di pulizia, personale di vendita al dettaglio) distorce significativamente le metriche del tempo di permanenza. Implementare un rigoroso filtraggio degli indirizzi MAC o SSID dedicati per il personale per garantire che i dati dei passeggeri rimangano puliti.
- Mancanze di Conformità: L'acquisizione dei dati del dispositivo senza consenso esplicito o una base giuridica documentata viola il GDPR. Assicurarsi che il captive portal articoli chiaramente la politica di elaborazione dei dati e acquisisca il consenso esplicito ove richiesto.
- Colli di Bottiglia del Backhaul: I sistemi di bordo che si affidano al backhaul cellulare (LTE/5G) spesso soffrono di vincoli di larghezza di banda. Assicurarsi che l'architettura memorizzi i dati analitici localmente durante le interruzioni di connettività e si sincronizzi in modo asincrono per prevenire la perdita di dati senza influire sulla velocità di navigazione dei passeggeri.
ROI e Impatto sul Business
Il ritorno sull'investimento per l'analisi WiFi dei passeggeri si estende ben oltre il dipartimento IT. Trattando la rete come una risorsa di intelligence, gli operatori possono:
- Ottimizzare l'Allocazione delle Risorse: Allineare il personale della stazione, gli orari di pulizia e le pattuglie di sicurezza con dati empirici sul flusso di persone anziché con orari statici.
- Aumentare i Ricavi del Dettaglio: Fornire ai locatari commerciali metriche accurate sul flusso di persone e sulla conversione, giustificando tariffe di locazione premium nelle zone ad alto traffico.
- Migliorare l'Esperienza dei Passeggeri: Identificare i punti di attrito nel percorso della stazione e gestire proattivamente l'affollamento, proprio come il settore Healthcare utilizza tecnologie simili per comprendere il flusso dei pazienti. Per un contesto sulle applicazioni intersettoriali, vedere How WiFi Can Improve Patient Experience in Hospitals .
Integrando l'analisi WiFi nella strategia operativa centrale, gli operatori di trasporto nel settore Transport possono passare da una gestione reattiva a una erogazione di servizi proattiva e basata sui dati.
Definizioni chiave
MAC Address Randomisation
A privacy feature in modern operating systems (iOS, Android) that generates a temporary, random MAC address for each WiFi network the device connects to.
IT teams must account for this as it prevents the tracking of repeat visitors using only hardware identifiers, necessitating captive portal authentication.
Dwell Time
The total duration a device remains connected or visible to the WiFi network within a specific physical zone.
Used by operations directors to measure how long passengers wait on platforms or spend in retail areas, directly impacting commercial and safety planning.
Captive Portal
A web page that users must view and interact with before being granted access to a public WiFi network.
The primary mechanism for capturing user consent, enforcing terms of service, and collecting first-party marketing data.
IEEE 802.11ax (WiFi 6)
The current standard for wireless networks, designed to improve performance in high-density environments.
Essential for transport hubs like stadiums and train stations where thousands of devices attempt to connect simultaneously.
RSSI (Received Signal Strength Indicator)
A measurement of the power present in a received radio signal.
Analytics engines use RSSI values from multiple access points to triangulate a device's physical location within a venue.
Client Isolation
A security feature that prevents devices connected to the same WiFi network from communicating directly with each other.
Critical for public passenger WiFi to prevent malicious actors from scanning or attacking other users' devices on the network.
Footfall
The total number of unique devices detected by the WiFi network within a specific timeframe.
Provides station managers with an accurate proxy for total passenger volume, independent of ticket sales.
Cellular Backhaul
The use of cellular networks (LTE/5G) to connect a local WiFi network (like on a bus or train) back to the internet.
The primary ongoing operational cost (OPEX) for onboard WiFi deployments, requiring careful bandwidth management.
Esempi pratici
A major train station operator is experiencing severe congestion on Platform 4 during the evening peak. They need to understand where these passengers are originating from within the station (e.g., main concourse vs. retail zone) to improve flow.
- Deploy high-density IEEE 802.11ax access points across the concourse, retail zones, and Platform 4 to ensure contiguous coverage.
- Configure the analytics platform to define logical 'Zones' for each area.
- Analyse the 'Zone-to-Zone Transition' reports in the analytics dashboard during the 16:00-19:00 window.
- Identify the primary origin zones for devices arriving at Platform 4.
- If the data shows a bottleneck originating from the retail zone corridor, operations can deploy staff to redirect flow or update digital signage to route passengers through a secondary concourse entrance.
A regional bus operator wants to offer free onboard WiFi but needs to justify the cellular backhaul costs to the commercial director by capturing marketing data.
- Implement a cloud-managed captive portal for the onboard WiFi network.
- Configure the portal to require authentication via email or social login (e.g., Facebook, Google).
- Ensure the portal includes a clear, GDPR-compliant privacy notice and opt-in checkboxes for marketing communications.
- Integrate the captive portal data capture directly with the operator's CRM or email marketing platform via API.
- Track the volume of new marketing opt-ins generated per route and calculate the equivalent cost-per-acquisition (CPA) to justify the backhaul OPEX.
Domande di esercitazione
Q1. Your ferry terminal has deployed WiFi analytics, but the average dwell time in the main waiting lounge is reporting as 8.5 hours, which is impossible given your sailing schedule. What is the most likely cause and how do you fix it?
Suggerimento: Consider what other devices might be permanently located in or near the waiting lounge.
Visualizza risposta modello
The analytics engine is likely capturing static devices (e.g., smart TVs, digital signage, point-of-sale systems) or staff devices that remain in the lounge all day. The solution is to identify the MAC addresses of these known devices and configure the analytics platform to filter them out of the dataset.
Q2. A bus operator wants to track how many passengers travel the full length of a specific route versus hopping off early. They are relying purely on anonymous MAC address tracking from the onboard access point. Why might this data be inaccurate?
Suggerimento: Think about how modern smartphones handle network connections to protect privacy.
Visualizza risposta modello
Modern smartphones use MAC address randomisation. While connected to the bus WiFi, the session is tracked accurately. However, if a device disconnects (e.g., goes to sleep) and reconnects later on the route, it may present a new MAC address, making it appear as a new passenger rather than a continuing journey. Implementing a captive portal for authentication is required to track persistent journeys accurately.
Q3. You are deploying WiFi across a large train station with a high-density concourse. To ensure secure data capture and protect passengers, what two critical network security configurations must be enabled on the public SSID?
Suggerimento: One prevents devices from talking to each other; the other prevents access to malicious sites.
Visualizza risposta modello
- Client Isolation (Layer 2 isolation) must be enabled to prevent passenger devices from communicating with or attacking each other on the local network. 2. DNS Filtering should be deployed to block access to known malicious domains, phishing sites, and inappropriate content.
Continua a leggere questa serie
Privacy by Design: Anonimizzazione dei dati WiFi per la conformità al GDPR
Questa guida autorevole illustra l'architettura tecnica e le strategie di implementazione per l'anonimizzazione dei dati WiFi al fine di garantire la conformità al GDPR. Fornisce a responsabili IT e architetti di rete framework attuabili per bilanciare analisi robuste delle sedi con rigorosi requisiti di privacy dei dati.
Heatmapping vs. Presence Analytics: Differenze Tecniche
Questa guida tecnica autorevole illustra le differenze architettoniche e operative critiche tra il WiFi heatmapping e la presence analytics per gli operatori di sedi aziendali. Fornisce a responsabili IT, architetti di rete e direttori delle operazioni framework di implementazione attuabili, scenari di implementazione reali e best practice neutrali rispetto ai fornitori per massimizzare il ROI dalla loro infrastruttura wireless esistente.
Come Calcolare il Tempo di Permanenza Utilizzando i WiFi Location Analytics
Questa guida fornisce un riferimento tecnico completo per il calcolo del tempo di permanenza WiFi utilizzando i WiFi location analytics, coprendo l'intera architettura dalla cattura delle richieste di probe 802.11 attraverso la trilaterazione basata su RSSI all'analisi delle zone geofenced. È progettata per IT manager, architetti di rete e direttori delle operazioni di sede che necessitano di implementare un'intelligence di localizzazione accurata e scalabile in ambienti di vendita al dettaglio, ospitalità, sanità e settore pubblico. I lettori otterranno indicazioni pratiche sull'implementazione, casi di studio reali e un quadro chiaro per tradurre i dati spaziali grezzi in risultati di business misurabili.