Heatmapping vs Presence Analytics: Technical Differences
This authoritative technical guide details the critical architectural and operational differences between WiFi heatmapping and presence analytics for enterprise venue operators. It provides IT leaders, network architects, and operations directors with actionable deployment frameworks, real-world implementation scenarios, and vendor-neutral best practices for extracting maximum ROI from their existing wireless infrastructure.
Listen to this guide
View podcast transcript
執行摘要
對於管理複雜實體場域的企業 IT 團隊而言,理解 WiFi 熱圖(heatmapping)與存在分析(presence analytics)之間的區別已不再是可有可無的選項。雖然這兩者在行銷文獻中經常被混為一談,但它們在根本上是服務於不同營運任務的截然不同的技術。
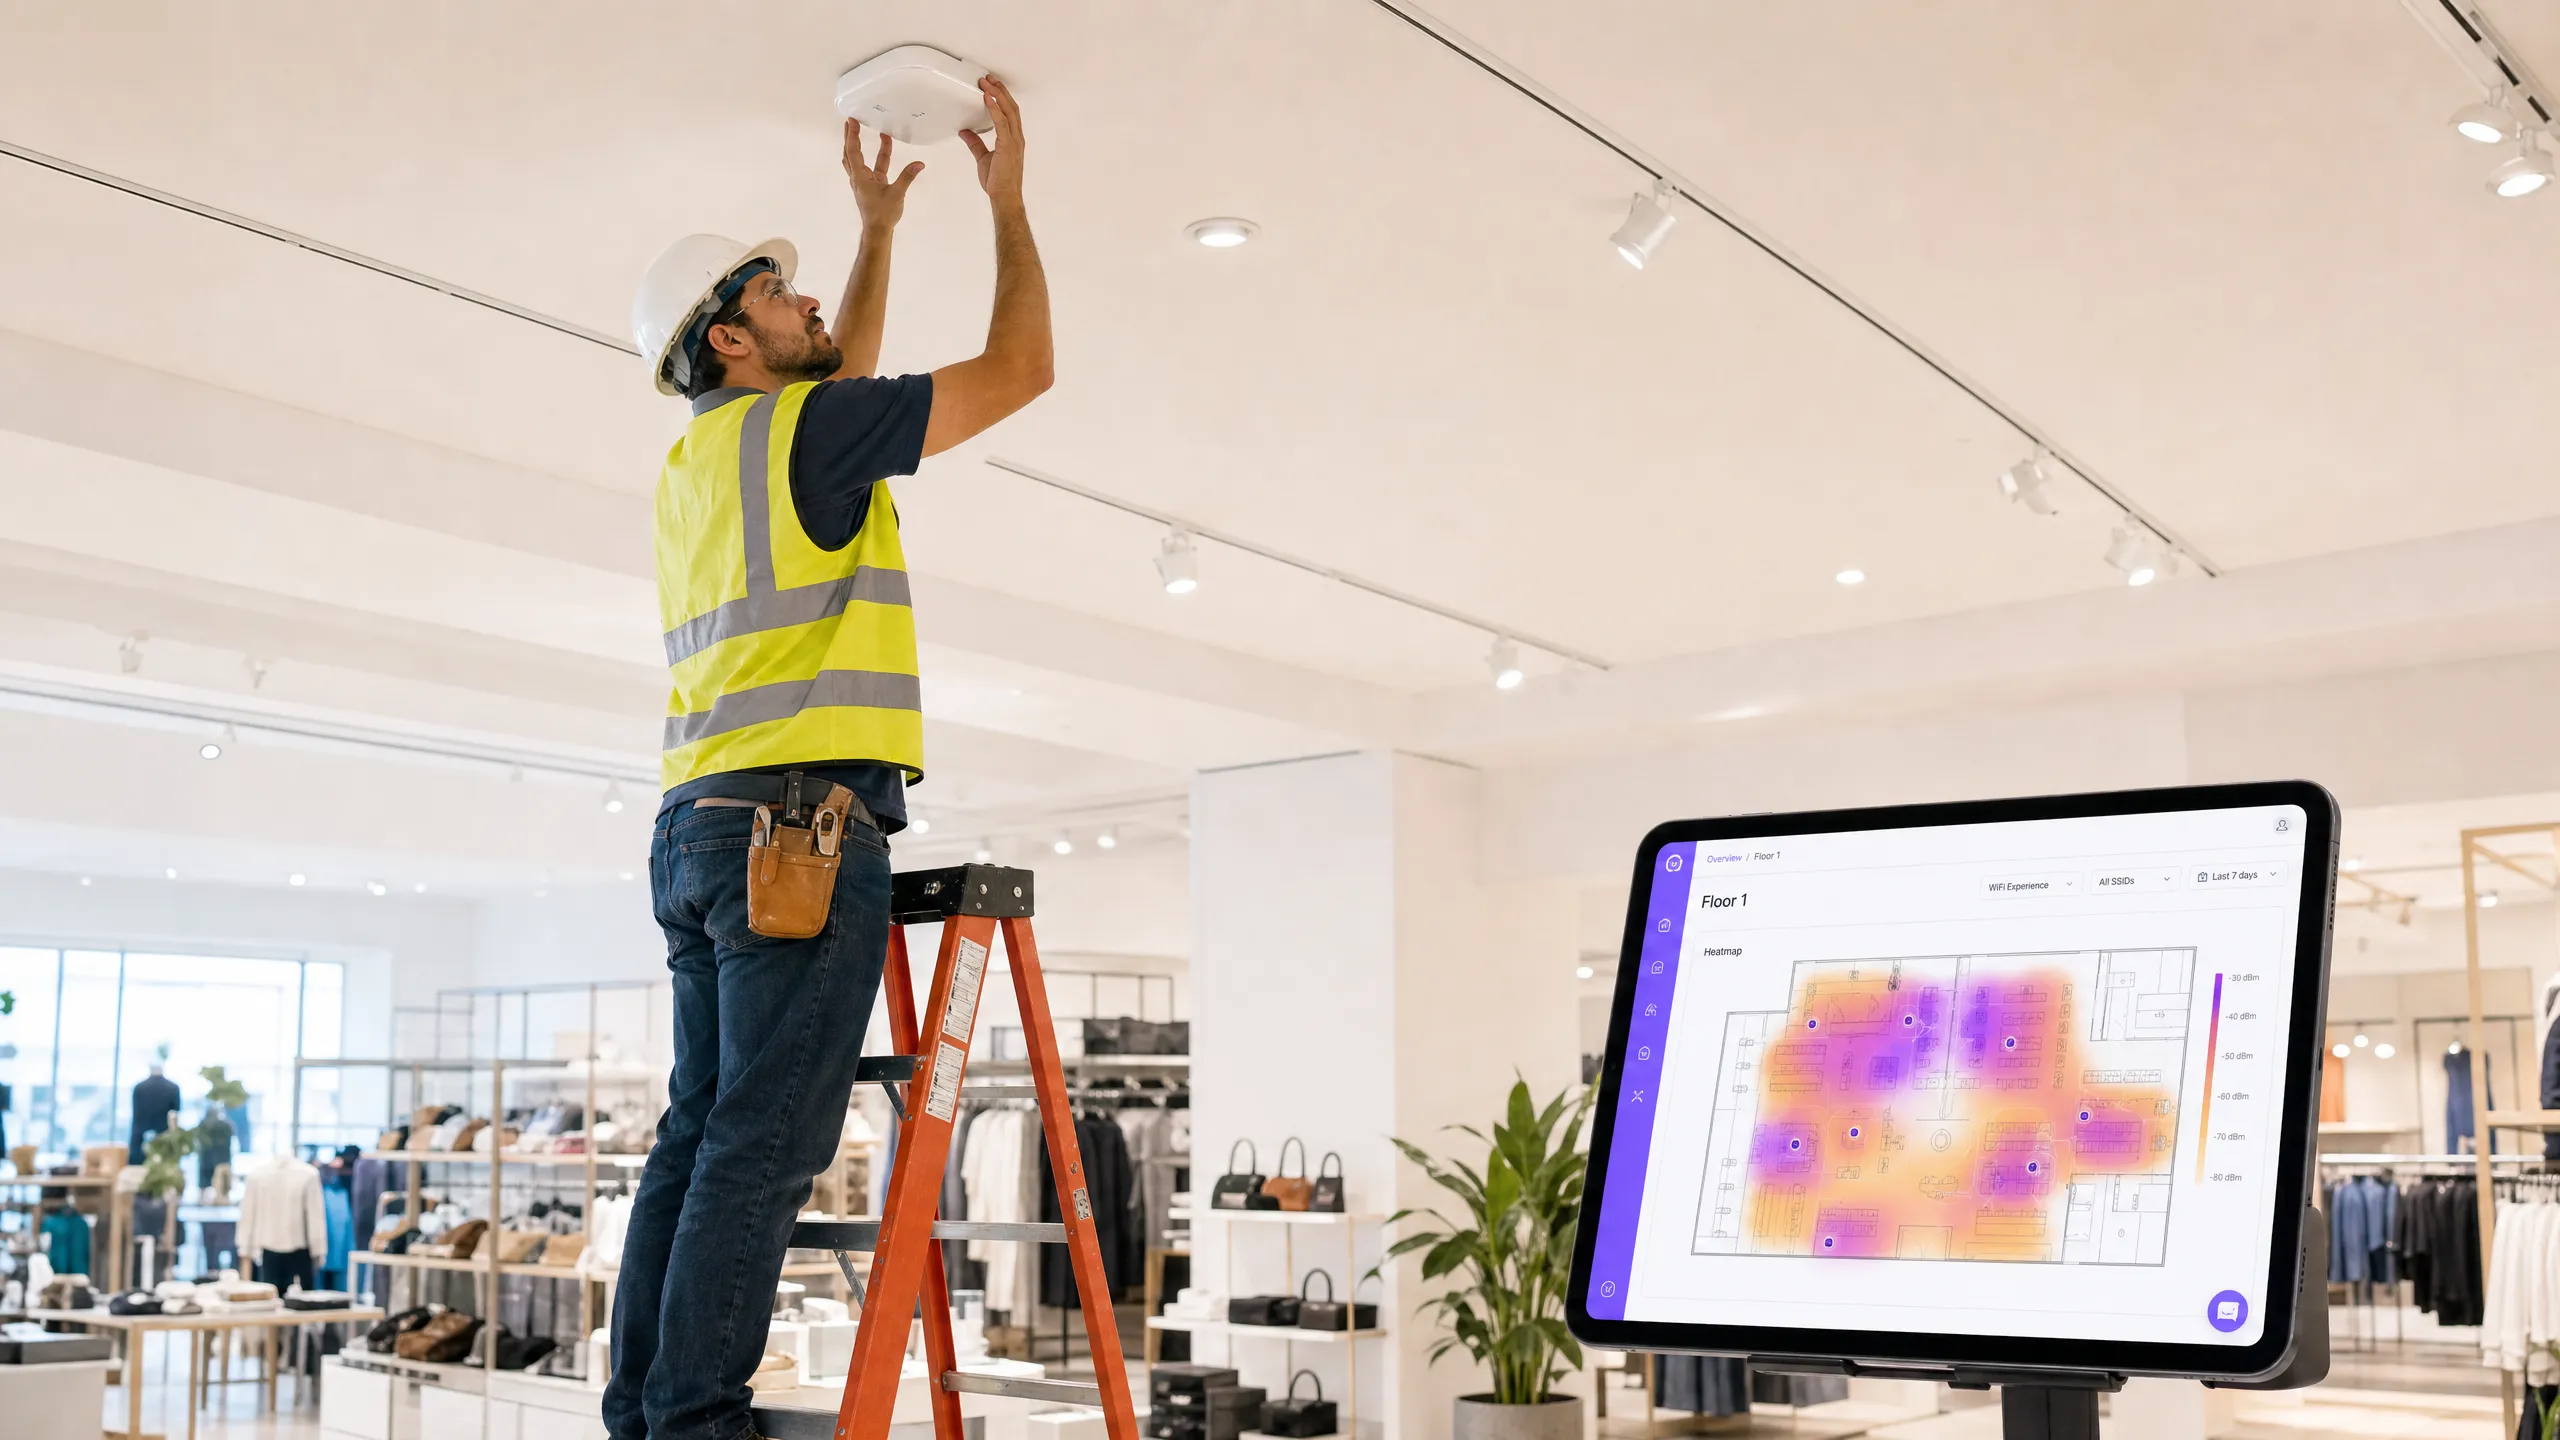
WiFi 熱圖是一種以基礎設施為中心的診斷工具,旨在測量射頻(RF)訊號傳播、識別覆蓋盲點並優化存取點(AP)的配置。存在分析則是一個商業智慧層,它利用相同的網路基礎設施來追蹤裝置移動、計算停留時間,並繪製訪客在實體空間中的行為軌跡。
本指南對這兩種方法進行了嚴謹的技術比較。我們將探討在零售、旅宿和大型公共環境中有效部署這些系統所需的底層架構、數據收集方法和實作框架。透過將這些功能對接至 Purple 的 Guest WiFi 和 WiFi Analytics 平台,我們為您提供了一套藍圖,幫助您從現有的網路硬體中榨取最大的投資報酬率(ROI)——而無需對實體基礎設施進行全面汰換。
技術深挖:架構與方法論
WiFi 熱圖:RF 診斷層
WiFi 熱圖的核心是依賴接收訊號強度指示(RSSI)測量值來構建網路覆蓋範圍的視覺化呈現。此過程對於網路規劃、故障排除和持續的效能驗證至關重要。
數據收集機制分為三類。主動調查(Active surveys)涉及裝置主動與 AP 關聯,以測量吞吐量、封包遺失率和延遲以及 RSSI——從用戶端視角提供網路效能視圖。被動調查(Passive surveys)使用掃描器在不關聯的情況下監聽所有頻道上的信標訊框(beacon frames)和探測回應(probe responses),提供包括同頻干擾和惡意 AP 檢測在內的整體 RF 環境視圖。預測建模(Predictive modelling)則在實際部署前,利用軟體根據平面圖、牆壁衰減值和 AP 天線圖形來模擬覆蓋範圍,實現部署前的驗證。
關鍵技術指標包括訊噪比(SNR),這對於確定特定區域內可實現的實際數據傳輸速率至關重要,且比單純的 RSSI 原始值更能可靠地反映品質。頻道重疊識別(Channel overlap identification)則能揭示相鄰 AP 在重疊頻率上運作的區域,這種情況會導致破壞性干擾,即使在訊號強度看似充足的情況下也會降低吞吐量。
存在分析:行為智慧層
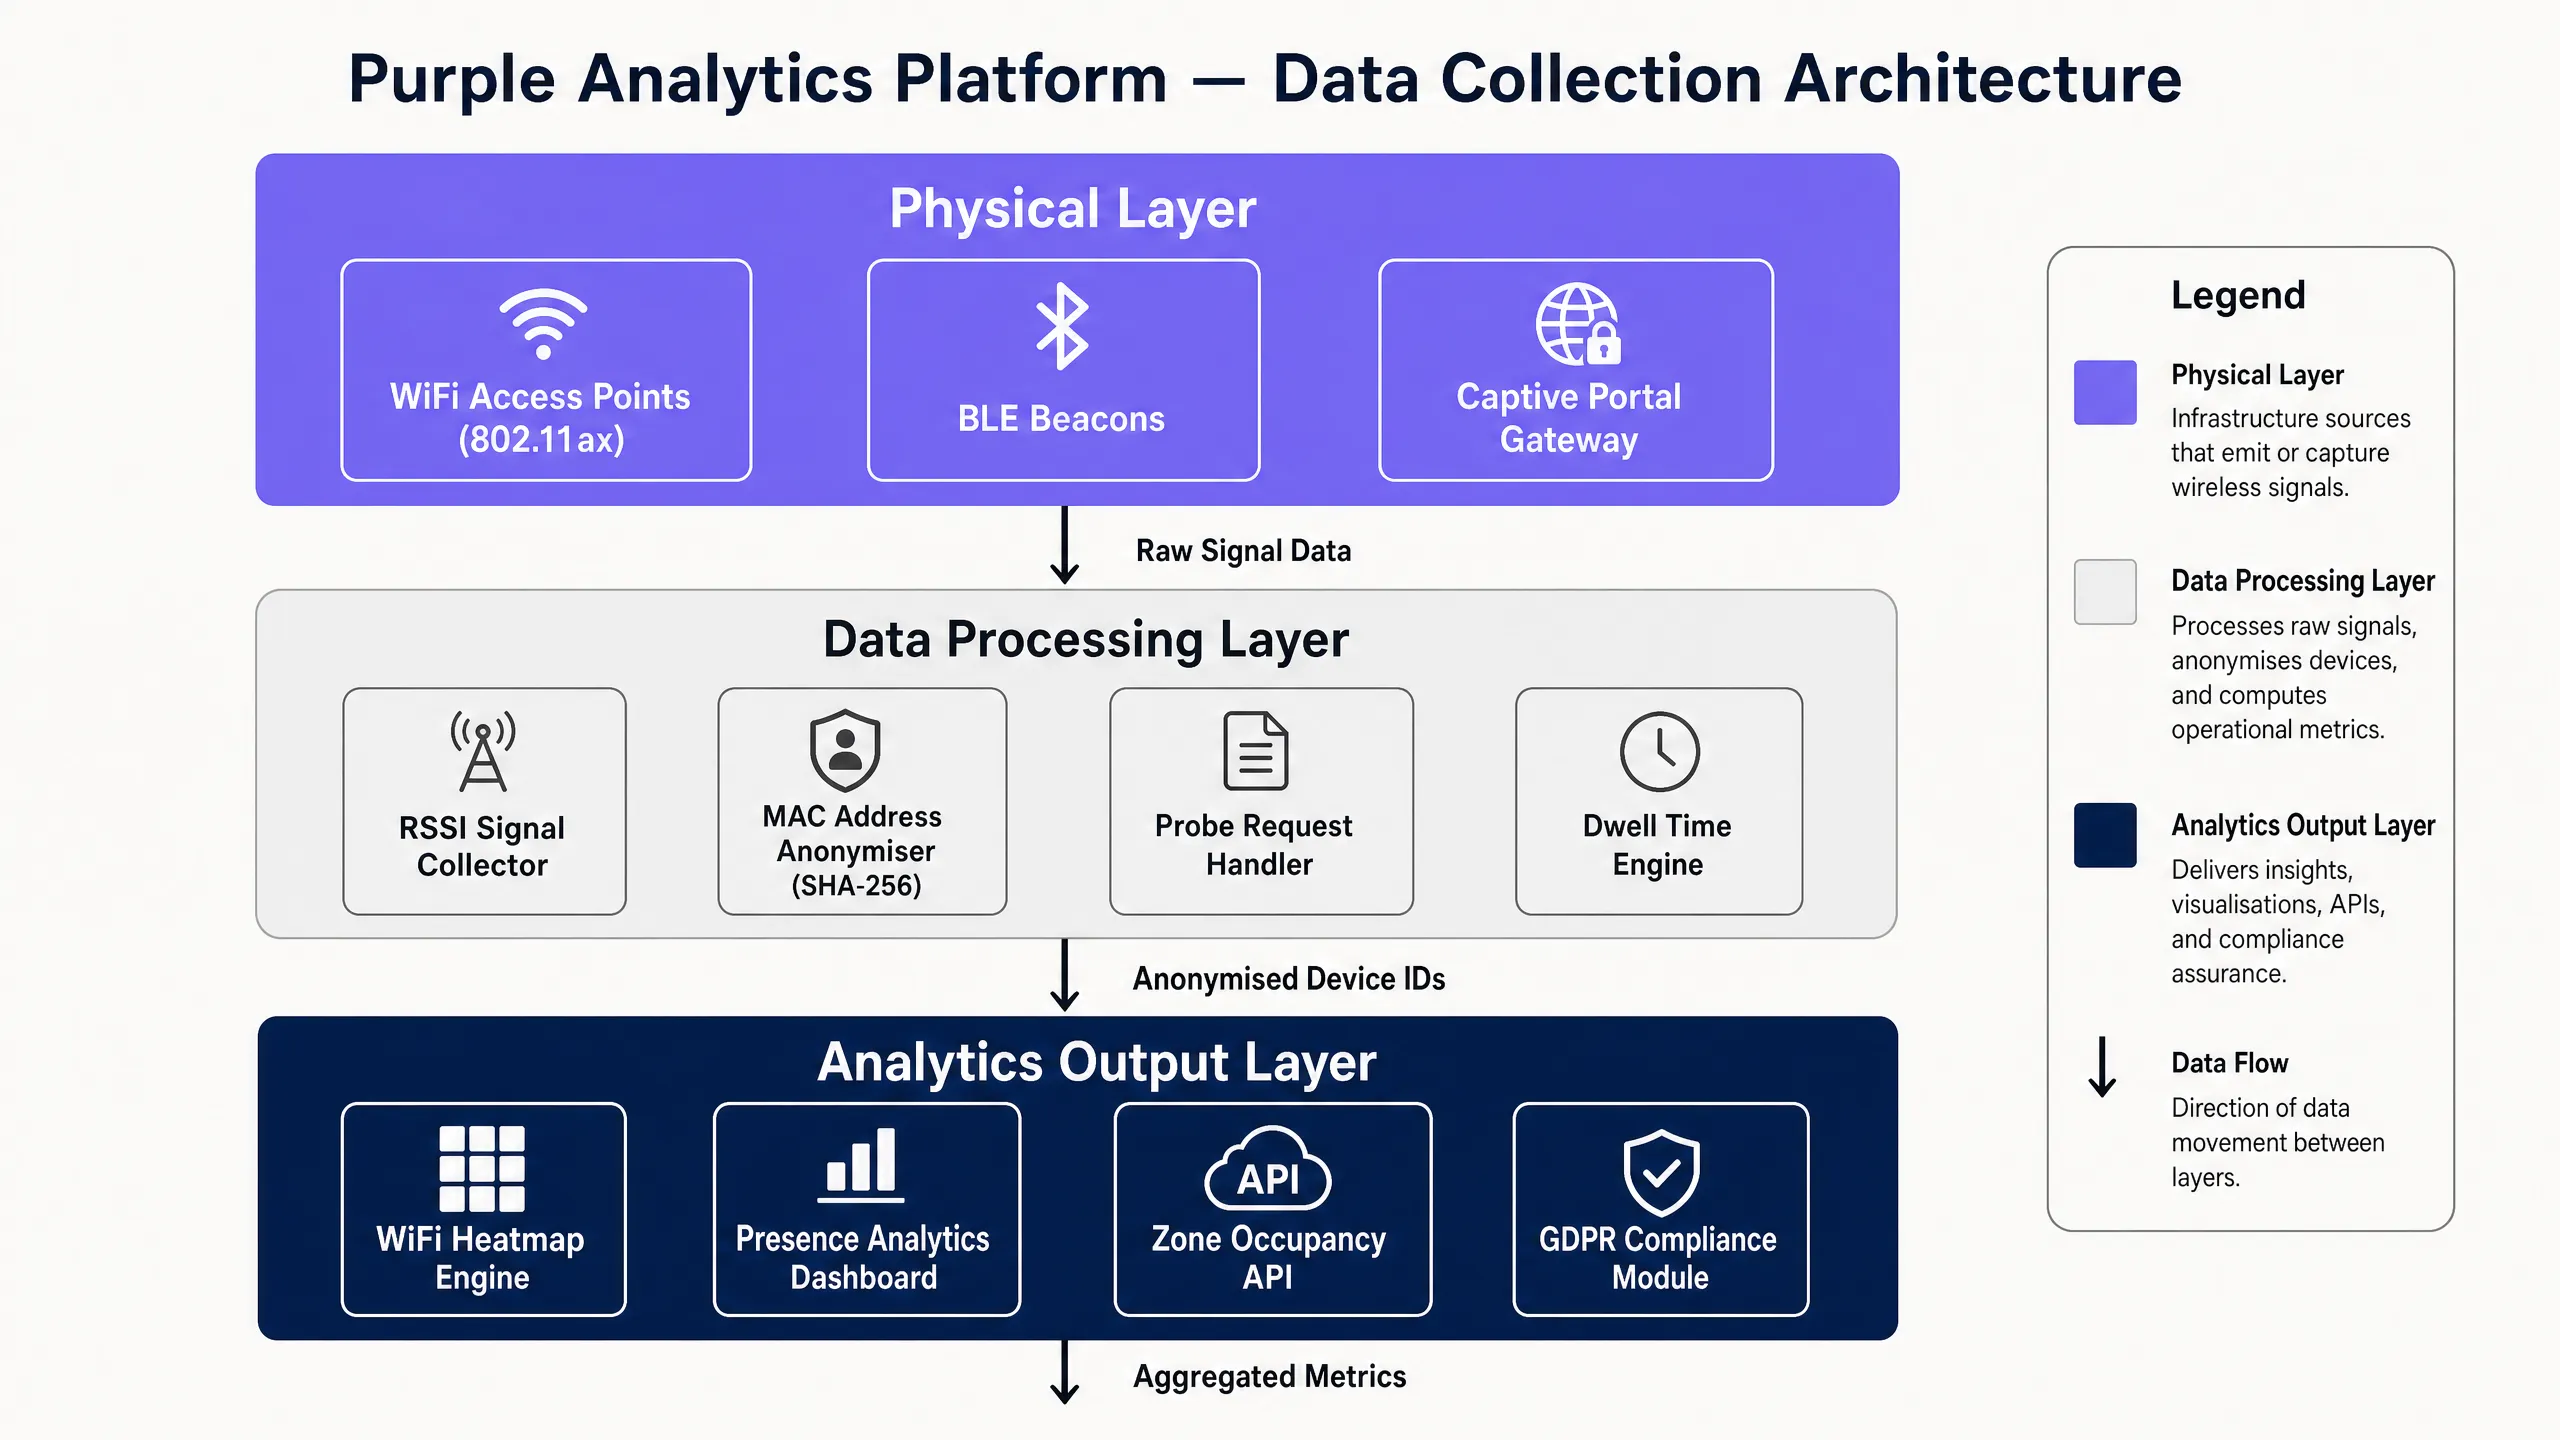
存在分析將焦點從網路基礎設施轉移到穿梭其中的裝置上。它主要依賴擷取探測請求(probe requests)——智慧型手機和平板電腦在搜尋已知網路時發射的管理訊框——以便在不需要未關聯裝置進行連線的情況下對其進行追蹤。
數據收集架構分為三個階段。首先,AP 或專用感測器攔截包含裝置 MAC 位址和訊號強度的未關聯探測請求。其次,為了符合包括 GDPR 和 CCPA 在內的隱私框架,MAC 位址在傳輸到分析引擎之前,會立即在邊緣端進行雜湊處理(使用 SHA-256 或同等演算法)——確保沒有任何個人識別資訊(PII)以原始格式跨網路傳輸。第三,三邊測量(trilateration)引擎比較單一裝置在三個或更多 AP 上的 RSSI,以計算該裝置的大致 X/Y 座標。欲深入瞭解此機制,請參閱我們的指南: WiFi 定位機制解析:三邊測量與 RSSI 詳解 。
關鍵區別:覆蓋範圍 vs. 情境資訊
企業部署中最常見的誤解是,認為提供充足覆蓋範圍的網路就自動做好了進行存在分析的準備。這是錯誤的。覆蓋範圍僅要求裝置能從一個 AP 接收到可用訊號。而用於存在分析的精確三邊測量,則要求裝置必須同時被至少三個 AP 偵測到,且訊號強度需達到 -75 dBm 或更佳。這種根本性的差異導致了完全不同的 AP 密度和配置需求。
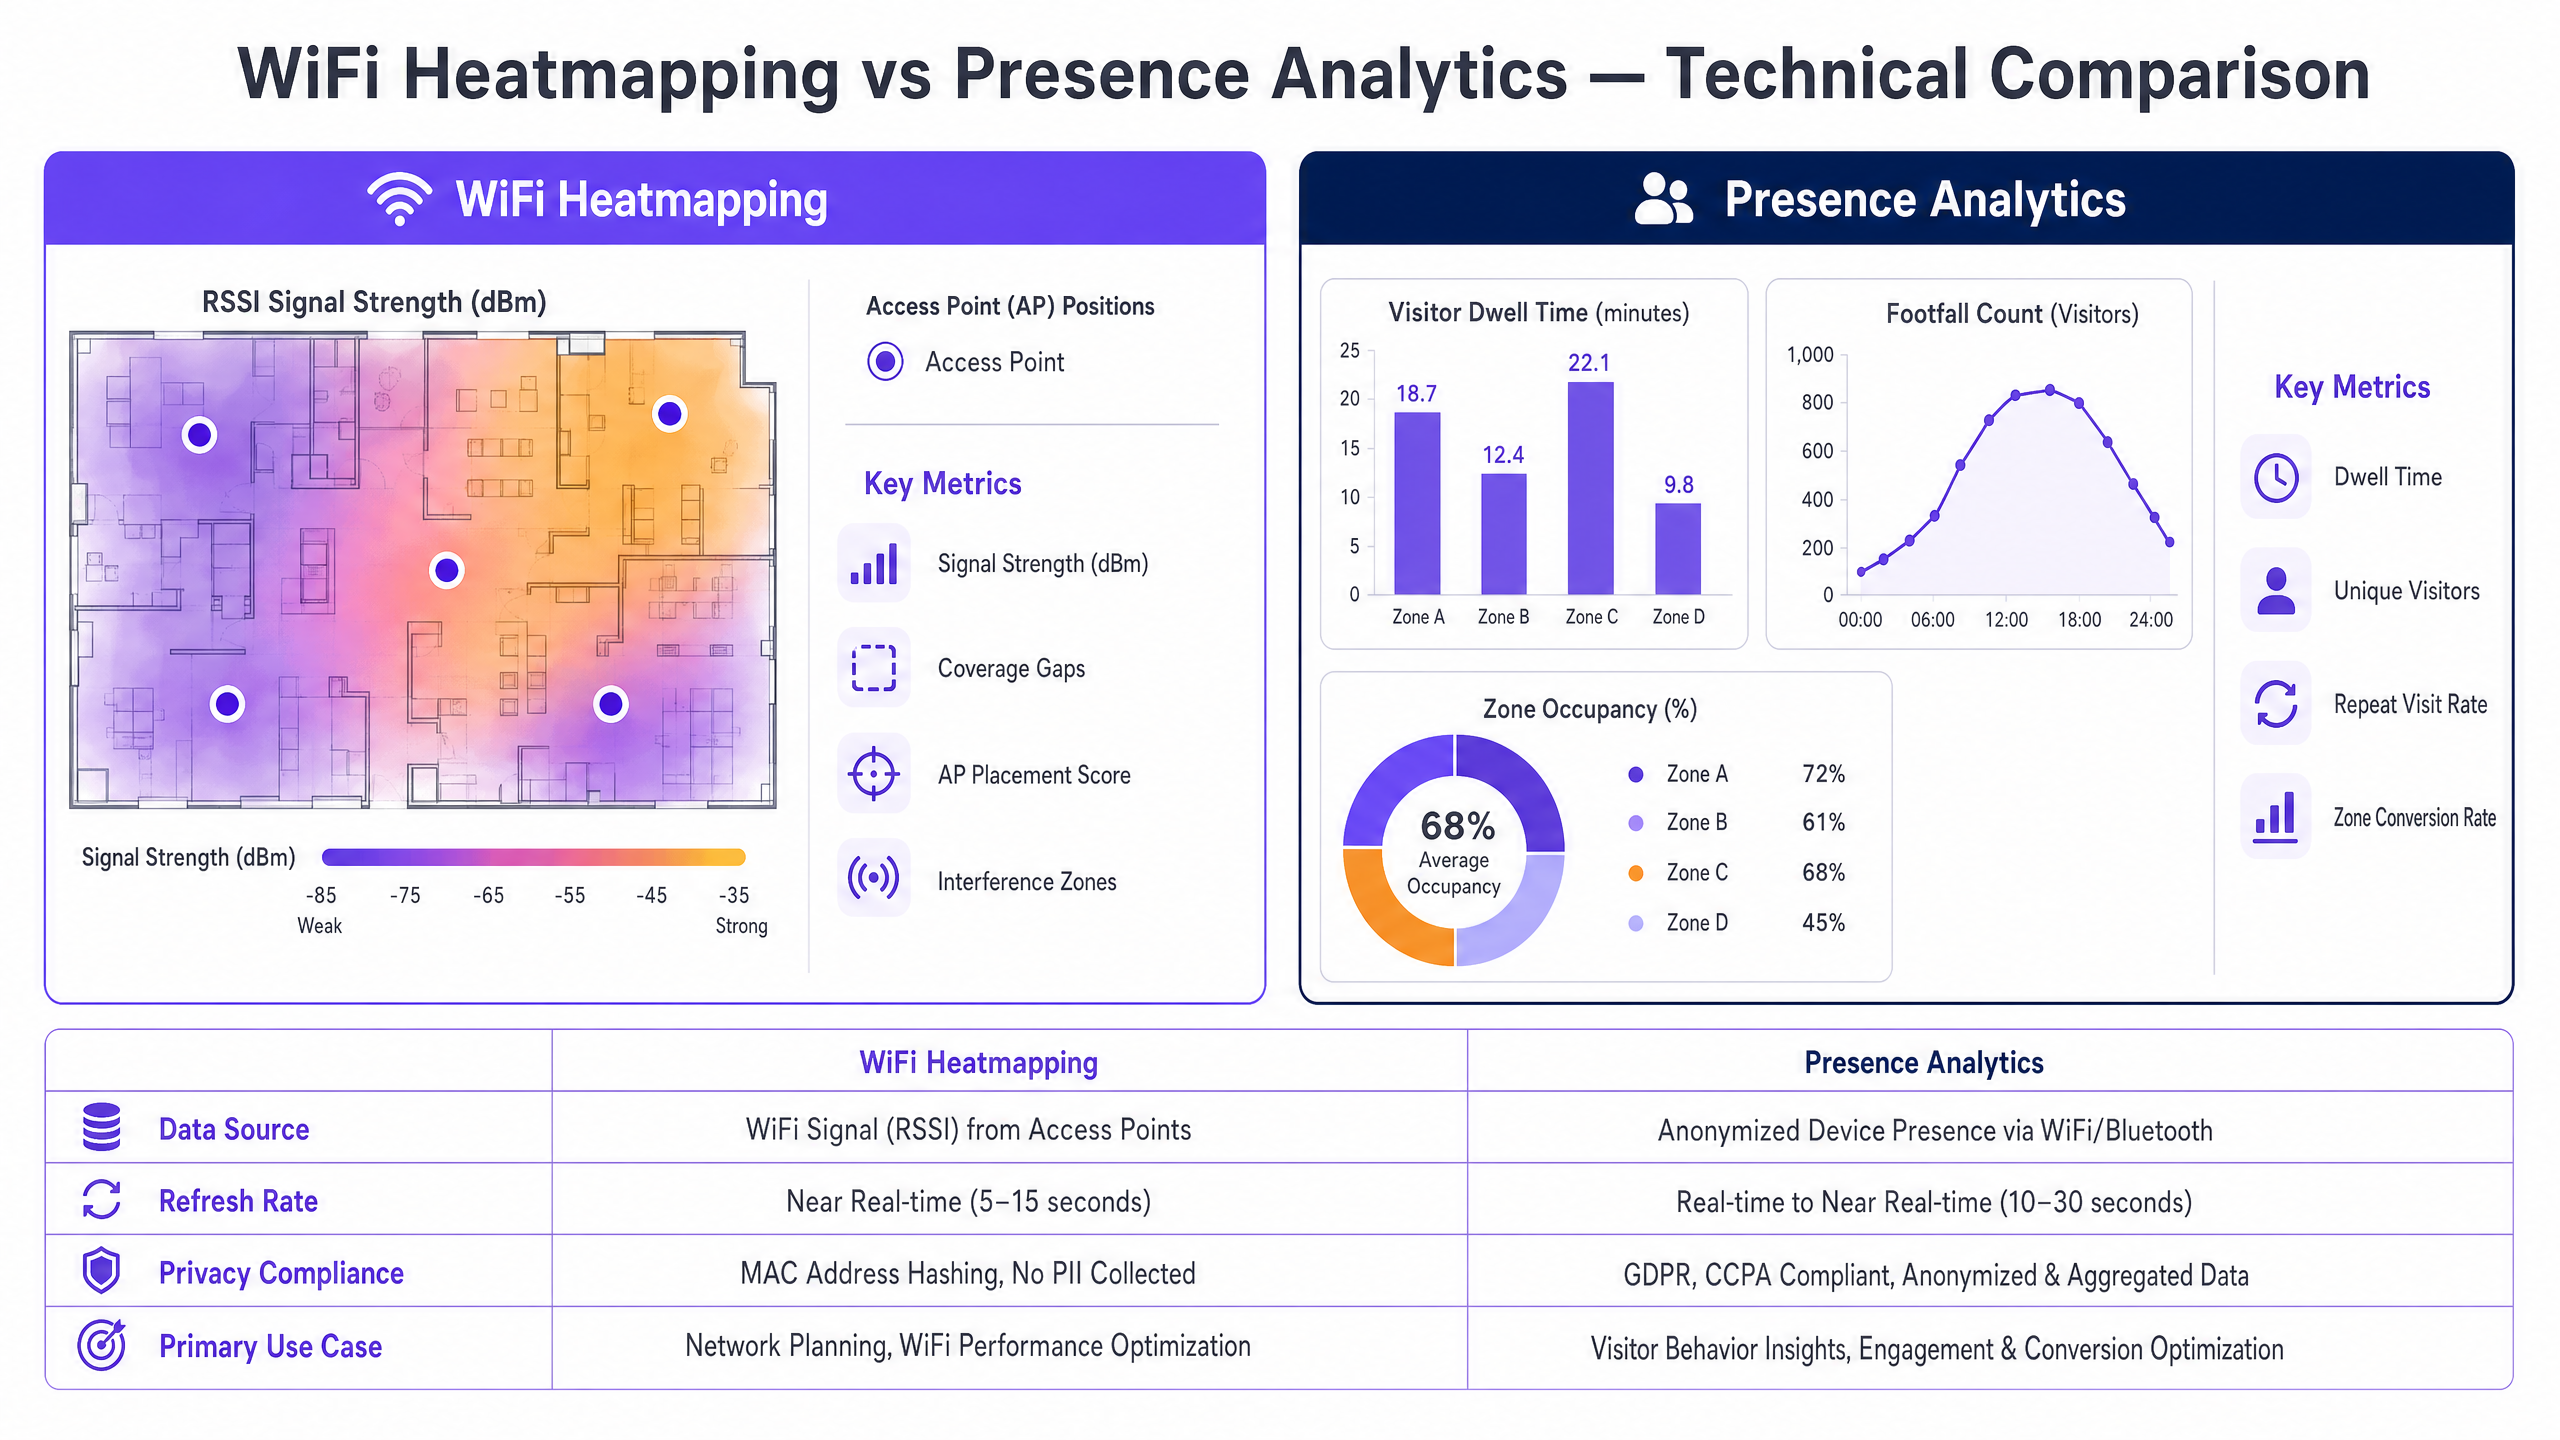
| 維度 | WiFi 熱圖 | 存在分析 |
|---|---|---|
| 主要數據源 | 來自 AP 信標的 RSSI | 來自用戶端裝置的探測請求 |
| 基礎設施需求 | 標準覆蓋密度 | 高密度(每個區域 ≥3 個 AP) |
| 數據更新率 | 接近即時(5–15 秒調查) | 即時(10–30 秒更新) |
| 隱私合規性 | 不收集 PII | 透過 MAC 雜湊符合 GDPR/CCPA |
| 主要應用場景 | 網路規劃與優化 | 訪客行為與商業智慧 |
| 關鍵輸出指標 | 訊號強度 (dBm), SNR | 停留時間、客流量、區域轉換率 |
實作指南:策略性部署
部署這些技術需要採取分階段的方法,平衡技術限制與業務目標。試圖在未針對存在分析設計的網路上部署該技術,是專案失敗最常見的單一原因。re。
階段 1:透過熱圖進行基礎設施評估。 在實施存在感分析之前,必須先驗證底層網路。進行全面的被動熱圖調查,以建立基準 RF 效能。識別訊號覆蓋盲區、同頻干擾區域以及高多路徑干擾區域(這在設有金屬貨架的零售環境中很常見)。此調查數據將直接為階段 2 所需的 AP 密度與部署位置決策提供依據。
階段 2:針對三邊測量進行網路重新設計。 根據熱圖數據,以存在感分析為考量重新設計 AP 的部署位置。將 AP 移至場域的周邊,而不是走廊中央——這能將三邊測量計算向外拉,並顯著提高空間精確度。確保每個目標區域都至少有三個 AP 覆蓋,且訊號強度達到 -72 dBm 或更高。在高干擾環境(如倉庫、具有金屬結構的體育場)中,可使用 BLE (Bluetooth Low Energy) 信標來輔助 WiFi 三邊測量,將空間解析度提升至 1-2 公尺。
階段 3:平台整合。 將分析引擎與您現有的硬體整合。Purple 的硬體相容平台透過標準 API 連接到包括 Cisco、Aruba、Ruckus 和 Meraki 在內的主要廠商——提取匿名化的存在感數據,而無需專有的覆蓋感測器或完整的硬體更換週期。
階段 4:區域配置與校準。 在分析平台內定義邏輯區域,以對應到實體業務區域(例如:「結帳區」、「大廳」、「女裝區」、「入口漏斗」)。將這些區域與熱圖階段中識別的實體 AP 覆蓋模式對齊。在正式上線前,進行校準測試以驗證區域邊界是否精確。
企業環境的最佳實踐
持續校準是不可妥協的。 RF 環境是動態變化的。零售業的庫存量、活動中的臨時結構,甚至人體都會吸收 RF 訊號。定期每季安排被動熱圖調查,以確保存在感分析引擎在精確的基準數據上運作。零售環境中季節性的賣場陳設調整,可能會在一夜之間使數個月的校準數據失效。
主動應對 MAC 隨機化。 現代作業系統(iOS 14+、Android 10+)會輪替 MAC 地址以防止被動追蹤。先進的分析平台必須採用啟發式演算法(分析訊號模式和探測時間)來拼接碎片的連線階段,以確保在 MAC 輪替的情況下仍能精確計算停留時間。然而,最有效的緩解措施是透過 Captive Portal 鼓勵裝置進行關聯。正如在 How a wi fi assistant Enables Passwordless Access in 2026 中所討論的,現代驗證方法可在登入時將匿名的 MAC 地址無縫轉換為已知的 CRM 個人檔案,從而提供確定性而非機率性的追蹤。
實施角色型數據存取。 存在感分析數據即使在裝置層級進行了匿名化,也可能透露敏感的營運模式。實施與 IEEE 802.1X 驗證標準一致的角色型存取控制 (RBAC),以確保只有授權人員才能存取原始分析數據,同時將彙整的儀表板提供給營運團隊。
將區域定義與業務 KPI 對齊。 區域配置的細緻度應直接反映您的業務問題。如果您需要衡量特定端架陳列的轉換影響,請在該細緻度層級定義一個區域。如果您只需要了解部門之間的大致人流量,較粗略的區域可以減少計算開銷並簡化報表。
疑難排解與風險緩解
故障模式:定位數據不精確(裝置跳躍)
症狀: 在分析儀表板中,裝置似乎在區域之間傳送,其移動路徑在物理上是不可能的。
根本原因: AP 密度不足或多路徑干擾——訊號從金屬表面反射,產生虛假的訊號讀數,導致三邊測量引擎混淆。
緩解措施: 重新進行熱圖調查,重點關注 SNR(信噪比)而非僅僅是 RSSI。某個區域可能顯示出足夠的訊號強度,但由於反射訊號而導致 SNR 較差。考慮在高干擾區域部署 BLE 信標,以更可靠的短距離訊號來增強 WiFi 定位數據。
故障模式:入口處停留時間異常偏高
症狀: 分析儀表板顯示場域入口附近的訪客計數和停留時間異常偏高,使整體客流量指標虛高。
根本原因: 入口附近的 AP 正在擷取來自場域邊界外街道或停車場裝置的探測請求。
緩解措施: 調整分析平台中的 RSSI 閾值。排除 RSSI 弱於 -80 dBm 的裝置數據,以過濾掉外部流量。此外,定義一個專門的「入口緩衝」區域,並將其排除在轉換率計算之外。
故障模式:MAC 隨機化導致連線階段碎片化
症狀: 不重複訪客計數顯著高於預期,且平均停留時間異常短暫。
根本原因: iOS 和 Android 的 MAC 隨機化正在將單個訪客的連線階段碎片化為多個虛擬裝置。
緩解措施: 部署 Captive Portal 以鼓勵裝置進行關聯。啟用分析平台的連線階段拼接演算法,該演算法利用訊號模式的連續性和時間啟發式方法來重構碎片的連線階段。對於顧客 WiFi 使用率高的 零售 環境,這通常可以解決 70-80% 的碎片化問題。
投資報酬率與業務影響
從基本網路建置到智慧化營運的轉變 收集從根本上改變了 IT 部門在組織內的價值定位。
零售營運代表了最明確的 ROI 案例。藉由將區域停留時間與銷售點(POS)數據進行關聯,IT 可以直接證明網路基礎設施如何對店面佈局優化和提高轉換率做出貢獻。一家擁有 50 家分店的零售商,如果透過 Presence 數據分析引導的佈局調整,使端架停留時間提高 5%,就能產生直接歸因於網路投資的可衡量營收增長。如需特定產業的部署指南,請參閱我們的 Retail 部門解決方案。
旅宿業部署可提供雙重 ROI。熱圖分析可確保整個物業內語音通話(Voice-over-WiFi)的 802.11r 快速 BSS 切換順暢無阻,直接減少顧客投訴。同時,Presence 數據分析可識別利用率低的設施(如 SPA、餐廳、商務中心),從而能透過 Captive Portal 進行精準的場域內行銷。如需更廣泛的顧客體驗策略,請參閱 How To Improve Guest Satisfaction: The Ultimate Playbook 。
公共部門與智慧城市部署正越來越多地利用 Presence 數據分析進行人群管理、交通樞紐優化和資源分配。正如我們在 Purple Appoints Iain Fox as VP Growth – Public Sector to Drive Digital Inclusion and Smart City Innovation 公告中所強調的,強大的數據分析是智慧城市倡議的基石,能為基礎設施投資和服務部署提供數據驅動的決策支援。
醫療保健環境可受益於 Presence 數據分析以優化患者分流,減少急診室和門診診所的瓶頸。結合 Purple 的 Healthcare 平台功能,去識別化的停留數據可以直接為人力配置模型和檢傷分類協定提供資訊,而無需處理任何患者的 PII。
透過將熱圖分析視為基礎診斷,並將 Presence 數據分析視為商業智慧層,IT 領導者可以將其無線網路從成本中心轉變為策略資產,直接為整個組織的商業和營運決策提供支援。
Key Definitions
RSSI (Received Signal Strength Indicator)
A measurement of the power level of a received radio signal, typically expressed in dBm (decibels relative to one milliwatt). Values range from approximately 0 dBm (strongest) to -100 dBm (weakest), with -65 dBm or better considered excellent for enterprise deployments.
The foundational metric for both heatmapping (determining coverage quality) and presence analytics (calculating distance for trilateration). IT teams encounter RSSI in survey tools, AP management consoles, and analytics platforms.
Trilateration
The process of determining a point's location by measuring its distance from three or more known reference points (access points), using the geometry of overlapping circles. Distinct from triangulation, which uses angles rather than distances.
The core algorithm used by presence analytics engines to calculate a device's X/Y coordinates on a floor plan. Requires a minimum of three APs with reliable RSSI readings to produce an accurate location estimate.
Probe Request
A 802.11 management frame sent by a wireless client device to discover available networks. Probe requests are broadcast on all channels and contain the device's MAC address and, in some cases, the SSIDs of previously connected networks.
The primary data source for passive presence analytics. Devices emit probe requests even when not connected to any network, enabling analytics platforms to track unassociated visitors.
MAC Randomisation
A privacy feature implemented in modern operating systems (iOS 14+, Android 10+) where a device uses a temporary, randomly generated MAC address when scanning for networks, rather than its permanent hardware (OUI) address.
The most significant technical challenge for passive presence analytics. Causes individual visitor sessions to appear as multiple distinct devices, inflating unique visitor counts and deflating dwell times. Mitigated by captive portal authentication.
Multipath Interference
A phenomenon where a radio signal reaches the receiving antenna via two or more propagation paths, typically due to reflection off surfaces. The reflected signals arrive with different phase delays, causing constructive or destructive interference that distorts RSSI readings.
A primary cause of inaccurate location data in presence analytics, particularly in retail environments with metal shelving or warehouses with racking systems. Identified during heatmapping surveys via anomalous SNR readings.
Passive Survey
A heatmapping technique where the survey tool listens to all RF traffic on all channels without connecting to any specific network. Captures data from all APs, including neighbouring networks and rogue devices.
Essential for identifying co-channel interference, rogue APs, and the full RF environment before deploying presence analytics. Provides a more comprehensive view than active surveys, which only capture data from the target network.
Dwell Time
The total duration a tracked device remains within a defined physical zone, calculated from the first probe request or association event to the last detected signal before the device leaves the zone.
A key business metric derived from presence analytics. Used to measure customer engagement in retail (time spent at a display), wait times in healthcare (A&E queue duration), and session attendance in conference environments.
Spatial Resolution
The degree of accuracy to which a presence analytics system can determine a device's physical location, typically expressed as a radius in metres (e.g., accurate to within 3 metres). Determined by AP density, AP placement geometry, and environmental RF characteristics.
Determines the granularity of presence analytics insights. Higher spatial resolution enables zone definitions at the level of individual displays or fixtures, while lower resolution only supports department-level or room-level analysis.
Signal-to-Noise Ratio (SNR)
The ratio of the desired signal power to the background noise power in a given location, expressed in dB. A higher SNR indicates a cleaner signal environment. An SNR of 25 dB or above is generally required for reliable high-throughput WiFi.
A more reliable indicator of WiFi quality than RSSI alone. An area can show strong RSSI but poor SNR due to interference, resulting in degraded throughput and unreliable location data. Always review SNR alongside RSSI in heatmapping surveys.
Worked Examples
A 50,000 sq ft retail warehouse is experiencing inaccurate presence analytics data — visitor paths appear erratic and dwell times are heavily skewed. The current network was designed purely for basic staff barcode scanner connectivity with APs placed down the centre aisles.
Conduct a passive heatmapping survey to establish baseline RSSI and SNR across the floor. Pay particular attention to SNR degradation near metal shelving runs, which are the primary source of multipath interference in this environment.
Redesign the AP layout. Move APs from centre-aisle positions to the perimeter walls. This dramatically improves the trilateration geometry by ensuring devices are 'pulled' toward the edges of the calculation, reducing the angular ambiguity that causes phantom location readings.
Increase AP density to ensure every square metre is covered by at least three APs at -72 dBm or better. In a 50,000 sq ft space with high shelving, this typically requires 20–30% more APs than a basic coverage design.
Configure the analytics platform to apply a minimum RSSI threshold of -78 dBm, filtering out weak signals that contribute to erratic location calculations.
Implement a Captive Portal offering free Guest WiFi to encourage visitors to connect, bypassing OS-level MAC randomisation for associated devices and providing deterministic tracking data.
A large conference centre needs to track attendee flow between a 2,000-seat keynote hall and eight breakout rooms to optimise catering deployment and session capacity planning. They have a legacy multi-vendor WiFi environment with Cisco APs in the main hall and Aruba APs in the breakout rooms.
Deploy a hardware-agnostic analytics platform — Purple's platform, for example — that can ingest standard syslog and RTLS data from both Cisco and Aruba controllers simultaneously via their respective APIs, normalising the data into a unified analytics stream.
Conduct a heatmapping survey specifically focused on the partition walls between breakout rooms. Thin partition walls are highly permeable to WiFi signals, causing significant zone bleed where a device in Room A appears to be in Room B.
Define precise polygon zones within the analytics platform corresponding to each specific hall and breakout room. Set RSSI cut-off thresholds (typically -70 dBm) to prevent bleed across partition walls.
Integrate the resulting zone occupancy API with the catering team's operational dashboard for real-time deployment alerts — triggering a notification when a breakout room reaches 80% capacity, for example.
Correlate zone occupancy data with session schedules to build predictive models for future event planning.
Practice Questions
Q1. Your retail operations director wants to measure the conversion rate of a new end-cap display in a specific aisle. The IT team confirms there is strong WiFi coverage throughout the store — all devices connect reliably and throughput is excellent. Is the network ready to deliver accurate presence analytics for this specific display?
Hint: Consider the difference between 'strong coverage' (one AP providing a usable signal) and the trilateration requirements for accurate zone-level location data.
View model answer
Not necessarily. Strong coverage and reliable connectivity only prove that devices can associate with the network. To accurately track dwell time at a specific end-cap display, the analytics engine needs to trilaterate the device's position to that specific zone — which requires the device to be simultaneously audible to at least three APs at -75 dBm or better. A store designed for coverage may achieve this with only one or two APs in that aisle. Before confirming readiness, run a heatmapping survey specifically to validate that the end-cap zone meets the three-AP trilateration threshold. If it does not, additional AP deployment or repositioning is required before the presence analytics data will be reliable.
Q2. A hospital A&E department is deploying presence analytics to track patient wait times. After one week of operation, the data shows that average dwell times are 8 minutes — far lower than the known average of 45 minutes — and unique visitor counts are 4x higher than actual patient throughput. What is the most likely cause and how should it be resolved?
Hint: Consider what modern smartphone operating systems do to MAC addresses when devices are not connected to a network.
View model answer
The most likely cause is MAC Randomisation. iOS 14+ and Android 10+ devices rotate their MAC addresses when sending probe requests, causing a single patient's device to appear as multiple distinct devices over the course of their visit. This fragments the 45-minute session into multiple apparent 8-minute sessions, inflating unique visitor counts and deflating dwell times. The recommended resolution is to implement a Captive Portal for the Healthcare guest WiFi network. Once a patient or visitor authenticates, the analytics platform tracks the persistently associated device MAC address, bypassing OS-level randomisation. For patients who do not connect, enable the platform's session-stitching algorithm, which uses signal pattern continuity and timing heuristics to reconstruct fragmented sessions. This typically resolves 70–80% of fragmentation in environments with high WiFi uptake.
Q3. During a planned network upgrade, your infrastructure vendor proposes replacing 60 omni-directional 802.11ax APs with 40 high-gain directional APs to improve throughput and reduce co-channel interference in a large stadium concourse. The project is approved. What is the mandatory action required to protect your existing presence analytics deployment, and what is the risk if this action is not taken?
Hint: Think about the two key factors that determine presence analytics accuracy: the number of APs and the RF propagation patterns they create.
View model answer
A complete post-deployment heatmapping survey and analytics recalibration is mandatory. The risk of not taking this action is significant: reducing the total AP count from 60 to 40 reduces the number of simultaneous data points available for trilateration, potentially dropping some zones below the three-AP threshold required for accurate location data. Furthermore, replacing omni-directional antennas with directional antennas fundamentally alters the RF propagation patterns across the concourse — the coverage footprints change shape and size, invalidating all previously calibrated zone boundaries in the analytics platform. Without recalibration, the presence analytics engine will produce systematically inaccurate location data, potentially misattributing visitor positions to adjacent zones. The heatmapping survey must be completed before the analytics platform is re-enabled post-upgrade.
Q4. A transport hub operator wants to deploy presence analytics across a multi-terminal airport using a mix of existing Cisco, Aruba, and Ruckus access points across different terminals. The operations team wants a single unified dashboard showing passenger flow across all terminals. What platform architecture decision is most critical to the success of this deployment?
Hint: Consider the implications of deploying a single-vendor analytics solution in a multi-vendor hardware environment.
View model answer
The most critical decision is selecting a hardware-agnostic analytics platform capable of ingesting data from all three vendor controllers simultaneously via their respective APIs (Cisco DNA Spaces, Aruba Central, Ruckus Analytics). Deploying a single-vendor analytics solution — for example, Cisco's native analytics tools — would only provide visibility into Cisco-managed APs, leaving the Aruba and Ruckus terminals as blind spots in the unified dashboard. A hardware-agnostic platform normalises the data from all three vendor streams into a single analytics layer, enabling truly unified passenger flow visibility across all terminals. This also future-proofs the deployment against hardware refresh cycles — if one terminal upgrades to a fourth vendor, the analytics layer can continue to function without disruption. Purple's platform architecture is designed specifically for this multi-vendor deployment pattern.
Continue reading in this series
First-party data marketing: a comprehensive guide for businesses
This guide explains how to build a robust first-party data marketing strategy using enterprise Guest WiFi networks. It covers the technical architecture for secure data capture via captive portals, GDPR-compliant consent workflows, CRM integration patterns, and automated campaign deployment. Venue operators across hospitality, retail, events, and public-sector environments will find actionable guidance for turning passive visitors into a high-quality, owned marketing audience.
Customer data management platform: a comprehensive guide for businesses
This guide explains how venue operators can deploy a customer data management platform to unify fragmented visitor data. It covers technical architecture, integration strategies, and the critical role of Guest WiFi in building first-party data profiles.